Astra TMA Channels

Astra TMA Channels

Triangular Moving Average Channel Indicator with Multi-Timeframe Support

Overview

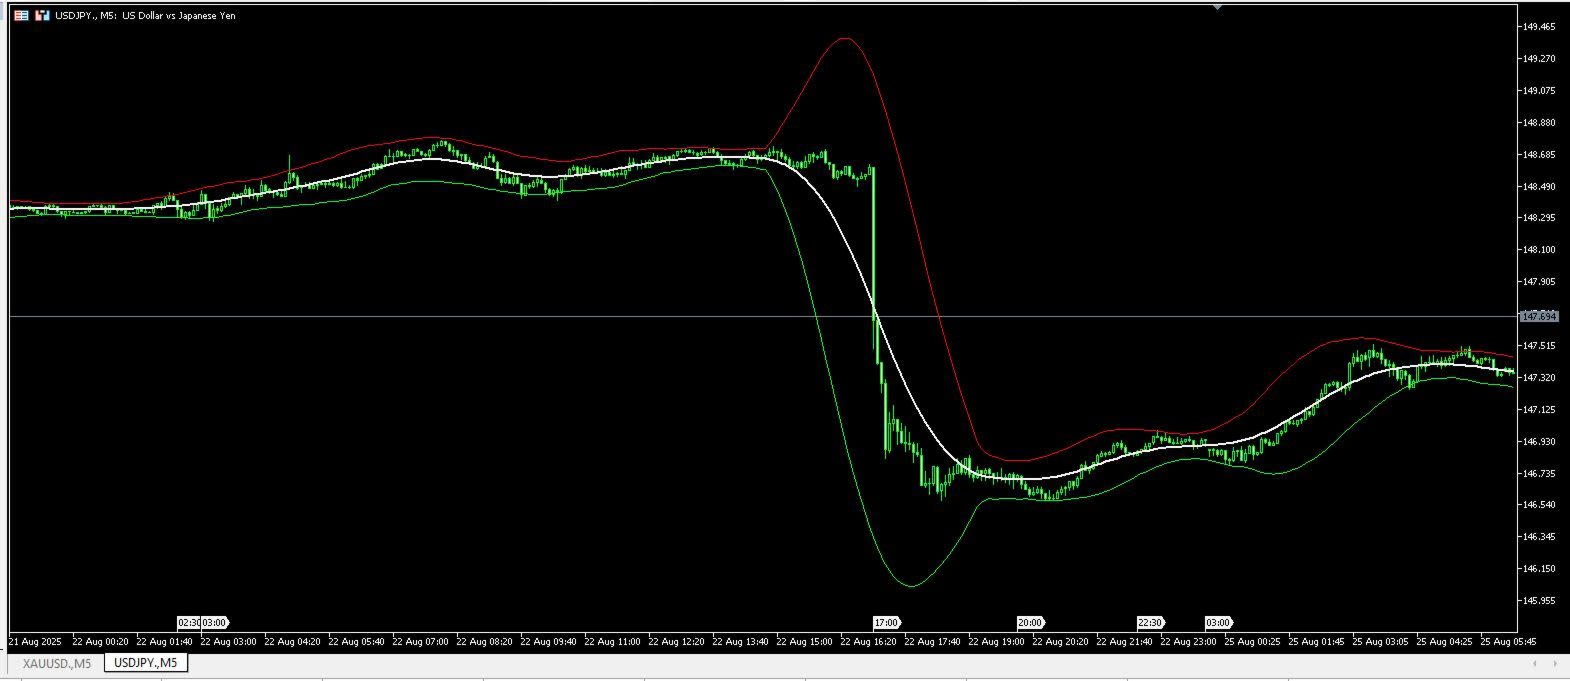
Astra TMA Channels is a channel-based technical analysis indicator built using Triangular Moving Average (TMA) calculations and dynamic upper/lower band structures.

The indicator is designed to visualize:

  • Trend direction
  • Price positioning relative to dynamic bands
  • Volatility expansion and contraction
  • Multi-timeframe market structure

The central line is calculated directly from price data to maintain close alignment with market movement.

Main Features

TMA-Based Central Line

The indicator uses a Triangular Moving Average calculation to generate a smoothed central trend line.

Functions:

  • Trend direction visualization
  • Smoothed price structure analysis
  • Directional slope observation

The central line can be adjusted using configurable period settings.

Dynamic Upper and Lower Bands

The indicator calculates upper and lower channel bands around the central TMA line.

Features:

  • Volatility-responsive channel structure
  • Dynamic band expansion and contraction
  • Configurable band distance settings

Band behavior changes according to market volatility and selected parameters.

Multi-Timeframe Support

The indicator supports multi-timeframe calculations directly from the active chart.

Functions:

  • Higher timeframe projection
  • Current timeframe operation
  • Cross-timeframe structural observation

This allows traders to monitor broader market conditions while remaining on the current chart timeframe.

Trend Color Visualization

The indicator supports automatic color changes based on directional channel behavior.

Functions:

  • Uptrend color display
  • Downtrend color display
  • Visual trend state identification

Color settings can be customized through the indicator inputs.
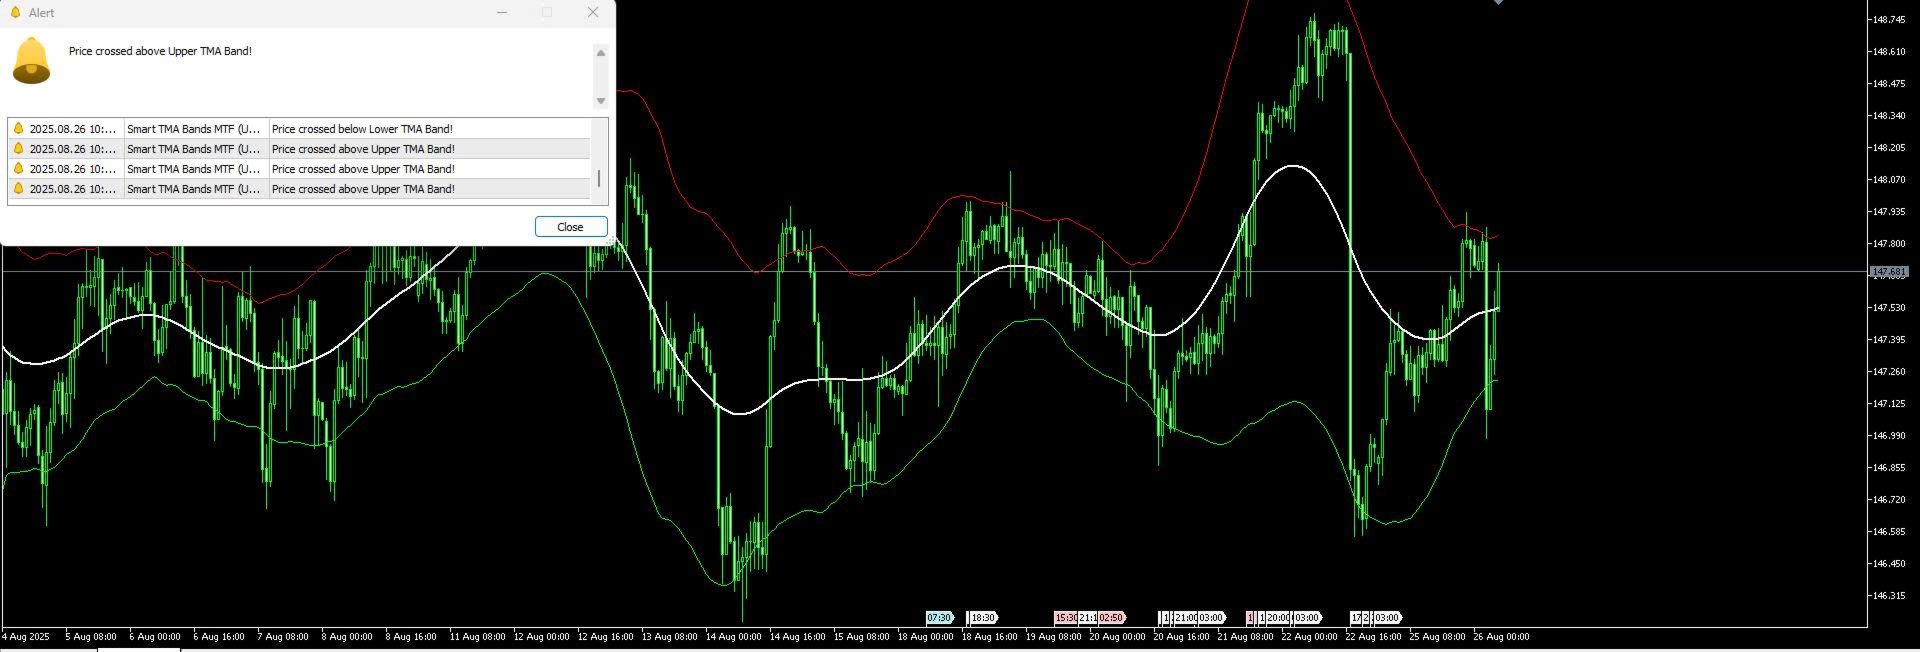
Alert System

The indicator supports configurable notifications when price interacts with channel levels.

Available Alerts:

  • Price crossing upper band
  • Price crossing lower band
  • Trend direction changes

Supported notification types:

  • Pop-up alerts
  • Sound alerts
  • Push notifications
  • Email alerts

Alerts can be enabled or disabled independently.

Input Parameters

Main configurable settings include:

  • Band period
  • Deviation multiplier
  • Timeframe selection
  • Trend color display
  • Alert configuration
  • Visual style settings

These parameters allow the indicator to be adapted to different trading styles and volatility conditions.

Usage Applications

The indicator may be used for:

  • Trend monitoring
  • Channel-based analysis
  • Volatility observation
  • Multi-timeframe workflows
  • Technical chart analysis

It can also be combined with:

  • Price action analysis
  • Candlestick structure
  • Oscillator confirmation
  • Support and resistance analysis

Example Workflows

Trend Observation

  • Upward channel slope may indicate upward directional structure
  • Downward channel slope may indicate downward directional structure

Channel Interaction Analysis

  • Price interaction with upper or lower bands may be used as part of broader technical analysis workflows

Multi-Timeframe Observation

  • Higher timeframe channels may be monitored together with lower timeframe structures for broader market context

Compatibility

Supported Markets:

  • Forex
  • Indices
  • Commodities
  • Cryptocurrency

Supported Timeframes:

  • All MetaTrader timeframes

The indicator supports multi-timeframe chart operation.

Operational Notes

General Recommendations:

  • Test settings according to instrument volatility
  • Use additional confirmation methods where appropriate
  • Adjust channel parameters depending on timeframe selection

Indicator behavior may vary depending on market conditions and parameter configuration.

The indicator is intended as a technical analysis tool and does not provide guaranteed market prediction.

Conclusion

Astra TMA Channels is a TMA-based channel analysis indicator combining:

  • Triangular Moving Average calculations
  • Dynamic channel bands
  • Multi-timeframe support
  • Trend visualization
  • Configurable alert functions

The indicator is designed for traders using channel-based and multi-timeframe technical analysis workflows.

Suggested Tags

TMA Indicator, Channel Indicator, MTF Indicator, Trend Analysis, Volatility Bands, Technical Analysis, Forex Indicator, MetaTrader Indicator, Channel Trading, Multi Timeframe

おすすめのプロダクト
Renko Chart
Marcin Konieczny
3.56 (9)
This indicator allows to display Renko charts in the indicator window. Renko charts show only price movements that are bigger than the specified box size. It helps to eliminate noise and allows to focus on main trends. Time is not a factor here. Only price movements are taken into account. That's why Renko chart is not synchronized with the main chart it is attached to. Indicator works in two modes: CLOSE - only close prices are taken into account while building the chart HIGH_LOW - only high/l
FREE
Gino Renko
Stephane, Andr Valette
1 (1)
Another renko-based indicator. It returns different usable values ​​for an EA, and is directly displayed on the main chart. Its setting is very simple: The size of the renko The number of bars taken into account The falling color The color on the rise Returned values: Buffer 0 : Value of the middle Buffer 1 : Value of the Top Buffer 2 : Value of the Bottom Buffer 3 : Direction of renko (0.0 for top ; 1.0 for bottom) Buffer 4 : Ratio of the renko, for example, if it is twice, 3 times, ro more of
2本の加重移動平均線(WMA)をチャート上に表示し、低モメンタムおよびレンジ相場を自動検出するプロフェッショナル向けインジケーターです。 WMA1は始値を基準に計算され、軽微なオフセット付きでトレンド方向を示します。 WMA2は終値を基準に計算され、モメンタムの確認に使用されます。 2本のWMA間の距離が縮小すると、ローソク足は自動的にグレー表示となり、市場がレンジまたは調整局面に入っていることを警告します。 すべての通貨ペア、指数、商品、そして全時間足で使用可能です。 SuperSmooth WMA Trading System Proへアップグレード Pro版では、エントリー/イグジットシグナル、ロング/ショートのローソク足カラー表示、上位足EMAトレンドフィルター、MACDモメンタム確認、SMA方向フィルター、リアルタイムアラート、時間足フィルター設定機能を追加。 すべてのフィルターが一致した場合のみシグナルを生成し、誤シグナルを大幅に削減します。 このインジケーターが役に立つと感じた場合は、ぜひレビューをご検討ください。あなたのフィードバックは、他のトレーダーがこのツールを
FREE
A professional tool for trading - the divergence indicator between the RSI and the price, which allows you to receive a signal about a trend reversal in a timely manner or catch price pullback movements (depending on the settings). The indicator settings allow you to adjust the strength of the divergence due to the angle of the RSI peaks and the percentage change in price, which makes it possible to fine-tune the signal strength. The indicator code is optimized and is tested very quickly as par
FREE
This utility EA will display simple renko, hence the name essential renko. The renko will be shown in a new tab and using custom symbol. Please do note (especially for those who new to Renko), that Renko does not follow timeline as it will follow price movement. That's why it has a lot of potential where you can attach any EA that you want and use any custom indicator in this new custom symbol for renko. Always use M1 timeframe. Most of the time you don't need to change anything. But if you d
FREE
This indicator calculates fibonacci levels via moving averages trend and draw these lines. You can change fast and slow Moving Averages settings for customization. Inputs: Fast MA Time Period :  64 Fast MA Shift: 0 Fast MA Method: Smoothed Fast MA Apply To: Median Price Slow MA Time Period: 32 Slow MA Shift: 0 Slow MA Method: Smoothed Slow MA Apply To: Median Price ZigZag: False ZigZag Color: Red ZigZag Type: DashDot ZigZag Width: VeryThin Fibo Settings TrendFibonacci: True FiboTrendColor: Black
FREE
Cybertrade Double Bollinger Bands - MT5  The Bollinger Bands indicator shows the levels of different highs and lows that a security price has reached in a given duration and also their relative strength, where the highs are close to the upper line and the lows are close to the lower line. Our differential is to present this indicator in a double form, with the availability of its values ​​to simplify automation. It works on periods longer than the period visible on the chart. All values ​​are
FREE
BerelzBox Darvas based
Barend Willem Van Den Berg
5 (1)
概要 BerelzBox Darvas は MetaTrader 5 用の Darvas Box インジケーターです。現在のローソク足にリアルタイムで更新されるボックスを描画し、参照用に前回の完成したボックスを表示します。ボックスはカラーコード化されたゾーンに分割され、潜在的なエントリーエリアとブレイクアウト条件の特定に役立ちます。 このインジケーターは、Nicolas Darvas の古典的なボックス理論に基づき、現代のマルチタイムフレーム使用に適応させたものです。 仕組み インジケーターは選択したタイムフレーム(デフォルト H4)で各ローソク足ごとに1つのボックスを作成します。現在のボックスは bar 0 の形成に合わせて毎ティック更新されます。前回のボックスは比較のために固定されたまま残ります。 各ボックスは6つのグラデーションゾーンに分割されます: 緑色ゾーン(下半分)は買いエッジエリアを示し、ボックスの安値付近でより濃い色になります 赤色ゾーン(上半分)は売りエッジエリアを示し、ボックスの高値付近でより濃い色になります 点線の中間線が2つの半分を分離します 設定可能な Edg
FREE
Are you tired of drawing trendlines every time you're analyzing charts? Or perhaps you would like more consistency in your technical analysis. Then this is for you. This indicator will draw trend lines automatically when dropped on a chart. How it works Works similar to standard deviation channel found on mt4 and mt5. It has 2 parameters: 1. Starting Bar 2. Number of bars for calculation The   starting bar   is the bar which drawing of the trend lines will begin, while the   number of bars for c
FREE
AliPivot Points is a Meta Trader 5 Indicator that draws you the latest pivot points. You can choose from timeframes ranging from 1 Minute to 1 Month. Calculation methods for pivot points includes: Classic Pivot Points Camarilla Pivot Points Fibonacci Pivot Points Woodie Pivot Points You can personalize the line colors, style, and width to suit your preference. The indicator displays values on the right side of the chart. AliPivot Points values can also be utilized by developers for creating Expe
FREE
"Inside Bar PA" is a technical indicator for the MetaTrader 5 platform, designed to automatically detect the Inside Bar pattern on the chart. An Inside Bar is a candle whose high and low are completely within the range of the previous candle (mother bar). This pattern often signals market consolidation and can precede a strong price movement. Features: • Automatic detection of all Inside Bars on the chart • Visual marking with arrows: green up arrow for bullish Inside Bars (close >= open), gr
FREE
LongTerm は、中長期 trend の強さと質を解釈するために設計された方向性分析インジケーターであり、long oriented 分析に特化しています。 これはエントリーインジケーターでも運用 timing ツールでもなく、市場が long trend に対して有利または不利な条件を提供している時をトレーダーが理解するのを助けるために設計されたツールであり、短期変動に典型的なノイズを減らします。 目的 LongTerm は以下のために作られています: 強く構造化された long trends を識別する 拡大、減速、消耗のフェーズを区別する 支配的な方向性コンテキストを明確に読み取る これは swing trading と long term 分析を志向するトレーダーに理想的なツールです。 色と市場条件の解釈 LongTerm は、long trend のさまざまなフェーズを即座に読み取れるように設計されたカラー構造を使用し、市場の最良および最悪の条件を明確に強調します。 緑のライン 正の傾きで青のラインの上 この構成は最良の条件を表します。 Long trend は強く、安定
FREE
Daily Time Lines Indicator for MT5 Daily Time Lines is a simple and powerful chart tool for MetaTrader 5 that automatically draws vertical and horizontal lines at a specific time each day. Perfect for marking session opens, key levels, or important trading moments directly on your chart. Main Features Automatic daily vertical line at a selected time Optional horizontal line starting from the same point Horizontal line can end: At the end of the day Or extend for a customizable number of future d
FREE
Raymond Cloudy Day Indicator for MT5 – Pivot-Based Reversal and Trend Levels Raymond Cloudy Day Indicator is a pivot-based level indicator for MetaTrader 5 (MT5). It was developed by Ngo The Hung based on Raymond’s original idea and is designed to give a structured view of potential reversal zones, trend extensions and support/resistance levels directly on the chart. The default settings are optimised for XAUUSD on the H1 timeframe, but the indicator can be tested and adjusted for other symbols
FREE
English VWAP Daily (Clean) is a simple and lightweight indicator that plots the classic Daily VWAP (Volume Weighted Average Price) directly on your MT5 chart. Features: Classic Daily VWAP calculation Supports real volume (if available) or tick volume Timezone offset option to match your broker’s server time Weekend merge option (merge Saturday/Sunday data into Friday) Clean version → no arrows, no alerts, only VWAP line VWAP is widely used by institutional traders to identify fair value, su
FREE
This SMT (Smart Money Technique) divergence indicator identifies discrepancies in price movement between two different trading symbols, helping traders detect potential market reversals. This tool compares the price action of two correlated assets, such as two currency pairs or indices, to spot divergences where one asset's price moves in the opposite direction of the other. For example, while one symbol may be making higher highs, the other might be making lower highs, signaling a divergence. T
FREE
Harmonic Pattern Suite Pro Introduction Harmonic Pattern Suite Pro is an indicator designed to identify and display harmonic structures on the chart based on X-A-B-C-D sequences. Its purpose is to present pattern formations that meet geometric and proportional criteria, providing a clear visual representation directly on the chart. The indicator automates the detection process, removing the need for manual measurement of ratios and allowing the user to review the structural configuration withou
FREE
Magic 7 Indicator
Marek Pawel Szczesny
5 (1)
Overview Magic 7 Indicator is a comprehensive MetaTrader 5 (MQL5) indicator that identifies seven different trading scenarios based on candlestick patterns and technical analysis. The indicator combines traditional price action patterns with modern concepts like Fair Value Gaps (FVG) to provide trading signals with precise entry points and stop loss levels. Features 7 Trading Scenarios : Each scenario identifies specific market conditions and trading opportunities Visual Signals : Clear buy/sell
FREE
"Five Minute Drive" indicator that is designed to be used in the 5 minute timeframe only. One of its most important advantages is that it shows the general trend in the upper time frames when looking at the 5-minute timeframe. Therefore, when opening positions in the 5 minute timeframe, when it is in line with the trends in the upper timeframes, you are less likely to be upside down. If you can interpret the curvilinear and linear lines drawn by this indicator on the graphic screen with your geo
FREE
デュアルライン信号、2レベルシステム、マルチタイムフレーム対応、カスタマイズ可能なビジュアル信号、高度に設定可能なアラートシステムを備えた高度なFisher Transformインジケーター。 フリーランスプログラミングサービス、アップデート、その他のTrueTL製品は私の MQL5プロフィール からご利用いただけます。 フィードバックとレビューを心よりお待ちしております! Fisher Transformとは? Fisher Transformは、価格をガウス正規分布に変換するテクニカルインジケーターです。John Ehlersによって開発され、価格を極端な正および負の値の間で振動する値に変換することで価格の転換点を増幅します。 このインジケーターは鋭く明確に定義された転換点を生成し、潜在的なリバーサルの発見を容易にします。+2.0以上の値は極端な買われすぎ状態を示し、-2.0以下の値は極端な売られすぎ状態を示します。インジケーターは2本のラインで構成されています:メインライン(Fisher Transform値)とシグナルライン(メインラインの平滑化バージョン)。これらのライ
FREE
特別オファー : ALL TOOLS 、各 $35 で提供中! New tools   will be   $30   for the   first week   or the   first 3 purchases !  Trading Tools Channel on MQL5 : Join my MQL5 channel to update the latest news from me Volume Zones Internal Visualizer Multi-Timeframe は、上位足チャートを見ながら下位足のボリューム動向を詳細に把握するための最適なソリューションです。マルチタイムフレーム機能をサポートし、強力かつ直感的にボリューム分析を行いたい方には最適です! MT4バージョンはこちら:  Volume Zones Internal Visualizer MT4 Multi TF その他の製品はこちら:   All P roducts Why Choose Volume Zones Internal Visualizer Multi-Timeframe? 上位足
This is a buyer and seller aggression indicator that analyzes the shape of each candle and project this data in a histogram form. There are 4 histograms in one. On the front we have two: Upper - Buyer force. Lower - Seller force. At the background we also have two histogram, both with same color. They measure the combined strenght of buyers and sellers. This histograms can be turned off in Input Parameters. It is also possible to have the real or tick volume to help on this force measurement. IN
FREE
Auto Midas VWAP
Paulo Henrique Faquineli Garcia
AUTO MIDAS VWAP Volume Weighted Average Price (VWAP) is a trading benchmark commonly used by Big Players that gives the average price a Symbol has traded throughout the day. It is based on both Volume and price. Commonly, MIDAS VWAP damand you to determine the initial point of analysis. This indicator plots automatically based on ZigZag Approach. You will be able to use up to 3 HIGH MIDAS VWAP's and 3 LOW MIDAS VWAP's. Wish the best trade results!!
概要 このインジケーターは、クラシックな ドンチャンチャネル を強化したバージョンで、実践的なトレード機能を追加しています。 標準の3本線(上限、下限、中央線)に加え、 ブレイクアウト を検出し、チャート上に矢印で視覚的に表示します。また、チャートを見やすくするために、 現在のトレンド方向と逆側のラインのみを表示 します。 インジケーターの機能: 視覚的シグナル :ブレイクアウト時にカラフルな矢印を表示 自動通知 :ポップアップ、プッシュ通知、Eメール RSIフィルター :市場の相対的な強弱に基づいてシグナルを検証 カスタマイズ可能 :色、ラインの太さ、矢印コード、RSI閾値など 動作原理 ドンチャンチャネルは次のように計算します: 上限線 :直近N本のクローズ済みローソク足の最高値 下限線 :直近N本のクローズ済みローソク足の最安値 中央線 :最高値と最安値の平均値 上方ブレイクアウト は終値が上限線を超えたときに発生し、 下方ブレイクアウト は終値が下限線を下回ったときに発生します。 インジケーターは以下を行います: 3本のドンチャンラインを描画 方向転換後の最初のブレイクアウト
FREE
Bands are a form of technical analysis that traders use to plot trend lines that are two standard deviations away from the simple moving average price of a security. The goal is to help a trader know when to enter or exit a position by identifying when an asset has been overbought or oversold. This indicator will show upper and lover bands. You can change input parameters nPeriod and  nMethod to calculate those bands for each timeframe. Aqua clouds represent up or down trends.
Free automatic Fibonacci is an indicator that automatically plots a Fibonacci retracement based on the number of bars you select on the BarsToScan setting in the indicator. The Fibonacci is automatically updated in real time as new highest and lowest values appears amongst the selected bars. You can select which level values to be displayed in the indicator settings. You can also select the color of the levels thus enabling the trader to be able to attach the indicator several times with differe
FREE
This is Gekko's Cutomized Cutomized Average Directional Index (ADX), a customized version of the famous ADX indicator. Use the regular ADX and take advantage two entry signals calculations and different ways of being alerted whenever there is potential entry or exit point. Inputs Period: Period for the ADX calculation; PlotSignalType: How will the indicator calculate entry (swing) signals: 1- ShowSwingsOnTrendLevel : Show Signals for Trend Confirmation Swings; 2- ShowSwingsOnTrendLevelDirection
Pivot Points Classic – L’indicatore essenziale per ogni trader tecnico Questo indicatore disegna automaticamente i livelli di Pivot Point più utilizzati dai trader professionisti, con supporto completo a 4 metodi di calcolo:   Metodi supportati : • Traditional • Fibonacci • Woodie • Camarilla   Caratteristiche principali :  Calcolo su timeframe superiore (multi-timeframe)  Visualizzazione chiara dei livelli P, R1, R2, R3, S1, S2, S3   Etichette dinamiche con nome e valore del livello  Colori per
FREE
Pivot Point Supertrend (corresponds to Pivot Point Super Trend indicator from Trading View) Pivot Point Period:    Pivot point defined as highest high and highest low... input 2 = defining highest high and highest low with 2 bars on each side which are lower (for highest high) and are higher (for lowest low calculation) ATR Length  : the  ATR  calculation is based on 10 periods ATR Factor: ATR multiplied by 3
FREE
このプロダクトを購入した人は以下も購入しています
SuperScalp Pro
Van Minh Nguyen
4.63 (24)
SuperScalp Pro – 高度なマルチフィルタースキャルピングインジケーターシステム SuperScalp Pro は、クラシックな Supertrend と複数のインテリジェント確認フィルターを組み合わせた高度なスキャルピングインジケーターです。M1 から H4 まで複数の時間足で効率的に動作し、XAUUSD、BTCUSD、主要 Forex 通貨ペア向けに最適化されています。 このインジケーターは明確な Buy / Sell シグナルを提供し、ATR に基づいてエントリー価格、Stop Loss、Take Profit を自動計算します。Fibonacci Take Profit 機能により、重要な価格帯で早期決済し、到達時に通知を送信します。 初期設定では Fibonacci Take Profit が有効化されており、より安定した取引体験を重視しています。チャートに適用するだけですぐ利用可能です。上級者向けに、すべてのパラメータは自由にカスタマイズできます。 EMA、RSI、ADX、Volume、VWAP、Bollinger Bands、MACD Divergence な
このインジケーターを購入された方には、以下の特典を 無料 で提供しています: 各トレードを自動で管理し、ストップロスとテイクプロフィットを設定し、戦略ルールに基づいてポジションを決済する補助ツール 「Bomber Utility」 様々な銘柄に合わせたインジケーターの設定ファイル(セットファイル) 「最小リスク」、「バランスリスク」、「待機戦略」 の3つのモードで使用できる Bomber Utility 用の設定ファイル このトレーディング戦略をすぐに導入・設定・開始できる ステップバイステップのビデオマニュアル ご注意: 上記の特典を受け取るには、MQL5のプライベートメッセージシステムを通じて販売者にご連絡ください。 オリジナルのカスタムインジケーター 「Divergence Bomber(ダイバージェンス・ボンバー)」 をご紹介します。これは、MACDのダイバージェンス(乖離)戦略に基づいた 「オールインワン」型のトレーディングシステム です。 このテクニカルインジケーターの主な目的は、価格とMACDインジケーターの間に発生するダイバージェンスを検出 し、将来の価格の動きを示す
Entry In The Zone and SMC Multi Timeframe is a real-time 2-in-1 market analysis tool that combines market structure analysis and a No Repaint BUY / SELL signal system into a single indicator, built on Smart Money Concepts (SMC) — a widely adopted framework used by professional traders to understand market structure. This indicator helps you see the market more clearly, make decisions based on structure rather than guesswork, and focus on high-probability zones where price is more likely to react
Power Candles V3 - 自己最適化型強弱インジケーター Power Candles V3は 、通貨や銘柄の強さを、適用されたすべてのチャート上で実行可能なトレードプランに変換します。単にローソク足を色分けするだけでなく、バックグラウンドでリアルタイムの自動最適化を実行し、目の前の銘柄に対して最適なストップロス、テイクプロフィット、およびシグナルの閾値を提示します。ワンクリックで実取引に適用でき、エントリーポイント、ストップロス、テイクプロフィットのラインが正確な価格位置にチャート上に表示され、方向性を示すアラートがリアルタイムで発動します。 このツールは、Stein Investmentsのエコシステムの一部です。  18種類以上のツールをすべて閲覧し、AIを活用したセットアップの推奨事項を入手し、  https://stein.investments でコミュニティに参加しましょう クローズしたバーごとに3,000回以上のトレードシミュレーション。9つの強さの状態。2つの戦略を並行してテスト。勝率の高い設定をワンクリックで適用。 なぜこれが必要なのか ほとんどの強
SignalTech MT5 is a fully rule based trading system for EURUSD, USDCHF, USDJPY, AUDUSD, NZDUSD, EURJPY, AUDJPY, NZDJPY, CADJPY.  All the winning trades with chart setups are published on the comments page. 2025-12 1174 Pips 2026-01 2624 Pips 2026-02 2937 Pips 2026-03 2165 Pips 2026-04 2243 Pips It can generate signals with Buy/Sell Arrows and Pop-Up/Sound Alerts. Each signal has clear Entry and Stop Loss levels, which should be automatically flagged on the chart, as well as potential Targets 1,
ご紹介     Quantum Breakout PRO は 、ブレイクアウト ゾーンの取引方法を変革する画期的な MQL5 インジケーターです。 13年以上の取引経験を持つ経験豊富なトレーダーのチームによって開発されました。     クォンタム ブレイクアウト プロ   は、革新的でダイナミックなブレイクアウト ゾーン戦略により、あなたのトレーディングの旅を新たな高みに押し上げるように設計されています。 クォンタム ブレイクアウト インジケーターは、5 つの利益ターゲット ゾーンを備えたブレイクアウト ゾーン上のシグナル矢印と、ブレイクアウト ボックスに基づいたストップロスの提案を提供します。 初心者トレーダーにもプロのトレーダーにも適しています。 量子EAチャネル:       ここをクリック 重要!購入後、インストールマニュアルを受け取るためにプライベートメッセージを送ってください。 推奨事項: 時間枠: M15 通貨ペア: GBPJPY、EURJPY、USDJPY、NZDUSD、XAUUSD アカウントの種類: ECN、Raw、またはスプレッドが非常に低い R
RelicusRoad Pro: 定量的市場オペレーティングシステム 【期間限定】無制限アクセス 70% OFF - 2,000人超のトレーダーと共に なぜ多くのトレーダーは「完璧な」インジケーターを使っても失敗するのでしょうか? それは、文脈を無視して 単一の概念 だけでトレードしているからです。文脈のないシグナルは単なるギャンブルです。勝ち続けるには、 根拠の重なり(コンフルエンス) が必要です。 RelicusRoad Proは単なる矢印インジケーターではありません。完全な 定量的市場エコシステム です。独自のボラティリティモデリングを用いて、価格が推移する「適正価値の道(Fair Value Road)」をマッピングし、ノイズと真の構造的ブレイクを判別します。 推測はやめましょう。機関投資家レベルの「ロード・ロジック」でトレードを。 コアエンジン:「Road」アルゴリズム システムの中心となる Road Algo は、市場環境にリアルタイムで適応するダイナミックなボラティリティチャネルです。 安全ライン(平衡点) と、価格が数学的に反転しやすい 拡張レベル を投影します。 Si
MetaTrader 5 向けスマート多層ブレイクアウト&プルバック検出器 「スマート・シンプル・ファスト!」 高確率のブレイクアウトエントリーを見逃すことにうんざりしていませんか? 複数のチャートを何時間もスキャンし、ブレイクアウトをトレンド方向と通貨のモメンタムに合わせようとして、それでも動きを逃してしまうことはありませんか? Break Pullback は、1つのインジケーターでそのすべてを解決します。 Break Pullback とは何ですか? Break Pullback は、マーケットストラクチャー、ブレイクアウト、トレンド継続のセットアップを取引するトレーダー向けに特別に設計されたプロフェッショナルグレードの MetaTrader 5 インジケーターです。 リアルタイムで複数の通貨ペアにわたるブレイクとプルバックの形成を自動的に検出し、3層の確認を通じてすべてのシグナルをフィルタリングします: ストラクチャラルブレイクアウト検出 — チャート上の主要なブレイクレベルを特定 HTF 日足バイアス — エントリーを支配的な日足トレンド方向に合わせる 通貨強弱指数 —
このインジケーターを購入すると、プロ仕様のトレードマネージャーを無料で差し上げます。 まず第一に、このトレーディングシステムがノンリペイント、ノンリドロー、ノンラグのインジケーターであることを強調する価値がある。これにより、手動取引とロボット取引の両方に理想的なものになっています。 オンラインコース、マニュアル、プリセットのダウンロード。 「スマートトレンドトレーディングシステム MT5」は、新規および経験豊富なトレーダー向けにカスタマイズされた包括的なトレーディングソリューションです。10以上のプレミアムインジケーターを組み合わせ、7つ以上の堅実なトレーディング戦略を備えており、多様な市場状況に対応する多目的な選択肢となっています。 トレンドフォロー戦略:トレンドを効果的に乗り越えるための正確なエントリーとストップロス管理を提供します。 リバーサル戦略:潜在的なトレンドの反転を特定し、トレーダーがレンジ相場を活用できるようにします。 スキャルピング戦略:高速で正確なデイトレードおよび短期取引のために設計されています。 安定性:すべてのインジケーターはノンリペイント、ノンリドロー、ノ
Azimuth Pro
Ottaviano De Cicco
5 (7)
Azimuth Pro V2:MT5向けシンセティック・フラクタル構造分析と確認済みエントリー 概要 Azimuth Pro は Merkava Labs によるマルチレベルスイング構造インジケーターです。4つのネストされたスイングレイヤー、スイングアンカーVWAP、ABCパターン検出、3タイムフレーム構造フィルタリング、そして確定バーでの確認済みエントリー — 1つのチャートで、ミクロスイングからマクロサイクルまでを網羅するワークフロー。 これはブラインドシグナル製品ではありません。ロケーション、コンテキスト、タイミングを重視するトレーダーのための構造ファーストワークフローです。 V2発売記念オファー — Azimuth Pro V2をUSD 399で(次の100本)。最終価格:USD 499。 1. V2での変更点 シンセティック・マルチタイムフレームエンジン 上位タイムフレーム分析をMeridian Proと同じ独自のシンセティックアーキテクチャで一から再構築。よりクリーンなHTFコンテキスト、安定したライブ動作、従来のMTF同期問題なし。シンセティックエンジンは 固定比率タ
FX Trend NG:次世代マルチマーケット・トレンドインテリジェンス 概要 FX Trend NG は、複数の時間足に対応したプロフェッショナル向けトレンド分析およびマーケット監視ツールです。 市場全体の構造を数秒で把握することができます。 複数のチャートを切り替える必要はありません。どの銘柄がトレンド中なのか、どこでモメンタムが弱まっているのか、そしてどの時間足で強い整合性があるのかを瞬時に確認できます。 ローンチ特別オファー – FX Trend NG を $30(6ヶ月) または $80 永久ライセンス でご利用いただけます。 すでに Stein Investments のユーザーですか? -> メッセージを送信 して、プライベートグループへアクセスしてください。 セットアップや詳細情報が必要ですか? -> Stein Investments 公式ページ をご覧ください。 1. FX Trend NG が他と異なる理由 3ステート・トレンドロジック ― Buy と Sell だけではない • 多くのインジケーターは Buy または Sell の2状態のみを表示します。
Quantum TrendPulse を ご紹介します。これは、   SuperTrend   、   RSI   、および Stochastic のパワーを 1 つの包括的なインジケーターに組み合わせて、取引の可能性を最大限に引き出す究極の取引ツールです。精度と効率を求めるトレーダー向けに設計されたこのインジケーターは、市場のトレンド、勢いの変化、最適なエントリー ポイントとエグジット ポイントを自信を持って特定するのに役立ちます。 主な特徴: SuperTrend 統合: 現在の市場動向に簡単に追従し、収益性の波に乗ることができます。 RSI精度: 買われすぎと売られすぎのレベルを検出し、市場の反転のタイミングに最適で、SuperTrendのフィルターとして使用されます。 確率的精度: 確率的振動を活用して、変動の激しい市場で隠れたチャンスを見つけます。SuperTrend のフィルターとして使用されます。 マルチタイムフレーム分析:   M5 から H1 または H4 まで、さまざまなタイムフレームで市場を常に把握します。 カスタマイズ可能なアラート: カスタム取引条件が満たされ
まず第一に、この取引インジケーターは再描画されず、再描画されず、遅延しないことを強調する価値があります。これにより、手動取引とロボット取引の両方に理想的なものになります。 ユーザーマニュアル:設定、入力、戦略。 アトミックアナリストは、価格の強さとモメンタムを利用して市場でより良いエッジを見つけるためのPA価格アクションインジケーターです。ノイズや誤ったシグナルを除去し、取引ポテンシャルを高めるための高度なフィルターを備えています。複雑なインジケーターの複数のレイヤーを使用して、アトミックアナリストはチャートをスキャンし、複雑な数学的計算をシンプルなシグナルと色に変換します。これにより、どのような初心者トレーダーでも理解して使用し、一貫した取引の決定を行うことができます。 「アトミックアナリスト」は、新規および経験豊富なトレーダー向けにカスタマイズされた包括的な取引ソリューションです。プレミアムインジケーターとトップノッチの機能を1つの取引戦略に組み合わせ、すべてのタイプのトレーダーにとって汎用性のある選択肢にします。 デイリートレーディングとスキャルピング戦略:高速で正確なデイ
まず第一に、この取引ツールはノンリペイント、ノンリドロー、ノンラグの指標であり、プロの取引に理想的ですことを強調する価値があります。 オンラインコース、ユーザーマニュアル、デモ。 スマートプライスアクションコンセプトインジケーターは、新米から経験豊富なトレーダーまで、非常 に強力なツールです。Inner Circle Trader AnalysisやSmart Money Concepts Trading Strategiesなど、20以上の有用な指標を1つに組み合わせています。このインジケーターはスマートマネーコンセプトに焦点を当て、大手機関の取引方法を提供し、彼らの動きを予測するのに役立ちます。 特に、流動性分析に優れており、機関がどのように取引しているかを理解しやすくしています。市場のトレンドを予測し、価格の動きを慎重に分析するのに優れています。機関の戦略とトレードを合わせることで、市場の動向についてより正確な予測ができます。このインジケーターは多目的であり、市場構造を分析し、重要な注文ブロックを特定し、さまざまなパターンを認識するのに優れています。 このインジケーター
BTMM State Engine Pro is a MetaTrader 5 indicator for traders who use the Beat The Market Maker approach: Asian session context, kill zone timing, level progression, peak formation detection, and a multi-pair scanner from a single chart. It combines cycle state logic with a built-in scanner dashboard so you do not need the same tool on many charts at once. What it does Draws the Asian session range; session times can follow broker server offset or be set in inputs. Tracks level progression (L
多くの矢印インジケーターは、シグナルだけを表示して、その後の判断をすべてトレーダーに任せてしまいます。KT Alpha Hunter Arrows は、完整なトレードプランをチャート上に提示します。 各シグナル矢印が表示されるたびに、エントリーライン、ストップロス、4つのテイクプロフィット水準、そして現在の銘柄と時間足が今トレードに値するかどうかを示すリアルタイムのエッジ判定が、すでに描画された状態で表示されます。付属の Trade Manager EA は、あなたが手動でエントリーした後の実行管理を担当し、相場が荒れて判断がぶれやすい場面でも規律あるトレードを保ちやすくします。リペイントなし。確定足シグナルのみ。Forex、ゴールド、指数、その他あなたが取引するあらゆる銘柄に対応します。 主な機能 リペイントしない買い矢印と売り矢印を、足の確定後にのみ表示。 各シグナルに、エントリーライン、構造的ストップロス、4つのテイクプロフィット水準を表示。 Edge Dashboard が、現在のチャートで買いセットアップと売りセットアップを別々に評価。 判定システム:No Edge、Mar
優れたテクニカルインジケーター「Grabber」をご紹介します。これは、すぐに使える「オールインワン」トレーディング戦略として機能します。 ひとつのコードに、市場のテクニカル分析ツール、取引シグナル(矢印)、アラート機能、プッシュ通知が強力に統合されています。 このインジケーターを購入された方には、以下の特典を無料で提供します: Grabberユーティリティ:オープンポジションを自動で管理するツール ステップバイステップのビデオマニュアル:インジケーターのインストール、設定、取引方法を解説 カスタムセットファイル:インジケーターをすばやく自動設定し、最大限の成果を出すための設定ファイル 他の戦略はもう忘れてください!Grabberだけが、あなたを新たなトレードの高みへと導いてくれるのです。 Grabber戦略の主な特徴: 推奨タイムフレーム:M5〜H4 対応通貨ペア・資産:どれでも使用可能ですが、私が実際に検証した以下を推奨します(GBPUSD、GBPCAD、GBPCHF、AUDCAD、AUDUSD、AUDSGD、AUDCHF、NZDUSD、NZDCAD、EURCAD、EURUSD、E
これはMT5のインジケーターで、再描画なしで取引に参入するための正確なシグナルを提供します。 外国為替、暗号通貨、金属、株式、インデックスなど、あらゆる金融資産に適用できます。かなり正確な見積もりを提供し、取引を開始して終了するのに最適な時期を教えてくれます。1つのシグナルを処理しただけでインジケーターの元が取れた例の 動画 (6:22)をご覧ください。Entry PointsPro インジケーターの助けを借りたほとんどのトレーダーの最初の1週間の結果が改善しています。 Telegramグループ に登録してください。Entry Points Proインジケーターのメリットは次の通りです。 再描画のないエントリーシグナル 再描画されるインジケーターでは一度表示されたシグナルが削除されて大きな金銭的損失につながることがありますが、これと異なり、表示されて確認されたシグナルは消えることがありません。 エラーなしの取引開始 インジケーターアルゴリズムによって取引を開始する(資産を売買する)理想的な瞬間を見つけることができます。それを使用するすべてのトレーダーの成功率が向上します。 あら
Meridian Pro
Ottaviano De Cicco
5 (2)
Meridian Pro 2.00:MT5向けプロ仕様マルチタイムフレーム・トレンドマトリクス Meridian Pro 2.00 は、MetaTrader 5 向けのプロ仕様の適応型トレンドマトリクスです。オリジナルの Meridian トレンドエンジン、クリーンなチャート ribbon、確定足ベースのシグナル矢印、8時間足 dashboard、Fuel momentum、weighted consensus、synthetic HTF processing、そしてチャート上に直接表示される上位足コンテキストラインを統合します。 目的はシンプルです。現在のトレンド、マルチタイムフレーム構造、強度、momentum、EA-ready 状態を、複数チャートに無関係なインジケータを重ねるのではなく、1つの整理された workflow で読むことです。 Meridian Pro の違い 1つの適応型エンジン - 同じ volatility-aware Meridian ロジックを M1 から W1 まで適用します。 Synthetic HTF architecture - 上位足行は下位足デ
このダッシュボードは、選択されたシンボルの最新の利用可能なハーモニックパターンを表示するので、時間を節約し、より効率的に /   MT4バージョン 。 無料インジケーター:   Basic Harmonic Pattern インジケーター列 Symbol : 選択したシンボルが表示されます。 Trend :   強気または弱気 Pattern : パターンの種類(ガートレー、バタフライ、バット、カニ、サメ、サイファー、ABCD) Entry : エントリー価格 SL: ストップロス価格 TP1: 1回目の利食い価格 TP2: 2回目の利食い価格 TP3:   3回目の利食い価格 Current price :   現在値 Age (in bars):    最後に描画されたパターンの年齢 主な入力項目 Symbols:   "28 Major Currency Pairs "または "Selected Symbols "から選択。 Selected Symbols:   カンマで区切られた監視したいシンボル("EURUSD,GBPUSD,XAUUSD")。ブローカーがペアに接
FX Power: 通貨の強弱を分析して、より賢い取引を実現 概要 FX Power は主要通貨と金の実際の強弱をあらゆる市場状況で理解するための必須ツールです。強い通貨を買い、弱い通貨を売ることで、 FX Power は取引の意思決定を簡素化し、高い確率の取引機会を見出します。トレンドを追従する場合でも、極端なデルタ値を使用して反転を予測する場合でも、このツールはあなたの取引スタイルに完全に適応します。ただ取引するだけではなく、 FX Power で賢く取引をしましょう。 1. なぜ FX Power がトレーダーにとって非常に有益なのか 通貨と金のリアルタイム強弱分析 • FX Power は主要通貨と金の相対的な強弱を計算し、マーケットダイナミクスに関する明確な洞察を提供します。 • どの資産がリードしているか、または後れを取っているかを監視して、取引するペアを賢く選びましょう。 マルチタイムフレームの包括的なビュー • 短期、中期、長期のタイムフレームで通貨と金の強弱を追跡し、マーケットトレンドに基づいて取引戦略を調整できます。 • スキャルピングからスイングトレード
OrderFlux | MetaTrader 5 用フットプリント・オーダーフロー バージョン 2.0 – アクティブトレーダー向けのリアルタイム Bid/Ask 可視化 OrderFlux は MT5 用のフットプリントおよびオーダーフローインジケーターです。価格がどこに動いたかだけでなく、その動きの中で何が起きているか(各価格レベルの Bid/Ask ボリューム、デルタ、インバランス、ボリューム分布)を表示します。 多くのチャートはローソク足の最終結果しか表示しません。OrderFlux はそこに至るまでの過程を表示します。ローソク足の形状だけでなく、市場参加者の動向を読み取りたい場合にまさに役立ちます。 ライブチャートにおいて、OrderFlux は主に次の3つの質問に答えます: 現在、どこで積極的な買いまたは売りの圧力が市場に参入しているか? どの価格レベルでボリュームが吸収、または拒否されているか? 現在の動きはセッションのコンテキスト(背景)にどう適合しているか? インターフェースで得られるもの メインチャートは、Canvas ベースでフットプリントを直接レンダリングします
OmniSync Projection
Antonio-alin Teculescu
5 (1)
Chronos Fractal Engine is an innovative price projection indicator for MetaTrader 5, designed to transform your technical analysis by intelligently identifying and projecting historical price patterns. Built upon an advanced correlation algorithm and the fractal principles of the market, this powerful tool visualizes potential future price movements, giving you a unique edge in your trading decisions. What is Chronos Fractal Engine? At its core, the Chronos Fractal Engine employs a sophisticat
トレンドラインプロ   市場の真の方向転換点を理解するのに役立ちます。この指標は、真のトレンド反転と主要プレーヤーが再び参入するポイントを示します。 分かりますか     BOSライン   複雑な設定や不要なノイズなしに、より長い時間足でのトレンドの変化と重要なレベルを把握できます。シグナルは再描画されず、バーが閉じた後もチャート上に残ります。 MT4バージョン   -   RFI LEVELS PRO インジケーター と組み合わせることで、その最大限の能力を発揮します インジケーターが示す内容: 本当の変化   トレンド(BOSライン) 一度シグナルが現れたら、それは有効です!これは、リペイント機能を持つインジケーターとの重要な違いです。リペイント機能を持つインジケーターは、シグナルを発した後、それを変更し、資金の損失につながる可能性があります。これにより、より高い確率と精度で市場に参入できます。また、矢印が現れた後、目標値(利益確定)に達するか、反転シグナルが現れるまで、ローソク足の色を変更する機能もあります。 繰り返しエントリ   主要プレーヤーの補充 エントリーポイントを探す
The Zone Trading Indicator is a technical analysis tool for MetaTrader 5 that automatically identifies and displays tradable price zones across multiple timeframes to assist with structured market analysis. The indicator plots Monthly, Weekly, Daily, and H4 tradable zones , allowing traders to view higher- and lower-timeframe price areas simultaneously. These zones are designed to support one-candle–based entry approaches by highlighting predefined areas where price interaction may be monitored.
このインジケーターは、反転ポイントと価格戻りゾーンを正確に表示します。     主要プレーヤー 。新たなトレンドが形成される場所を把握し、最大限の精度で意思決定を行い、すべての取引をコントロールします。 TREND LINES PRO インジケーターと組み合わせることで、その潜在能力を最大限に発揮します。 VERSION MT4 インジケーターが示す内容: 新しいトレンドの始まりに活性化する反転構造と反転レベル。 リスクと報酬の比率を最小限に抑えた利益 確定 と 損失停止の レベルの表示     RR 1:2   。 インテリジェントな削減ロジックによるストップロス。 指定されたインジケーターから 2 つのトレンド タイプの反転パターンを表示します。 指標: トレンドを追う   TREND LINES PRO   (世界的なトレンドの変化) TREND PRO   (クイックトレンド変更) シンプルで効果的   スキャナー   リアルタイムトレンド(新機能)。 マルチタイムフレームのインストゥルメント フィルタリング。 画面   利益     LOGIC AI信号の後。 当日プラス方
このインディケータは、価格アクション分析とドンチャンチャネルのみを使用して、ジグザグ方式で価格の反転を検出します。再描画やバックペインティングを一切行わずに、短期取引向けに特別に設計されています。それは彼らの操作のタイミングを増やすことを目指している賢明なトレーダーにとって素晴らしいツールです。 [ インストールガイド | 更新ガイド | トラブルシューティング | よくある質問 | すべての製品 ] 驚くほど簡単に取引できます すべての時間枠で価値を提供します 自己分析統計を実装します 電子メール/音声/視覚アラートを実装します 可変長のブレイクアウトと混雑ゾーンに基づいて、インディケータは価格アクションのみを使用して取引を選択し、市場が非常に高速に行っていることに反応します。 過去のシグナルの潜在的な利益が表示されます この指標は、独自の品質とパフォーマンスを分析します 負けブレイクアウトは強調表示され、説明されます インジケータは、非バックペインティングおよび非再ペイントです この指標は、日中のトレーダーが単一の価格反転を見逃さないようにするのに役立ちます。ただし、すべての
Super Signal Market Slayer 非リペイント|高精度|マルチマーケット対応インテリジェントトレンド指標 トレードにおいて本当に難しいのは、 注文することではなく、相場のノイズの中で「トレンドが始まった瞬間」を見極めることです。 Market Slayer はそのために開発されました。 本インジケーターは、日中取引向けに設計された非リペイント型のインテリジェント指標です。 多層確認とトレンドフィルターにより、重要な局面でのみ明確かつ信頼性の高い Buy / Sell シグナルを表示します。 主な特長 非リペイントシグナル 一度表示されたシグナルは固定され、消えたり移動したりしません。 高精度なトレンド判定 複数銘柄で検証され、特にゴールド M5 / M15 で安定した結果を示します。 マルチマーケット対応 ゴールド、FX、指数、主要暗号資産に対応。 日中取引向け最適化 M5・M15 に特化し、ノイズを抑え実行性を向上。 直感的で分かりやすい 初心者でも理解しやすく、すぐに使用可能。 技術ロジック概要 Market Slayer は単一条件の矢印ではありません。 以
Trend Forecaster – Since 2023. The Trend Forecaster indicator utilizes a unique proprietary algorithm to determine entry points for a breakout trading strategy. The indicator identifies price clusters, analyzes price movement near levels, and provides a signal when the price breaks through a level. The Trend Forecaster indicator is suitable for all financial assets, including currencies (Forex), metals, stocks, indices, and cryptocurrencies. You can also adjust the indicator to work on any time
FX Volume MT5
Daniel Stein
4.79 (24)
FX Volume:ブローカー視点で捉える本物の市場センチメント クイック概要 トレード手法をさらに高めたいとお考えですか? FX Volume は、リテールトレーダーやブローカーのポジション状況をリアルタイムで提供します。これは、COTのような遅延レポートよりもはるかに早く知ることができます。安定した利益を目指す方も、さらなる優位性を求める方も、 FX Volume は大きな不均衡を見極め、ブレイクアウトを確認し、リスク管理を洗練させるのに役立ちます。今すぐ始めて、実際の出来高データがどのように意思決定を変革するかを体感してください! 1. FX Volume がトレーダーにとって非常に有益な理由 高精度の早期警戒シグナル • 各通貨ペアを売買しているトレーダー数を、他者よりも早く、ほぼリアルタイムで把握できます。 • FX Volume は、複数のリテールブローカーから得られる本物の出来高データを収集し、分かりやすい形式で提供する 唯一 のツールです。 強力なリスク管理 • ロングやショートの大きな偏り(インバランス)を特定し、潜在的なトレンド転換を見逃しません。ストップ
作者のその他のプロダクト
TRI-DCA Smart Compounding Gold EA Adaptive DCA and Hedge Trading System for XAUUSD with Dynamic Volatility Management Overview TRI-DCA Smart Compounding Gold EA is an automated trading system developed for XAUUSD on the M5 timeframe. The EA combines: ATR-based DCA spacing Dynamic hedge recovery Equity-based compounding Basket profit management Multi-layer risk control The system is designed to manage volatile market environments through structured position management and adaptive trade spacing.
Smart Stochastic Divergence Detector Stochastic Divergence Detection Indicator for MetaTrader 5 Overview Smart Stochastic Divergence Detector is a technical analysis indicator designed to identify bullish and bearish divergence conditions between price action and the Stochastic oscillator. The indicator supports: Regular divergence detection Hidden divergence detection Trendline visualization Signal marking Configurable alerts Multi-timeframe operation It is intended for traders using momentum-b
SRline Automatic Support and Resistance Zone Indicator Based on Fractal Structure Overview SRline is a technical analysis indicator designed to identify and display support and resistance zones using fractal-based price structure detection. The indicator automatically scans historical price data and marks significant fractal highs and lows directly on the chart. It can be used for: Market structure analysis Support and resistance observation Breakout monitoring Reversal analysis Price action wo
Smart Trend Forecasting Slope-Based Trend Analysis Indicator with Alert Support Overview Smart Trend Forecasting is a slope-based trend analysis indicator derived from a classic moving average trend model originally developed by Wizard Serg and referenced in Forex Magazine #104. The indicator is designed to monitor: Trend direction Momentum shifts Trend transition conditions Moving average slope behavior It includes visual markers and configurable alert notifications for trend state changes. Ma
BuySell FibPiv Fibonacci Pivot Level Indicator with Dynamic Support and Resistance Zones Overview BuySell FibPiv is a Fibonacci pivot-based technical analysis indicator designed to calculate dynamic support and resistance levels using previous session price data. The indicator applies Fibonacci expansion and retracement calculations to generate multiple pivot-based levels for intraday and swing trading analysis. It provides: Central pivot calculation Fibonacci-based support and resistance zones
Smart TMA Bands MTF Triangular Moving Average Channel Indicator with ATR Bands and Multi-Timeframe Support Overview Smart TMA Bands MTF is a technical analysis indicator based on Triangular Moving Average (TMA) calculations combined with ATR-based channel bands. The indicator is designed to visualize: Trend direction Volatility expansion Price positioning relative to dynamic bands Multi-timeframe market structure The system supports configurable timeframe analysis and customizable band calculat
Color Stochastic Enhanced Stochastic Oscillator with Cross Detection and Visual Signal Support Overview Color Stochastic is a customized version of the classic Stochastic Oscillator designed for momentum analysis and crossover visualization. The indicator provides color-based signal marking and configurable crossover detection at user-defined overbought and oversold levels. It can be used as part of: Momentum analysis Mean reversion workflows DCA-based strategies Multi-indicator confirmation sys
StochDiver PRO Stochastic Divergence Detection Indicator for MetaTrader 5 Overview StochDiver PRO is a technical analysis indicator designed to detect regular and hidden divergences between price action and the Stochastic oscillator. The indicator supports divergence visualization through trendline drawing on both the price chart and the oscillator window. It can be used as part of: Reversal analysis Momentum analysis DCA strategies Swing trading workflows Multi-timeframe confirmation Main Feat
FibPiv Zones Fibonacci Pivot Zone Indicator for MetaTrader Short Description FibPiv Zones is a technical analysis indicator combining Fibonacci-based levels and pivot point calculations to display support and resistance zones directly on the chart. Overview FibPiv Zones is a chart analysis indicator designed to visualize market structure using Fibonacci calculations and pivot point levels. The indicator automatically generates: Fibonacci-based support zones Fibonacci-based resistance zones Pivot
Quantum Stochastic Stochastic Oscillator Indicator with Dual Calculation and Signal Visualization Short Description Quantum Stochastic is a stochastic-based technical analysis indicator featuring dual stochastic calculations, configurable overbought/oversold zones, and crossover signal visualization for MetaTrader 5. Overview Quantum Stochastic is an oscillator indicator designed to analyze momentum conditions using stochastic calculations and crossover-based signal detection. The indicator com
Ultimate Trend Signal Moving Average Trend Analysis Indicator with Visual Signal and Alert Support Short Description Trend Signal MA20 is a moving average-based trend analysis indicator designed to display directional trend signals and alert notifications using configurable moving average calculations. Overview Trend Signal MA20 is a technical analysis indicator based on moving average slope evaluation and directional trend monitoring. The indicator displays trend direction markers directly on t
DCA Hedge Bot Automated DCA and Hedge Trading System with ATR-Based Spacing and Equity Management Overview DCA Hedge Bot is an automated trading system designed for structured position management using DCA execution, hedge recovery logic, dynamic spacing, and configurable equity scaling. The EA combines: ATR-based order spacing Hedge recovery management Configurable compounding Trailing profit management Drawdown protection Basket-based trade handling The system is designed to adapt to changing
Fractal Support & Resistance Automatic Support and Resistance Indicator Based on Fractal Structure Short Description Fractal Support & Resistance is a technical analysis indicator that automatically identifies and displays support and resistance levels using fractal-based price structure detection. Overview Fractal Support & Resistance is an indicator designed to detect support and resistance zones using configurable fractal logic. The indicator automatically scans historical price structure an
EMA Cross RSI TurboTrader Automated EMA and RSI Trading System with Trend Filtering and Risk Management Short Description EMA Cross RSI TurboTrader is an automated MetaTrader 5 trading system combining EMA crossover analysis, RSI filtering, trailing stop management, and market-safe order handling for structured trend-following execution. Overview EMA Cross RSI TurboTrader is an automated trading system designed for trend-following and momentum-based execution across multiple market conditions. T
Golden Hedge MA Turbo Automated Hedge Trading System with Double MA Filtering and Dynamic Position Management Overview Golden Hedge MA Turbo is an automated trading system designed for trend-filtered hedge execution and structured recovery management. The EA combines: Double moving average trend filtering Dynamic hedge management Configurable martingale scaling Spread-aware order handling Basket profit synchronization Broker-safe execution validation The system is designed to adapt to changing m
QUANTUM DCA HEDGE PRO Professional Multi-Layer DCA and Hedge Trading System with Trend Filtering and Equity Protection Overview Quantum DCA Hedge Pro is an advanced automated trading framework designed for stable long-term portfolio growth with controlled risk exposure. The system combines trend verification, adaptive DCA execution, controlled hedge management, equity protection, and intelligent compounding into a single integrated architecture. Unlike aggressive martingale systems, Quantum DCA
Market Dominator EA Advanced Support/Resistance Trading System with Adaptive Hedge and Recovery Management Overview Market Dominator EA is an automated trading system designed to operate in both trending and ranging market environments using structured market analysis and controlled recovery logic. The EA combines: Support and resistance analysis Adaptive market condition detection Structured DCA management Controlled hedge execution Basket take-profit synchronization The system focuses on main
フィルタ:
レビューなし
レビューに返信