PAX Benefit Predictor
- インディケータ
- バージョン: 1.1
- アクティベーション: 20

Индикатор "Benefit Predictor"
Это высокоточный инструмент для прогнозирования разворота цены на любом финансовом инструменте и любом таймфрейме.
Этот продукт появился благодаря годам опыта и исследований в области анализа цен и других временных рядов, используя продвинутые методы машинного обучения и математического анализа.
Особенности продукта:
- Готовая торговая система, подходит как для ручной торговли, так и для использования в торговых роботах.
- Не перерисовывается после появления сигнала.
- Удобен для работы на любом таймфрейме и любым символом (валюты, криптовалюты, нефть, металлы, акции).
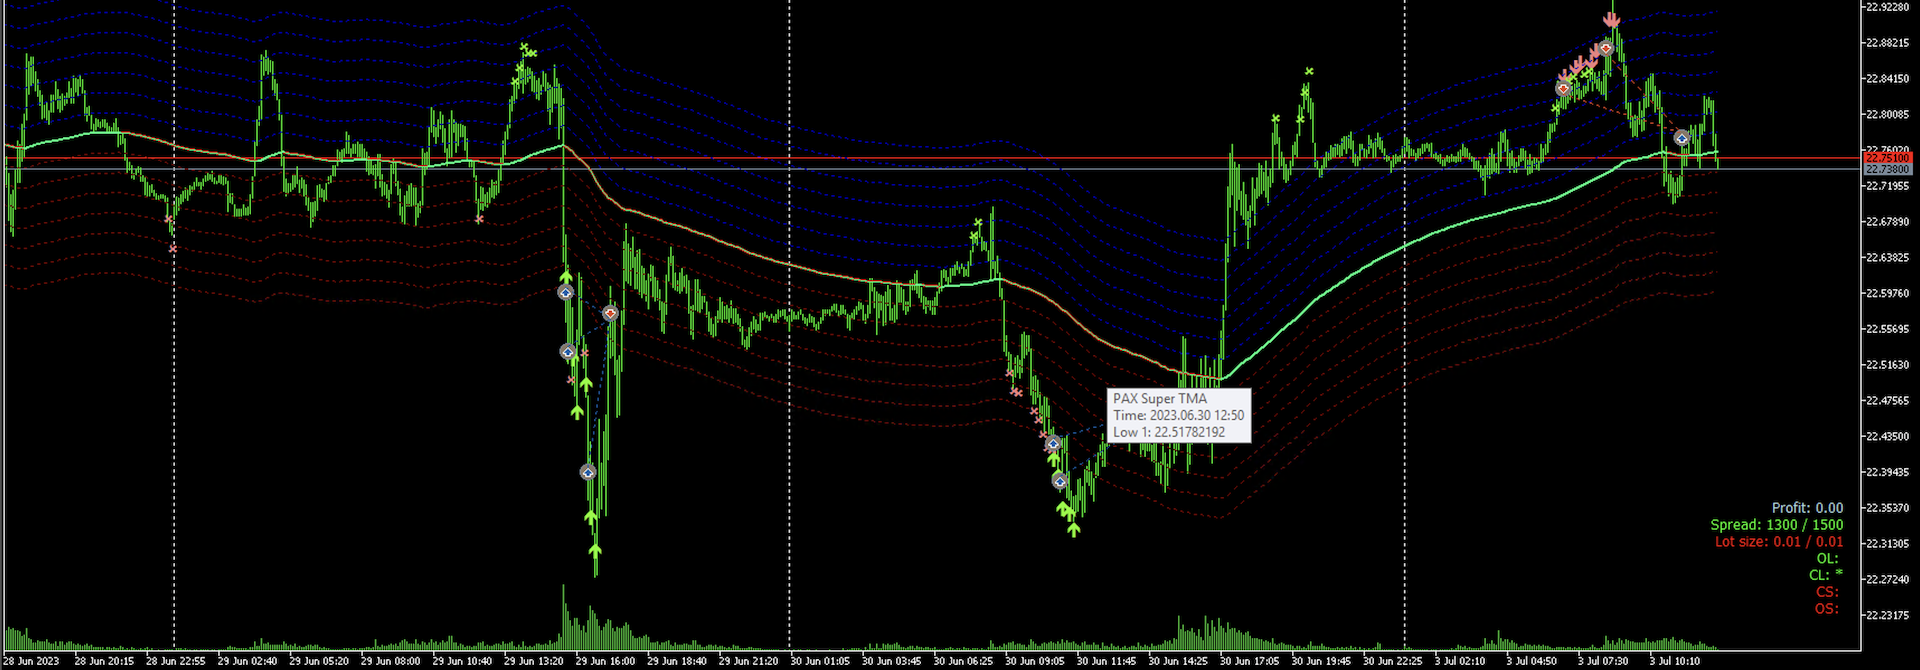
- Индикатор показывает канал, вдоль которого движется цена, и рисует параллельные линии (латерали), показывающие шаг цены для новых ордеров.
- При появлении сигнала на покупку отображается зеленая стрелка вверх, на продажу - красная стрелка вниз. Крестик "х" демонстрирует слабый сигнал о развороте тренда, указывая на возможное изменение цены.
Торговые стратегии:
Название товара: Индикатор "Benefit Predictor"
Описание товара:
Индикатор "Benefit Predictor" - это высокоточный инструмент для прогнозирования разворота цены на любом финансовом инструменте и любом таймфрейме. Он базируется на годы опыта и исследований в области анализа цен и других временных рядов, используя продвинутые методы машинного обучения и математического анализа.
Особенности продукта:
- Готовая торговая система, подходит как для ручной торговли, так и для использования в торговых роботах.
- Не перерисовывается после появления сигнала.
- Удобен для работы на любом таймфрейме и любым символом (валюты, криптовалюты, нефть, металлы, акции).
- Индикатор показывает канал, вдоль которого движется цена, и рисует параллельные линии (латерали), показывающие шаг цены для новых ордеров.
- При появлении сигнала на покупку отображается зеленая стрелка вверх, на продажу - красная стрелка вниз. Крестик "х" демонстрирует слабый сигнал о развороте тренда, указывая на возможное изменение цены.
Торговые стратегии:
-
Сетка ордеров: Откройте покупку на каждой зеленой стрелке, или продажу на каждой красной стрелке. Закрывайте сделки на обратном сигнале стрелки или крестика. Шаг между ордерами не должен быть не менее одной латерали (расстояние между линиями канала).
-
Тэйк профит: Если цена продолжила движение против сигнала и вашего ордера, продолжайте открывать новые ордеры в сетке ордеров на каждом сигнале. При этом для каждого ордера установите тейкпрофит на уровне первого сигнала (выше или ниже него, на ваше усмотрение, на одну латераль). Вскоре вся сетка ордеров закроется в плюс.
-
Работа одним ордером: Откройте ордер на третьем или четвертом сильном сигнале (стрелке). Закройте этот ордер в плюс на обратном сигнале.
С индикатором "Benefit Predictor" вы можете улучшить свою торговую стратегию и увеличить свой потенциальный доход на финансовых рынках. Повышайте свои возможности в торговле с помощью нашего передового инструмента анализа рынка!