Tipu RSI
- インディケータ
- バージョン: 2.40
- アップデート済み: 19 6月 2018

Tipu RSI Features
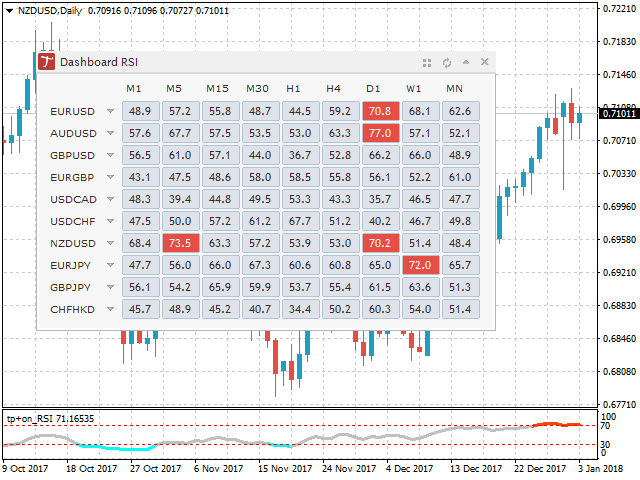
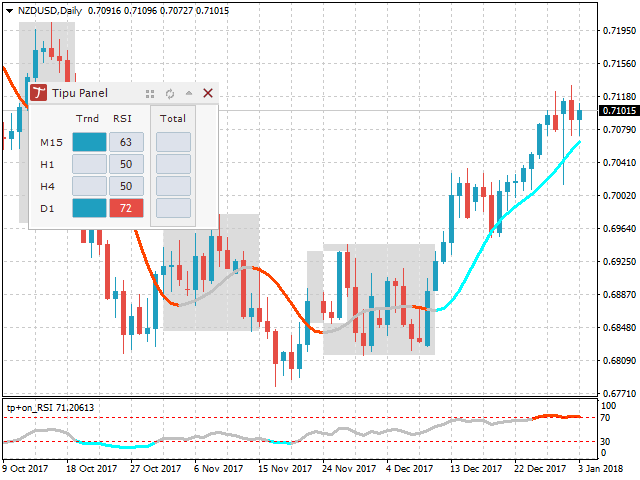
- 28 symbols, multi-time frame powerful Dashboard for the full market view
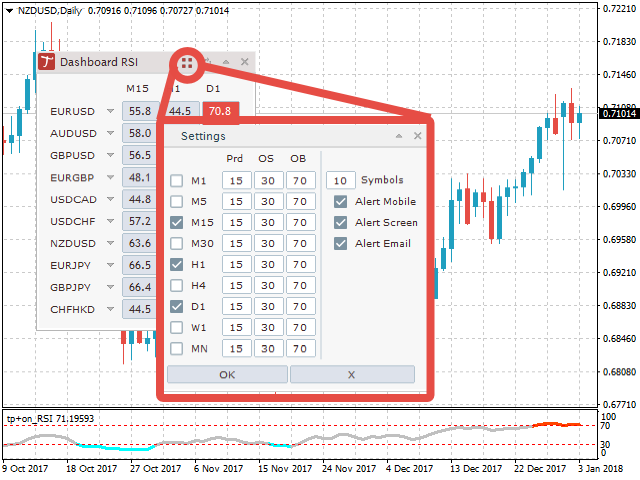
- Customizable Buy/Sell alerts, push alerts, email alerts, and visual on-screen alerts.
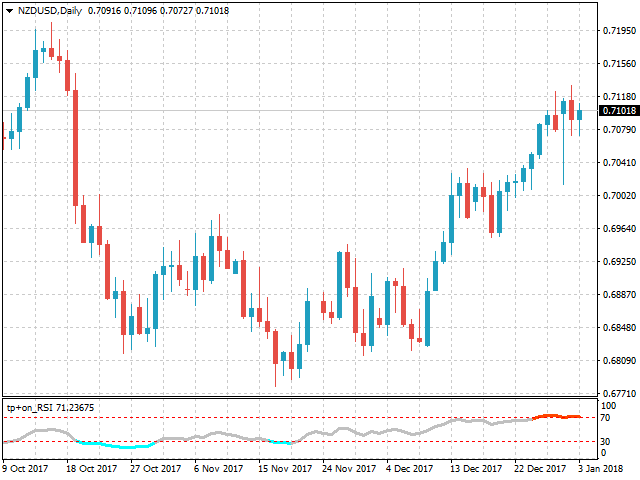
- Marked overbought and oversold levels.
- Three colors RSI that marks the normal, oversold and overbought levels.
The relative strength index (RSI) is an oscillator devised by J. Welles Wilder in his famous book New Concepts in Technical Trading Systems in 1978.1 He also introduced Parabolic SAR (see Tipu Parabollic SAR Panel), Average True Range and the Directional Movement Concept (ADX).
About Tipu Panel Series
Tipu Panel series is set of indicators created to consolidate indicators in form of a panel. As a trader, indicators can easily create a cluster on the chart and distract you from the bigger picture. It can also be overwhelming and visually exhausting. Tipu Panel simplifies this by displaying each indicator in a beautifully boxed panel. You can customize the panel to display indicator signals for multiple time frames and also to quickly switch time frames. There are two types of indicators that make up the Tipu Panel series, the master indicator, and the add-in indicators. The master indicator (Tipu Panel indicator) plots a beautifully designed panel, and the add-in indicators feed the data to this master indicator panel. These two types of indicators work together for a faster, and efficient performance on the chart.
How to Use Tipu RSI
- Uptrend/Downtrends - RSI may be used to detect trending markets. For example, the RSI may stay above the mid line 50 in an uptrend (or between 40 and 80).2 You may use RSI as a compliment to the Tipu Trend indicator.
- Top and Buttoms - RSI may help in identifying the tops around the overbought readings (usually above 70), and the bottoms around the oversold area (usually below 30).
- Divergence - divergence occurs when RSI directional movement is not confirmed by the price action. For example, a bullish divergence occurs when EURUSD makes lower low but RSI makes higher low. This means that EURUSD is losing momentum and a bullish correction is possible.
- Other uses - Failure Swing, Support and Resistance levels, Chart Formation
- Full description of RSI is available here.
Calculation
- U — average number of positive price changes.
- D — average number of negative price changes.
Parameters
- Section#1 - RSI Settings
- RSI Period - settings for RSI.
- Applied Price - settings for RSI.
- Overbought - settings for RSI.
- Oversold - settings for RSI.
- Mark Buy/Sell Signals - choose Arrow or Vertical Lines or nothing.
- Arrow offset (pips) - (works only if mark the buy/sell signals = Arrow) select value to offset Arrows from high (if sell), and low (if buy). Increasing Arrow Offset (pips) move arrows away from the high/lows.
- Buy/Sell Colors - Colors for the marks.
- Section#2 - Dashboard Settings
- Enable Dashboard? - select true/false.
- Colors Settings, Sell Trend Background Color, Sell Font Color, Buy Trend Background Color, Buy Font Color.
- Section#3 - Tipu Panel Settings, you need Tipu panel Indicator added to the chart for these settings
- Enable Tipu Panel - choose true/false.
- Short name for Tipu Panel - this name will appear on Tipu Panel indicator.
- Tipu Panel Display Mode - choose buy/sell signals or RSI plot value.
- Section#4 - Buy/Sell Global Alert Settings - these settings only affect Tipu Panel and Tipu RSI plot. The alerts for Dashboard are controlled by the settings dialogue of the Dashboard.
- Alert Entry OB/OS - alert when RSI enters overbought/oversold area.
- Alert Exit OB/OS - alert when RSI exits overbought/oversold area.
- Alert Shift - candle delay for the signal, enter 1 if you want the alert sent after one candle to be passed.
- Alert Mobile - select true/false to get a push notification on your device, make sure the device settings are correct here.
- Alert Onscreen - select true/false to get alerts on the terminal, this alert is shown in a separate window.
- Alert Email - select true/false to get email alerts, make sure email settings are correct here.
Reference
1 Wilder, J. (1978). The Parabolic System. In New concepts in technical trading systems. Greensboro, N.C.: Trend Research.
2 Cardwell, A. (1999). Relative Strength Index: Forecasting and Trading Strategies. John Wiley & Sons Canada, Limited.


Thanks, good indicator.