Tipu CCI
- インディケータ
- バージョン: 2.20
- アップデート済み: 14 5月 2018

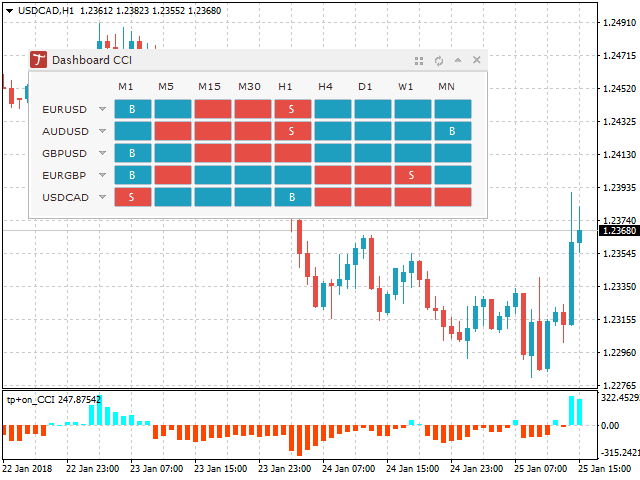
- 28 symbols, multi-time frame powerful Dashboard for the full market view
- Customizable Buy/Sell alerts, push alerts, email alerts, and visual on-screen alerts.
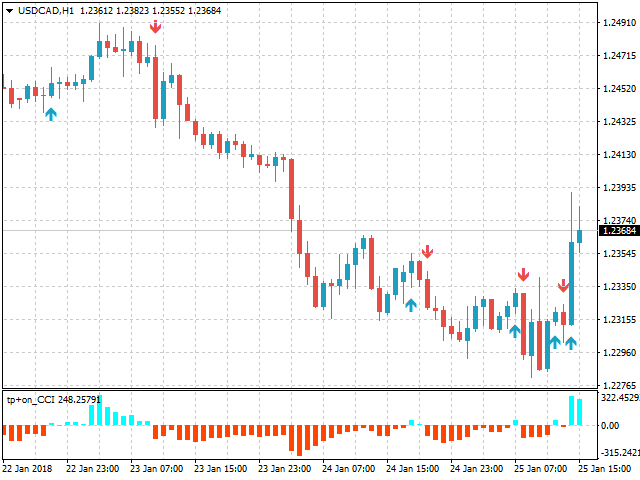
- Marked buy/sell signals
- Two color trend histogram.
The commodity channel index (CCI) is an oscillator originally introduced by Donald Lambert in 1980. CCI measures current price level relative to an average price level over a given period of time. CCI is high when prices are above the average price, and low when the prices are below the average price. CCI is a useful tool not only for identifying trend but also the overbought/oversold levels.
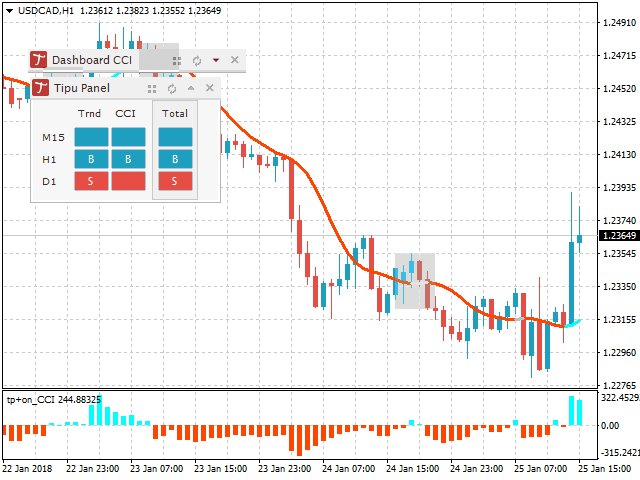
About Tipu Panel Series
Tipu Panel series is set of indicators created to consolidate indicators in form of a panel. As a trader, indicators can easily create a cluster on the chart and distract you from the bigger picture. It can also be overwhelming and visually exhausting. Tipu Panel simplifies this by displaying each indicator in a beautifully boxed panel. You can customize the panel to display indicator signals for multiple time frames and also to quickly switch time frames. There are two types of indicators that make up the Tipu Panel series, the master indicator, and the add-in indicators. The master indicator (Tipu Panel indicator) plots a beautifully designed panel, and the add-in indicators feed the data to this master indicator panel. These two types of indicators work together for a faster, and efficient performance on the chart.
Calculation
CCI = (Typical Price - 20-period SMA of TP) / (.015 x Mean Deviation)
Parameters
- Section #1 Tipu CCI settings
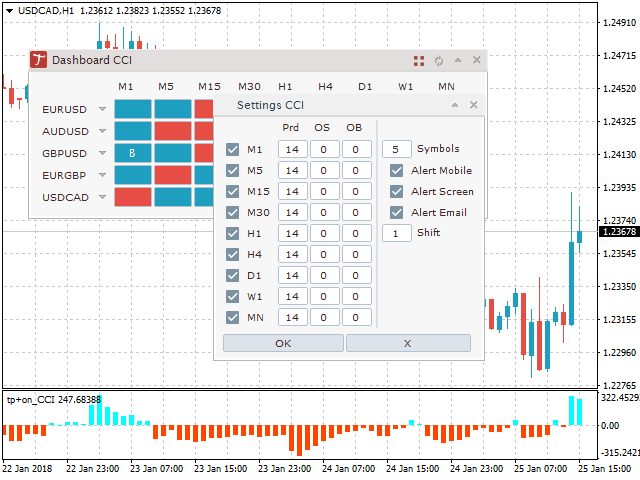
- CCI Period – settings for CCI.
- Applied Price – settings for CCI.
- Overbought – settings for CCI.
- Oversold – settings for CCI.
- Mark Buy/Sell Signals - choose Arrow or Vertical Lines or nothing.
- Arrow offset (pips) - (works only if mark the buy/sell signals = Arrow) select value to offset Arrows from high (if sell), and low (if buy). Increasing Arrow Offset (pips) move arrows away from the high/lows.
- Buy/Sell Colors – Colors for the marks
- Section #2 Multi-currency Dashboard setting
- Enable Tipu Dashboard? – choose to display and hide.
- Overbought/Oversold font and background colors on the Dashboard buttons.
- Additional settings for the Dashboard are controlled by the Dashboard settings button
- Section #3 Tipu Panel Settings
- Enable Panel?: visibility settings, select true/false to show panel (need Tipu Panel added to the chart).
- Short Name for the Panel: short name for the panel heading on Tipu Panel
- Section #4 Global Alert Settings
- Alert Buy: select true/false to enable buy alerts.
- Alert Sell: select true/false to enable sell alerts.
- Alert Shift: candle delay for the signal, enter 1 if you want the alert sent after one candle to be passed.
- Alert Mobile: select true/false to get the push notifications on your device, make sure the device settings are correct here.
- Alert Onscreen: select true/false to get alert on the terminal, this alert is shown in a separate window.
- Alert Email: select true/false to get email alerts, make sure email settings are correct here.


iyi çalışıyor teşekkürler paylaşım için EA sını yaptım bakalım kar edecekmi