BTC FootPrint and VolumeProfile on Binance Data

please contact me 210zyx@gmail.com if you want a short DEMO version or shorter subscription (like 1 Month for 10 USD)

There already are some good EA's that can draw the FootPrint and Volume Profile, but they are using number of "ticks" as the unit of volume, which is not accurate. One tick sometimes can mean very large or very small volume and they should not be scaled to the same unit.


The innovation of this EA is that it is able to draw the FootPrint and Volume Profile based on real Binance trade volume data (currently for Bitcoin only). Currently, the data source can be chosen from SPOT or FUTURES. I recommend using FUTURES and by default it is using FUTURES.This can be changed by using the EA input parameter.

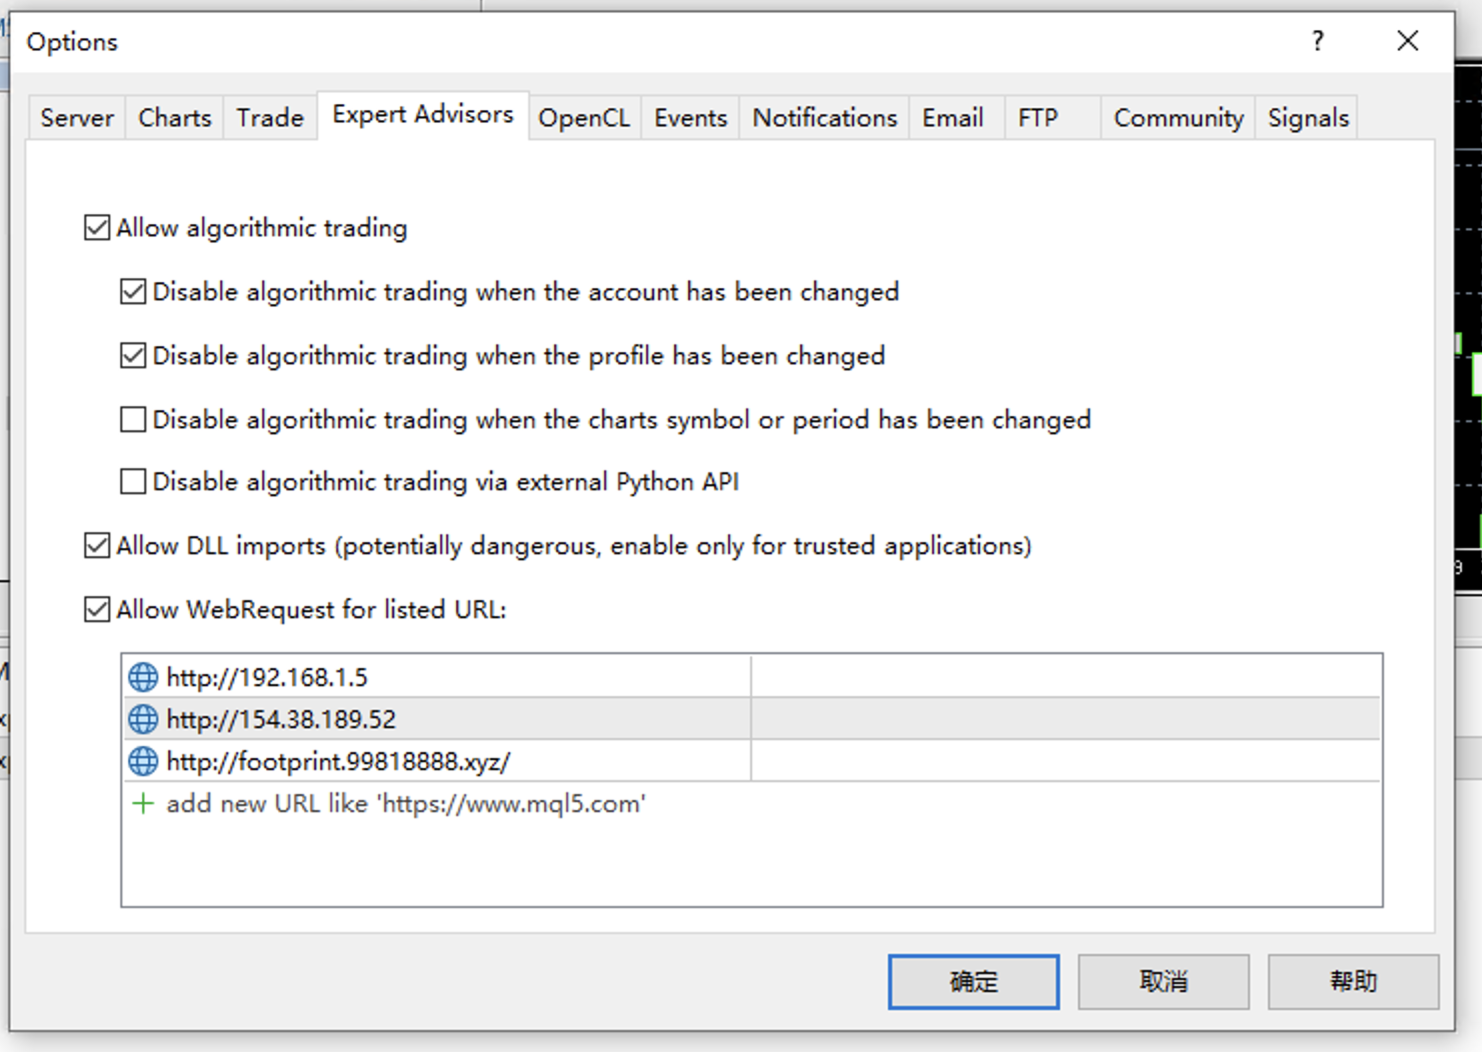
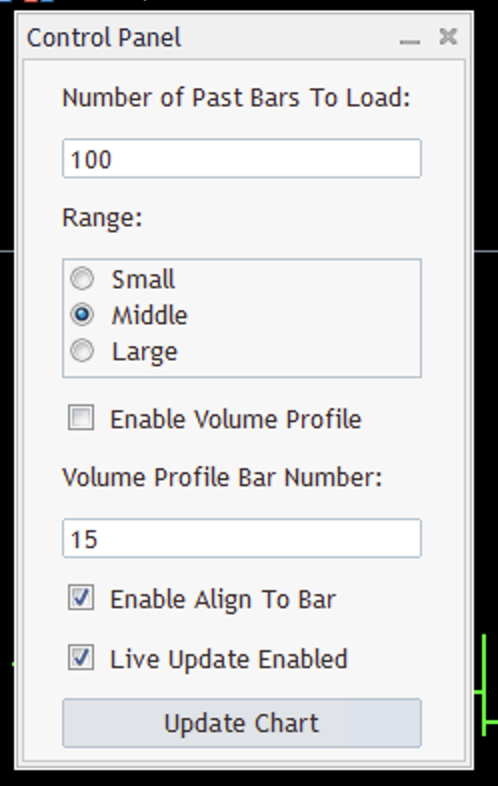
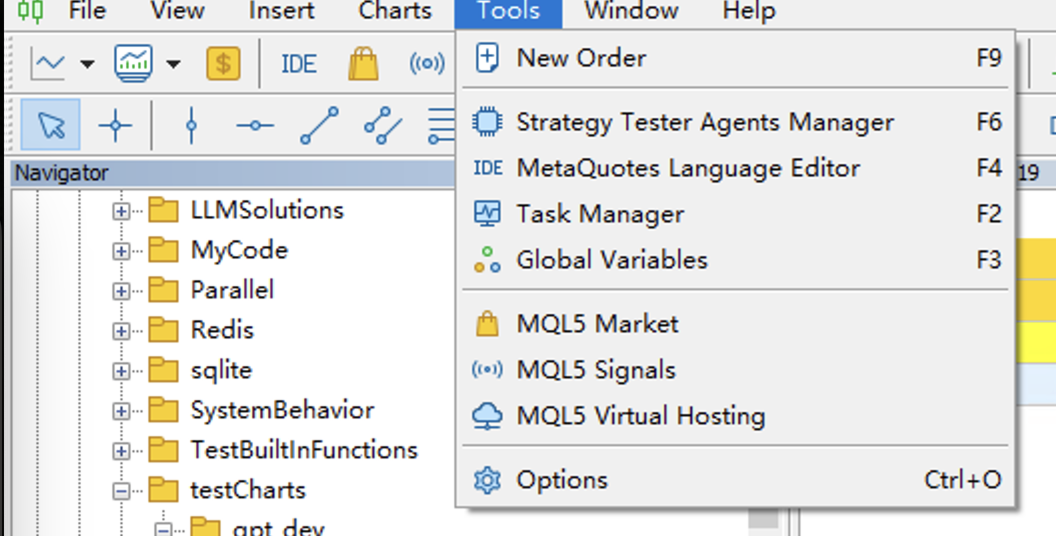
Usage: Load EA to the chart, set the parameters through panel and click "update". Please add "http://footprint.99818888.xyz" to allowed Web Request URL. (like the screenshot does). Unfortunately we have to do this because MQL5 community doesn't allow publish EA which requires DLL. If you want a version that does not require this, please contact me 210zyx@gmail.com. 

Supported timeframe: M1, M5, M15, M30, H1


FootPrint:
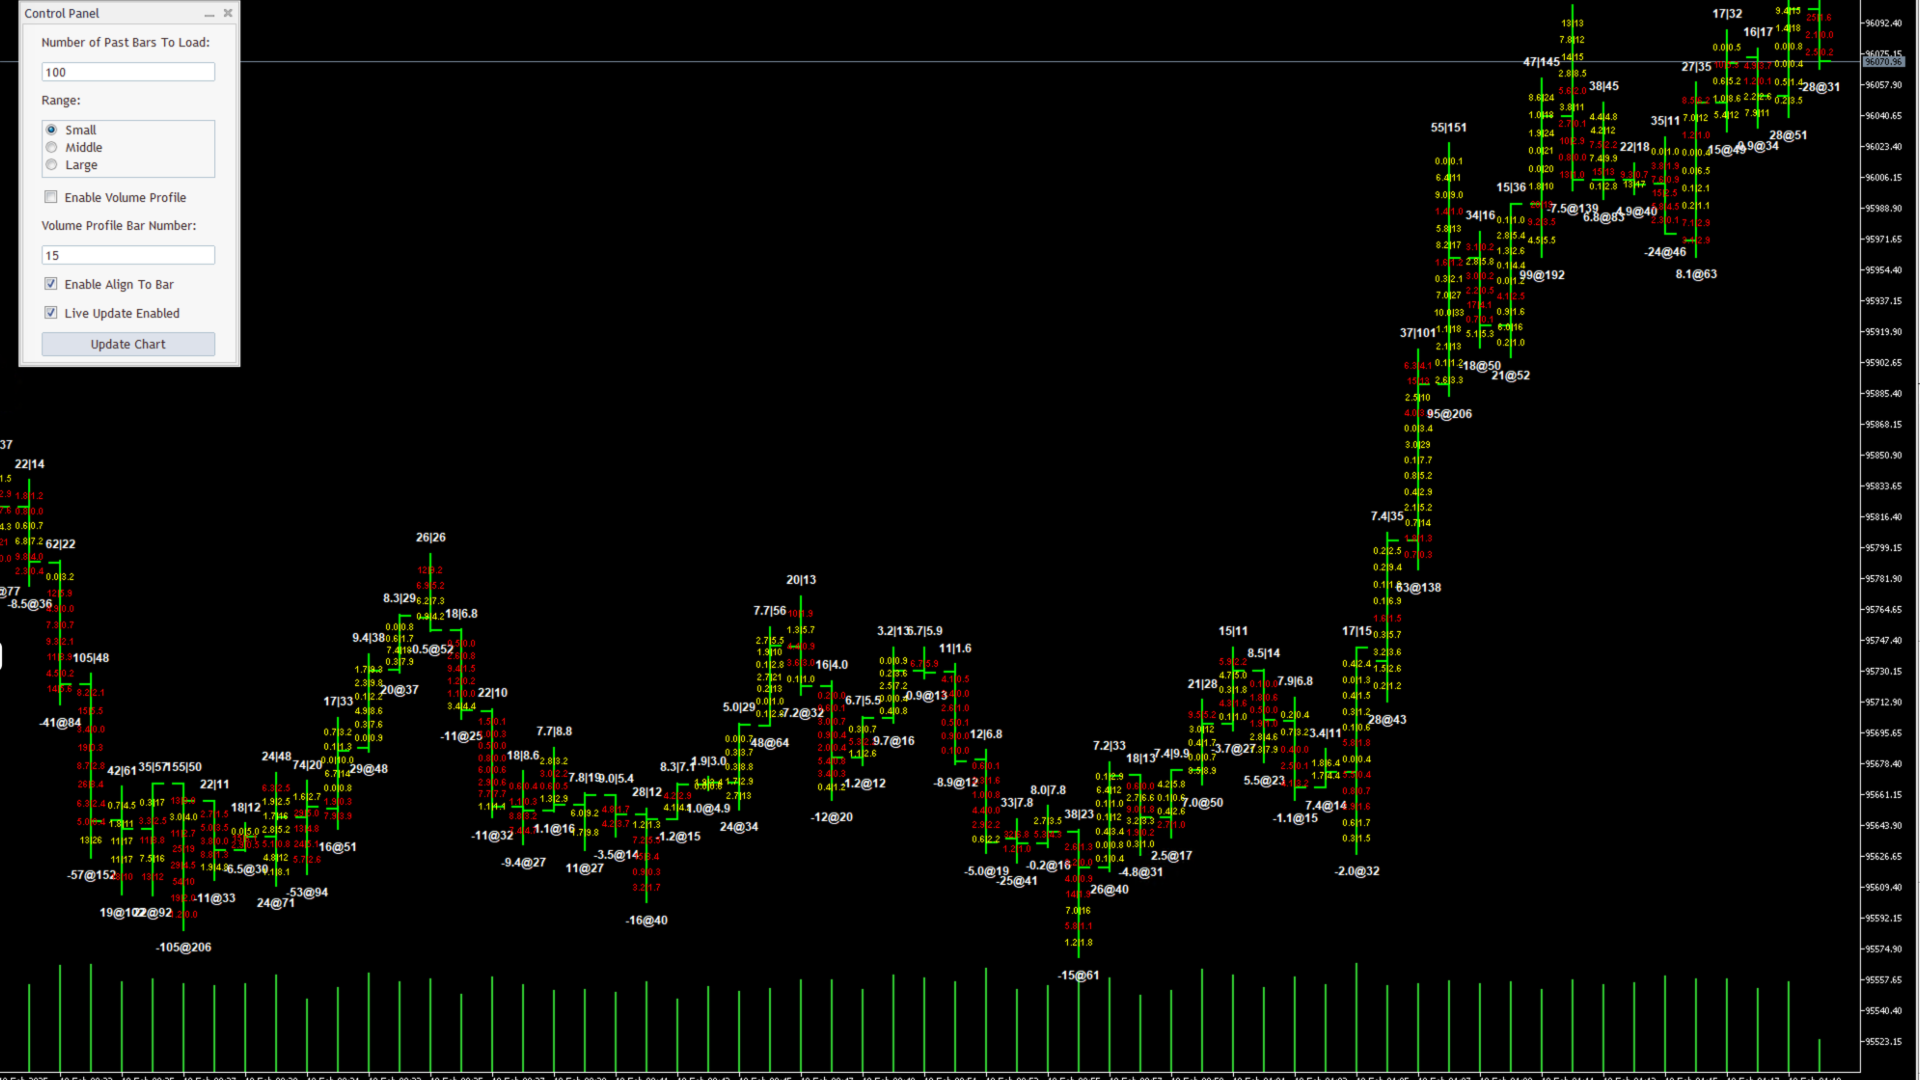
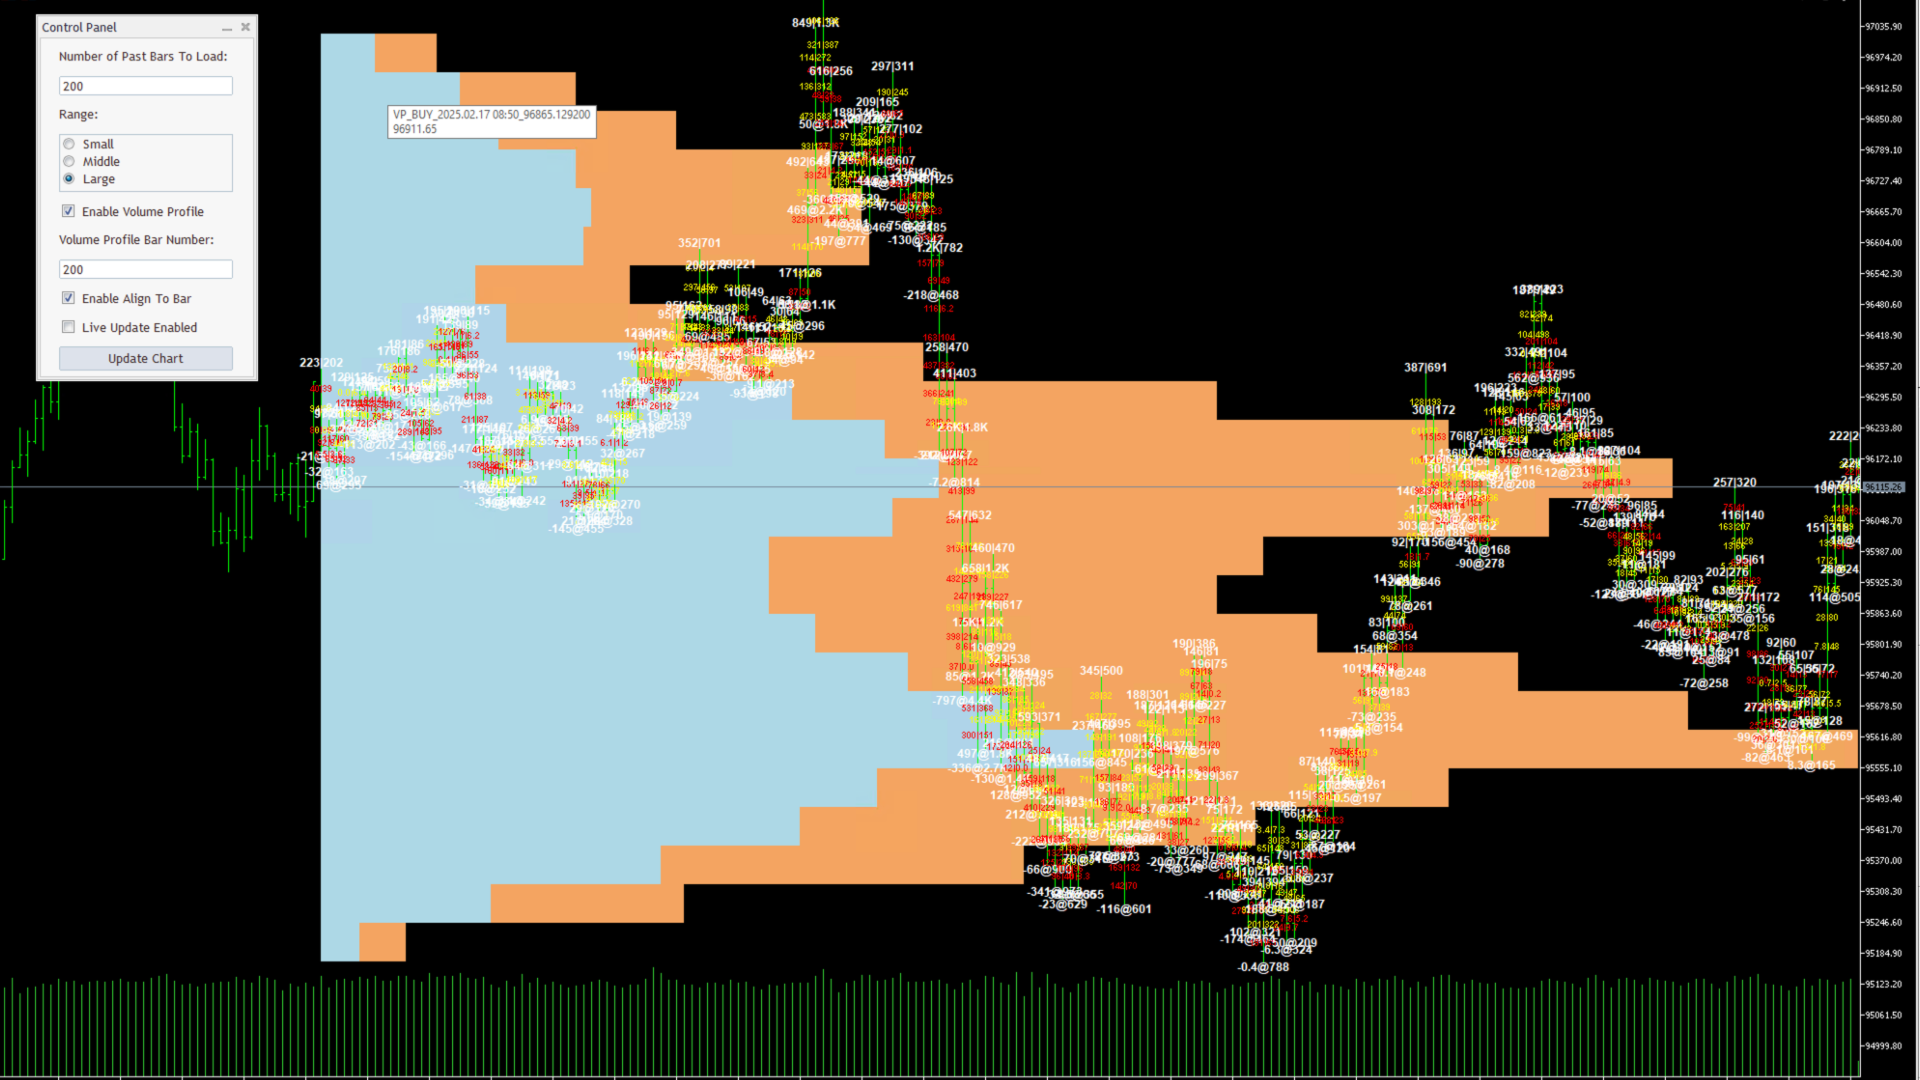
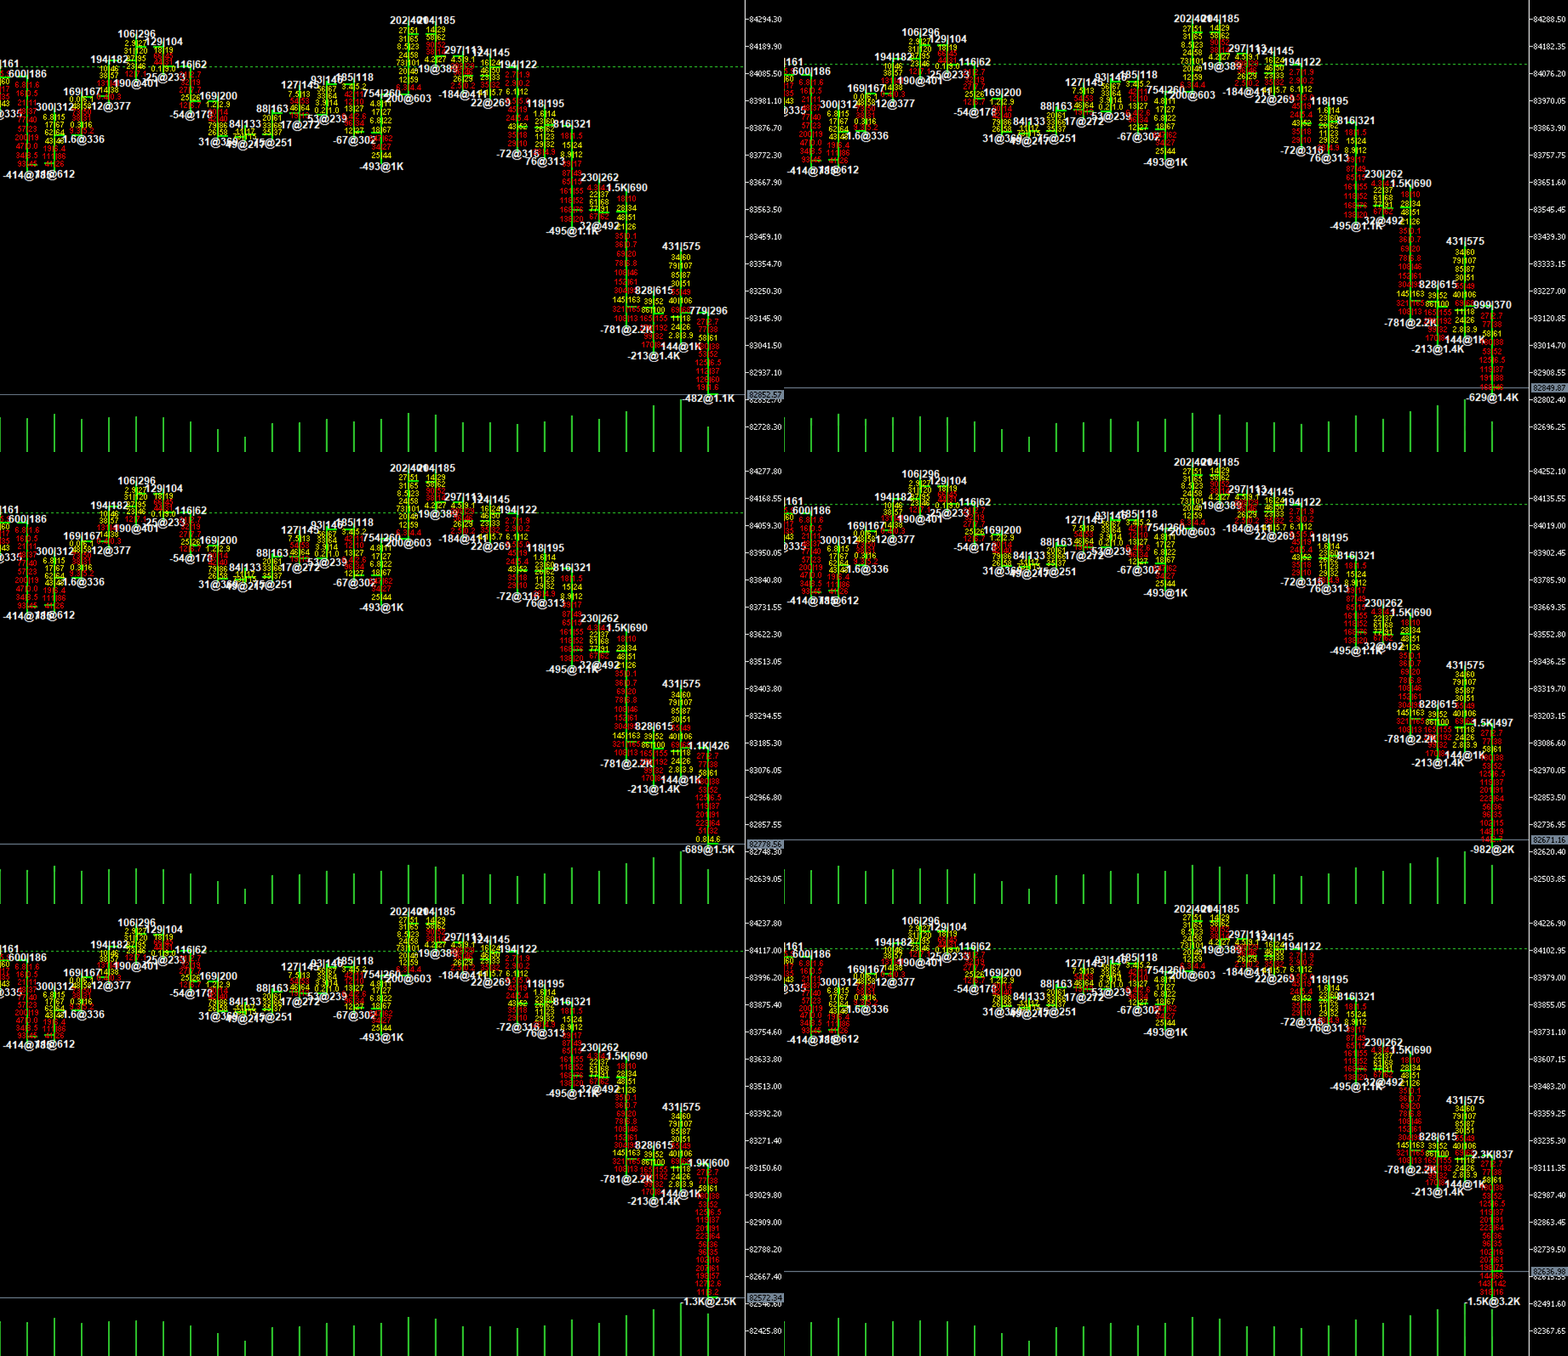
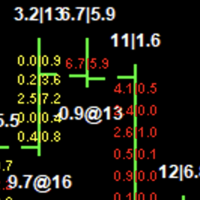
It is able to draw the FootPrint based on the actual Binance data. Its price could be different from your MT5 price, but if choose to "align to bar", it will align the numbers in the bar to your MT5 bar by scaling and offsetting.

Volume Profile:
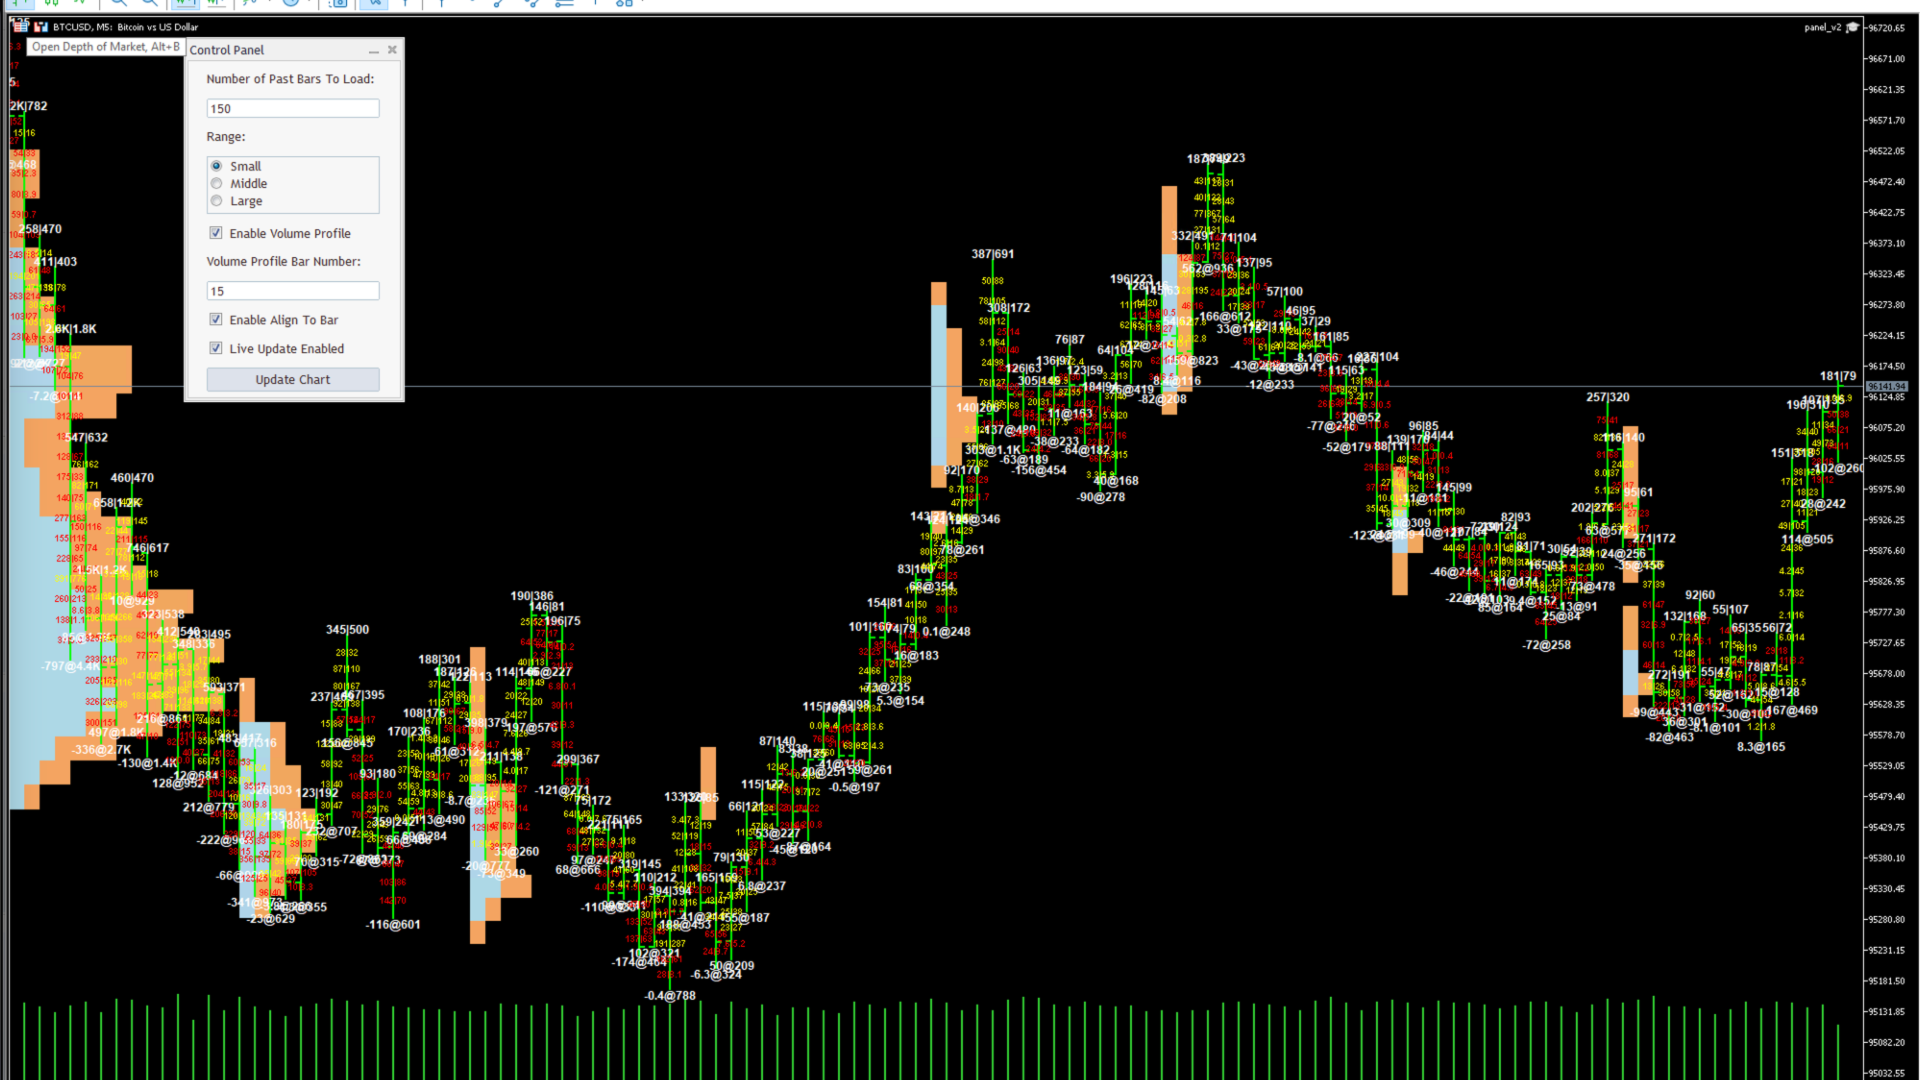
You can choose to draw the Volume Profile based on your chosen periods. Say you loaded 150 bars and choose 10 as the period, it will draw 15 volume profiles, each of which show volume provile for 10 bars. Because of the limitation of the MT5, the width of of the rectangle has the minimum resolution of one bar, therefore I choose to scale the larget volume to the periods and other volumes are scaled relative to the largest volume. Of course if you choose 150 as the period, it will draw one volume profile for the whole history selected (150 bars).


Live Update:
By default, if your chart is showing the most recent bar in visible area, the EA will update the numbers bars on the most recent bar automatically, but as soon as you scroll the chart so that the recent bars are not shown, it will stop updating. You can then turn it on again by checking the "Live Update" checkbox and click "update" button.

Check for History:
One can use this with history bars. Just scroll the chart to appropriate area and click "update". A tip for doing this is that you can enter the datetime string in the chart search bar to quickly scroll to the appropriate area.


The MQL5 communicaty won't allow me to set a price lower than $30 per month. You can use $30 three-month option: That is equivalent to $10 per month. Don't hesitate to reach for any issues or feathre request: 210zyx@gmail.com

おすすめのプロダクト
Master Editionは、ボリュームとマネーフローの視点を通じて市場構造を可視化するために設計されたプロフェッショナルグレードの分析ツールです。標準のボリュームインジケーターとは異なり、このツールはチャート上に日足ボリュームプロファイルを直接表示し、価格発見がどこで行われたか、そして「スマートマネー」がどこに位置しているかを正確に確認できます。 このMaster Editionは、明確さとスピードを考慮して設計されており、ロード時にチャートレイアウトを即座に美化するユニークな自動テーマ同期システムを備えています。 主な機能: 真のマネーフロー計算: 標準のティックボリュームを超えます。「Use Money Flow」を有効にすると、ボリュームは価格によって重み付けされ、特定の価格レベルでの実際の資本コミットメントが明らかになります。 バリューエリア (VA) の可視化: バリューエリア(デフォルトではボリュームの70%)を自動的に計算します。 VA Fill: コントロールゾーンを即座に識別するために、バリューエリアの背景をシェーディングします。 主要レベル: コントロールポイン
MT5用ボリュームプロファイルVPVR ボリュームプロファイルVPVRは、高度なボリュームプロファイル(可視範囲)をチャート上に直接再現する、強力で高性能なMetaTrader 5インジケーターです。取引活動が集中している場所を視覚化することで、市場構造を深く理解し、トレーダーが重要な価格レベルを正確に特定するのに役立ちます。 このインジケーターは、価格レベルごとのボリューム分布を動的に分析し、詳細なヒストグラムをチャート上に直接表示します。これにより、市場の受容ゾーン、拒否ゾーン、流動性クラスターを一目で把握できます。 主な機能 • 可視範囲モードと固定範囲モード VPVR(可視ローソク足に合わせて自動調整)と、より精密な分析のための独自のカスタム範囲をシームレスに切り替えられます。 • ポイントオブコントロール(POC) 取引量が最も多い価格レベル(市場の関心度が最も高いレベル)を自動的に検出し、ハイライト表示します。 • バリューエリア(VAH / VAL) 設定可能なパーセンテージ(デフォルト70%)に基づいてバリューエリアの高値と安値を表示し、適正価格帯を
Global Market Sessions – Visual Analyzer for MT5 A lightweight MT5 indicator that visually maps Tokyo, London and New York sessions, auto-detects broker timezone & DST, and highlights the best liquidity windows for smarter trading. See the market’s rhythm at a glance. Trade with clarity, precision, and confidence. Overview Global Market Sessions is a powerful yet easy-to-use MT5 indicator that visually displays the world’s major trading sessions (Tokyo, London, New York) directly on your chart
FREE
Was: $249  Now: $99   Market Profile defines a number of day types that can help the trader to determine market behaviour. A key feature is the Value Area, representing the range of price action where 70% of trading took place. Understanding the Value Area can give traders valuable insight into market direction and establish the higher odds trade. It is an excellent addition to any system you may be using. Inspired by Jim Dalton’s book “Mind Over Markets”, this indicator is designed to suit the
Advanced Volume Profile Liquidity Analysis via Custom Area Selection The Advanced Manual Volume Profile is a precision tool for MetaTrader 5 designed to deconstruct market structure through price-level volume analysis. Unlike static profiles, this indicator exclusively processes the price and time range defined by the user via a rectangle object, offering a surgical view of the market auction. Elite Technical Specifications Dynamic Algorithm: Real-time calculation (400ms refresh rate) based on t
FREE
Volume Profile Multiple — アルゴリズム取引対応バッファ付き マルチブロック・ボリュームプロファイル 時間足を変えるたびにボリュームプロファイルを一つずつ描き直し、再計算する手間にうんざりしていませんか? Volume Profile Multiple は、チャート上に複数の連続したボリュームプロファイルを自動的に描画し、直近の表示範囲だけでなく、相場の各区間で機関投資家の関心が実際にどこにあったのかを明らかにします。 この指標が行うこと 本指標は価格履歴をN本のローソク足ごとのブロックに分割し(ブロック数と1ブロックあたりの本数は自由に設定可能)、各ブロックについて完全なボリュームプロファイルを計算します:コントロールポイント(POC)、バリューエリアの上限・下限(VAH/VAL)、高出来高ゾーンと低出来高ゾーン(HVN/LVN)です。結果として、ブロックごとの市場構造を視覚化したマップが得られ、実出来高に基づく蓄積ゾーン、サポート・レジスタンス、バリューエリア間の価格ローテーションの特定に役立ちます。 アルゴリズム取引にも対応 多くのボリュームプロファイル系
VOLUME PROFILE SAF-XII MT5専用プロフェッショナル・マーケットプロファイル分析ツール(グリッドトレードに最適な「ドリーム・インジケーター」) ボリュームプロファイル(価格帯別出来高)とは? ボリュームプロファイルは、従来の「時間軸」の出来高とは異なり、「特定の価格帯」での取引活動を表示するプロ仕様のツールです。選択した期間内の「どこで」取引が行われたかを可視化し、以下のポイントを特定します: バリューエリア (VAH/VAL) :全取引の大部分が行われた価格帯。 ポイント・オブ・コントロール (POC) :最も出来高が集中した単一の価格水準。 リクイディティ・イムバランス :各価格帯における強気(買い)と弱気(売り)の優劣。 サポレジ(支持・抵抗) :実際の取引活動に基づいた自然な価格水準。 3つの動作モード — 「設定したらあとはお任せ」 VP_MANUAL(スイングトレード・重要ライン分析) 垂直ラインをドラッグして分析範囲を手動で設定。 ラインを動かした時のみ再計算されるため軽量。 用途 :指標発表前分析、決算発表、特定の期間分析。 VP_AUTO(スキ
This   Demand & Supply Zone Indicator with Volume Filtering   is a technical analysis tool for MetaTrader that identifies key price zones where buying (demand) or selling (supply) pressure is concentrated. It uses fractals, volume analysis, and price action to detect and highlight these zones on the chart. Key Features: Zone Detection Based on Fractals Identifies demand (support) and supply (resistance) zones using   fractal patterns   (local highs/lows). Zones are formed from   open prices   ar
FREE
LuoMo Volume & Price Structure 8.98 A multi-function chart indicator for   MetaTrader 4 and MetaTrader 5 , designed to display key volume, volatility, sentiment, and price-structure information directly on the main chart. Main Features Volume and price-based Support & Resistance Volume spike and exhaustion signals ATR volatility expansion alerts Volume Profile with HVN and LVN Bullish and bearish sentiment distribution Developing or fixed POC VAH and VAL levels Supply and Demand zones Volume-wei
Here   our more valuable tools SMC Trend Trading   ,  Easy SMC Trading  ,  Institutional SMC Architect Volume Analysis Tools  ,  Volume flow Profile  ,  Market volume profile  , FVG with Volume  , Liquidity Heatmap Profile  ,  Volume Spread Analysis A professional spike pattern indicator built for synthetic traders who scalp and swing Crash 500/300/1000 with precision.  This indicator: Detects powerful 3-candle spike formations (Spike → Pullback → Spike) Automatically draws a clean box a
FREE
Pro Order Lot Size Calculator Pro Order Lot Size Calculator is a simple and practical tool designed to help you calculate the appropriate lot size based on the amount of risk you want to take . With this tool, you can easily calculate your trading risk directly from the panel according to the amount of money available in your account. Easy Risk & Lot Calculation The panel is designed to be very simple and easy to use. You can choose how you want to define your risk: Enter your desired risk amoun
Was: $299  Now: $99  Supply Demand uses previous price action to identify potential imbalances between buyers and sellers. The key is to identify the better odds zones, not just the untouched ones. Blahtech Supply Demand indicator delivers functionality previously unavailable on any trading platform. This 4-in-1 indicator not only highlights the higher probability zones using a multi-criteria strength engine, but also combines it with multi-timeframe trend analysis, previously confirmed swings a
Here   our more valuable tools SMC Trend Trading   ,  Easy SMC Trading  ,  Institutional SMC Architect Volume Analysis Tools  ,  Volume flow Profile  ,  Market volume profile  , FVG with Volume  , Liquidity Heatmap Profile  ,  Volume Spread Analysis The    Liquidity Heatmap   is a sophisticated institutional trading tool designed to reveal where over-leveraged traders are trapped. By calculating estimated liquidation levels based on volume spikes and leverage, this indicator draws a dynamic "h
Volume Profile は、プロや機関投資家が使用する最も強力な分析ツールの1つです。画面の下部に取引が行われた時期のみを表示する従来のボリュームインジケーターとは異なり、Volume Profile はそれらの取引がどの価格レベルで行われたかを正確に表示します。これにより、市場構造の明確なX線ビジョンが得られ、スマートマネー (smart money) や機関投資家がどこでポジションを蓄積または分配しているかを正確に確認できます。 Volume Profile が機関投資家の注文と Support/Resistance を検出する方法 このインジケーターは、価格スケールに対してボリュームを水平にプロットすることで、実際の過去のトランザクションに基づいて真の需要と供給のゾーンを自然に明らかにします。標準的な Volume Profile のルールに基づいて、市場を読み取る方法は次のとおりです。 Point of Control (POC): これは、選択した期間内で最も取引量が多い特定の価格レベルです。POC は、買い手と売り手の両方が受け入れた最も公正な価格を表します。機関投資
Do you use volume in your reading of the market? Certainly many traders use it, and do not imagine operating without it. The Color Histogram Volume Set indicator allows the user to choose the value that he considers interesting to monitor. When you pass this you will have visual confirmation and if you want you will also have the audible alert that is given by the indicator. Of course, there are other ways to try to find a high volume, such as assessing whether the volume is above av
SMART ATR GRID PRO++ – Adaptive Grid Intelligence Suite is a next-generation, institutional-grade grid trading indicator engineered for traders who demand precision, adaptability, and comprehensive market structure analysis. By seamlessly integrating   Adaptive Volatility Grid System ,   KAMA Candle Trend Filtering ,   Multi-Factor Trend Detection (ADX + EMA20/50) ,   Dynamic Heatmap Zone Engine , and   Real-Time Market Regime Classification , this indicator delivers a complete decision-making
Cumulative Volume Delta MA-X MTF (Gradient Momentum 搭載) このインディケーターは、MetaTrader 5向けにマルチタイムフレーム(MTF)での累積ボリューム・デルタ(CVD)分析を行います。ティックデータまたはリアルボリュームデータを分析することで、買い圧力と売り圧力の純差を計算し、オーダーフローのセンチメントを視覚的に表現します。 ロジックと機能 このインディケーターは、数学的なアプローチを用いてボリューム分析を行います: データソース : 取引所銘柄のリアルボリューム(Real Volume) と、FX/CFD向けの OHLCウィック・プロキシ(OHLC Wick Proxy)計算の両方をサポートしています。 グラデーションシステム : 4色の移動平均線がトレンドの段階を識別します: ディープスカイブルー(DeepSkyBlue) : 数値が正で、上昇中。 オレンジ(Orange) : 数値が正で、下落中。 マゼンタ(Magenta) : 数値が負で、下落中。 パープル(Purple) : 数値が負で、上昇中。 5レイヤー
Alpine Volume Profile See where the real volume traded — not just where price moved. Alpine Volume Profile is an MQL5 indicator that transforms raw tick or exchange volume into a clean, readable horizontal histogram directly on your chart. Instead of a single volume bar at the bottom of the screen, you get a full breakdown of which price levels attracted the most trading activity, session by session. What It Does For every day, week, or fixed block of bars you choose, Alpine Volume Profile build
FREE
XAUUSD OrderFlow Structure AutoPOC Pro is an advanced MetaTrader 5 indicator designed to analyze market structure, order flow, buying and selling pressure, liquidity, and volume distribution directly on the chart. The indicator is especially focused on XAUUSD (Gold) analysis, although it can also be used with other instruments available in MetaTrader 5. Its objective is to bring together several analytical tools that would normally require multiple indicators: market structure, BOS and CHOCH, Or
Blahtech VWAP - Volume Weighted Average Price (VWAP) is the ratio of price to total volume. It provides an average price over a specified time interval.  Links [  Install  |  Update  |  Documentation   ] Feature Highlights Configurable VWAP Line Sessions, intervals, anchored or continuous Previous day settlement line Standard Deviation bands Alerts at bar close or real time Automatic Broker or Tick volumes Significantly reduced CPU usage Input Parameters Expert Advisor Mode  - Reserved for iCu
FREE
Volume Profile Utility
AL MOOSAWI ABDULLAH JAFFER BAQER
Volume Profile Discover where the market really trades. Make decisions based on volume, not guesswork. Volume Profile is a professional MetaTrader utility that analyzes trading activity across different price levels, allowing traders to identify where the highest concentration of market participation has occurred. Instead of focusing only on price movement over time, Volume Profile reveals the price levels where buyers and sellers have been most active, providing valuable insight into market str
HTF Candles Nikaは、MetaTrader 5の現在のチャートに、任意の上位時間足のローソク足をフルサイズで直接オーバーレイ表示します。チャートを切り替えることなく、マルチタイムフレームの視点を提供します。 主な機能 - 上位時間足のローソク足を、ヒゲ付きの塗りつぶし矩形として現在のチャートに描画 - 標準ローソク足とHeiken Ashiの両表示モードに対応 - 現在のHTFローソク足が閉じるまでの残り時間をリアルタイムでカウントダウン表示 - 陽線・陰線のカラーをカスタマイズ可能 - ローソク幅の自動または手動制御 - ヒゲの幅、フォント、フォントサイズ、テキスト位置オフセットを設定可能 - あらゆるシンボルと時間足の組み合わせに対応 - セッションのギャップを自動検出してレンダリングを調整 - 軽量設計 — チャートオブジェクトのみ使用、インジケーターバッファなし 入力パラメーター 表示設定 - Max Lookback — 描画するHTFバー数(デフォルト:500) - Timeframe — 表示する上位時間足(デフォルト:H1) - Bars Mode
FREE
The Mirror Chart MT5 is a overlay indicator specifically designed to project a second financial instrument directly onto the main chart window. This tool is invaluable for traders who rely on correlation analysis, as it visualizes the price movements of two different instruments in real time. Unlike traditional overlays, this indicator utilizes intelligent, dynamic centering and scaling logic. It continuously analyzes the visible price range in the current window for both symbols and calculates
FREE
Daily & Composite Volume Profile   This is a professional-grade market profile tool designed for MetaTrader 5. It utilizes a   Dual-Profile System   to visualize supply, demand, and liquidity concentrations. Key Features Left Side: Daily Session Profiles Automatically identifies the start and end of every trading day. Generates a unique Volume Profile for each individual day. Allows you to see how value migrated from yesterday to today (e.g., Is today's volume higher or lower than yesterday?).
The "MR Volume Profile 5" indicator is a charting tool that displays trading volume at different price levels rather than time intervals. A key concept in volume profile is the point of control (POC)—the price level with the highest volume traded during the session or time range. While tools like VWAP or OBV provide volume trends, the "MR Volume Profile 5" indicator offers granular detail about where the most market activity occurs at specific price levels. This makes it a more precise tool for
Value Chart Candlesticks
Flavio Javier Jarabeck
4.57 (14)
The idea of a Value Chart indicator was presented in the very good book I read back in 2020 , " Dynamic Trading Indicators: Winning with Value Charts and Price Action Profile ", from the authors Mark Helweg and David Stendahl. The idea is simple and the result is pure genius: Present candlestick Price analysis in a detrended way! HOW TO READ THIS INDICATOR Look for Overbought and Oversold levels. Of course, you will need to test the settings a lot to find the "correct" one for your approach. It
FREE
インディケータは現在のクオートを作成し、これを過去のものと比較して、これに基づいて価格変動予測を行います。インジケータには、目的の日付にすばやく移動するためのテキスト フィールドがあります。 オプション: シンボル - インジケーターが表示するシンボルの選択; SymbolPeriod - 指標がデータを取る期間の選択; IndicatorColor - インジケータの色; HorisontalShift - 指定されたバー数だけインディケータによって描画されたクオートのシフト; Inverse - true は引用符を逆にします。false - 元のビュー。 ChartVerticalShiftStep - チャートを垂直方向にシフトします (キーボードの上下矢印)。 次は日付を入力できるテキストフィールドの設定で、「Enter」を押すとすぐにジャンプできます。
Tick Volume Chart は、 MetaTrader 5 上でティックボリュームに基づいたチャートを作成するためのユニークなツールです。 Tick Volume Chart を使用すると、時間ではなく、指定したティック数ごとにローソク足が形成されるチャートを構築できます。これにより、標準的な時間足チャートでは得られない、市場活動の極めて正確な分析が可能になります。カスタムシンボルに対応したインジケーターやEA(自動売買プログラム)であれば、すべてご利用いただけます。作成したチャートは、標準チャートと同様に快適に操作できます。 標準ツールとは異なり、 Tick Volume Chart は時間間隔ではなく、実際の取引強度に基づいて市場を分析することを可能にします。 Tick Volume Chart の利点 各バーに 固定ティックボリューム を設定したチャートを作成可能。 内蔵ティックデータベースにより、履歴データの 高速な読み込み を実現。 リアルタイムデータが、 通常のチャートと同期し、遅延なく 更新されます。 複数の ティックボリュームチャートを同時に作成 することが可能
Flow Architect Lite - Professional Market Structure Toolkit Free Version Features: Core Structure Analysis: Daily VWAP Engine   - Volume-weighted average price for institutional level tracking Standard Deviation Bands (SD1)   - Dynamic support and resistance zones Break of Structure Detection   - Visual markers for market structure shifts Fair Value Gap Identification   - Highlighted imbalance zones on your charts ATR Volatility Context   - Real-time Average True Range measurement Clean Informat
VibeFox Volume Profile — MetaTrader 5 向け Volume Profile VibeFox Volume Profile は、MetaTrader 5 向けの完全な Volume Profile ツールセットです。取引された出来高を価格に沿って水平方向に分布させて描き出すため、市場が最も活発だった場所、薄商いだった場所、そしてどの価格水準が磁石や障壁として働きやすいかを一目で確認できます。各プロファイルはチャート上に直接描画され、モダンでマウス操作のパネルから制御されます——掘り下げるメニューも、アタッチするスクリプトもありません。 ローソク足だけからサポートとレジスタンスを推測する代わりに、出来高の実際の足跡を扱います。価格を引き寄せる高出来高ノード、価格が素早く通過しがちな低出来高のすき間、そして大半の取引が行われた公正価値ゾーンです。 必要な形の Volume Profile Volume Profile は単一の固定プロファイルではありません。 複数の独立したプロファイルエンジンを同時に 提供し、それぞれが独自の範囲、配置、スタイルを持つため
このプロダクトを購入した人は以下も購入しています
Trade Assistant MT5
Evgeniy Kravchenko
4.43 (216)
取引 ごとのリスクの 計算、新規注文 の 簡単 な 設置、部分的 な 決済機能 を 持 つ 注文管理、 7 種類 のトレーリングストップなど 、便利 な 機能 を 備 えています 。 追加の資料と説明書 インストール手順   -   アプリケーションの手順   -   デモアカウント用アプリケーションの試用版 ライン機能 チャート上にオープニングライン、ストップロス、テイクプロフィットを表示します。この機能により、新規注文を簡単に設定することができ、注文を出す前にその特徴を確認することができます。   リスク計算 リスク計算機能は、設定されたリスクとストップロス注文のサイズを考慮して、新規注文のボリュームを計算します。ストップロスの大きさを自由に設定できると同時に、設定したリスクを守ることができます。 Lot calc ボタン - リスク 計算 を 有効 / 無効 にします 。 Risk フィールドでは 、必要 なリスクの 値 を 0 から 100 までのパーセンテージまたは 預金通貨 で 設定 します 。 設定」 タブで 、 リスク 計算 の 種類 を 選択 します :「 $ 通
Trade Manager EAへようこそ。これは、取引をより直感的、正確、そして効率的にするために設計された究極の リスク管理ツール です。これは単なるオーダー実行ツールではなく、包括的な取引計画、ポジション管理、リスク管理のためのソリューションです。初心者から上級者、迅速な実行を必要とするスキャルパーまで、Trade Manager EAはあらゆるニーズに対応し、為替、指数、商品、暗号通貨などさまざまな市場で柔軟に対応します。 Trade Manager EAを使用すると、複雑な計算が過去のものになります。市場を分析し、エントリーポイント、ストップロス、テイクプロフィットのレベルをチャート上のラインでマークし、リスクを設定するだけで、Trade Managerが最適なポジションサイズを即座に計算し、SLとTPをピップ、ポイント、口座通貨でリアルタイムに表示します。すべての取引が簡単かつ効果的に管理されます。 主な機能: ポジションサイズ計算機 :定義されたリスクに基づいて取引サイズを瞬時に決定します。 簡単な取引計画 :エントリー、ストップロス、テイクプロフィットを設定するためのド
Telegram to MT5 Multi-Channel Copier   は、 Telegram と Discord チャンネルのトレードシグナルを MetaTrader 5 へ自動コピーします。ボット不要、ブラウザ拡張不要、手動コピー不要。Telegram や Discord にシグナルが届くと、EA が数秒であなたのターミナルに注文を出します。 さらに、チャンネルをコピーする前に、内蔵バックテスターでそのチャンネルがあなたの口座でどう動いたかを確認できます。 製品は 2 つのコンポーネントで構成されます:Telegram チャンネルを監視する Windows アプリと、MT5 ターミナルでシグナルを執行する本 EA です。MT4 版もあります   こちら . セットアップガイドとアプリのダウンロード:   https://www.mql5.com/en/blogs/post/768988 Telegramのシグナルチャンネルをバックテストする方法 をご覧ください。 現在の価格は今後値上げされます。 仕組み アプリはあなた自身の Telegram アカウントで接続するため、フォロ
================================================================================ POC BREAKOUT - V20.72. Full Professional Grade Toolkit ================================================================================ POC Breakout is a full MetaTrader 5 trading dashboard for discretionary traders who want breakout signals, Point of Control (POC) context, volume profiles, order flow, market structure, news, alerts, and advanced trade planning in one professional workspace. Attached directly to you
TradePanel MT5
Alfiya Fazylova
4.88 (170)
Trade Panelは多機能なトレーディングアシスタントです。アプリには手動取引用の50以上のトレーディング機能が搭載されており、ほとんどの取引作業を自動化することができます。 アプリの説明書: https://www.mql5.com/en/blogs/post/756482 デモ口座用アプリの試用版: https://www.mql5.com/en/blogs/post/750865 アプリのインストール方法: https://www.mql5.com/en/blogs/post/756239 アプリをビジュアルモードでテストする方法: https://www.mql5.com/en/blogs/post/770277 VPSのMetaTraderにアプリをインストールする方法: https://www.mql5.com/en/blogs/post/770190 取引。 ワンクリックで取引操作を行うことができます: リスクを自動計算して指値注文やポジションを開く。 複数の注文やポジションをワンクリックで開く。 注文のグリッドを開く。 保留中の注文やポジションをグループごとに閉じる
自分の取引ルールで Telegram のシグナルをコピー Telegram to MT5 Signal Trader は、Telegram の公開・非公開チャンネルやグループから、テキスト形式の取引シグナルを MetaTrader 5 へ自動でコピーします。1つのデスクトップアプリで複数の配信者と MT5 口座を管理し、 配信者ごとにリスクと取引設定を個別に指定 できます。 シグナルのコピーに Telegram ボットや API 設定は必要ありません。 電話番号または QR コードでご自身の Telegram アカウントにログインし、すでに参加しているチャンネルやグループを選ぶだけです。ボットの作成や、Telegram API トークン、API ID、API hash の入力は不要です。 ポジションサイズを選び、複数の利確水準に分けて決済し、建値へのストップ移動やトレーリングストップを自動化できます。配信者のシグナルを受け取りながら、実際の取引方法は自分で管理できます。 本製品は、この MT5 エキスパートアドバイザ(EA)と、必須の Windows 連携アプリで構成されます。 インス
Power Candles Strategy Scanner - 自動最適化型マルチシンボル設定ファインダー パワーキャンドル・ストラテジー・スキャナーは 、パワーキャンドル・インジケーターを駆動するのと全く同じ自己最適化エンジンを、マーケットウォッチに登録されているすべての銘柄に対して並行して実行します。1つのパネルで、現在統計的に取引可能な銘柄、各銘柄で勝率の高い戦略、最適なストップロス/テイクプロフィットの組み合わせが表示され、新たなシグナルが発生した瞬間に通知が届きます。 このツールは、Stein Investmentsのエコシステムの一部です。  18種類以上のツールをすべて閲覧し、AIを活用したセットアップの推奨を受け取り、  https://stein.investments でコミュニティに参加しましょう 市場動向を網羅。銘柄ごとに3,000件以上の自動最適化。2種類のアラート。ワンクリックでチャートを切り替えて即座にアクション。 なぜこれが必要なのか 多くのマルチ銘柄スキャナーは、 価格の動き (ボラティリティ、変動率、銘柄ごとのRSI)を表示するだけです。それ
Grid Manual MT5
Alfiya Fazylova
4.73 (22)
「Grid Manual」は、注文のグリッドを操作するための取引パネルです。 ユーティリティはユニバーサルで、柔軟な設定と直感的なインターフェイスを備えています。 それは、損失を平均化する方向だけでなく、利益を増やす方向でも注文のグリッドで機能します。 トレーダーは注文のグリッドを作成して維持する必要はありません。 すべてが「Grid Manual」によって行われます。 注文を開くだけで十分であり、「Grid Manual」は注文のグリッドを自動的に作成し、非常に閉じるまでそれに付随します。 完全な説明とデモバージョン ここ。 ユーティリティの主な機能と機能 ユーティリティは、モバイル端末から開かれた注文を含め、あらゆる方法で開かれた注文を処理します。 「制限」と「停止」の2種類のグリッドで機能します。 グリッド間隔の計算には、固定と動的(ATRインジケーターに基づく)の2つの方法で機能します。 オープンオーダーグリッドの設定を変更できます。 チャート上の各注文グリッドの損益分岐点を表示します。 各注文グリッドの利益率を表示します。 ワンクリックでグリッドから収益性の高い注文を閉じるこ
Footprint Chart Pro — Professional OrderFlow EA for MetaTrader 5 Version 6.34 | Professional tool for real traders | Institutional-Grade Visualization DEMO USERS - PLEASE SELECT EVERY TICK / REAL TICK WHEN TESTING AND YOU HAVE DOWNLOADED HISTORICAL DATA. IF YOU SEE A WAITING SCREEN AND IT IS NOT DOWNLOADING, IT MEANS YOU HAVE LOW HISTORICAL DATA. TRY 1 MIN AND 5 MIN FIRST ON 1 DAY DATA. ONE DAY DATA SHOULD BE THE NEWEST AND MOST CURRENT DATE. PLEASE WAIT UNTIL THE MARKET HAS ROLLED OVER PERIOD.
Copy your MT5 trades to Interactive Brokers You keep using MT5. Every order you open or close is sent to your IB account. In real time. No coding. No changes to your strategy or EA. Try it first Rent 1 month: $30. Test on a live or paper account. What it does Real-time copying: same direction, reverse, or one side only. Map any MT5 symbol to any IB symbol. Set a lot ratio for each. Forex, Futures, Stocks, CFDs, Metals and Crypto. Position sync: both accounts checked, any difference fixed. Optio
Trading Chaos Expert
Hennadii Stanilevych
5 (11)
This software has no equals in the world and represents a universal trade "console" covering trading signals, automated market entry, setting of Stop Loss and Take Profit, as well as Trailing Profit for multiple trades at the same time in a single open window. Intuitive control of the Expert Advisor in "three clicks" ensures a comprehensive use of all its functions on different computers, including tablets PCs. Interacting with additional signal indicators that mark the chart to give a real mark
Your EAs cannot see each other, but Anchor can. Anchor gives you one place to coordinate your EAs, manage risk, and decide when trading is allowed. It works alongside the trading bots you already use without any changes to them. The Problem One EA opens a trade. Then another starts trading. The next thing you know, you wake up to multiple grids built across your account. Each EA may be doing exactly what it was designed to do, but together they can place far more risk on your account than you in
Farmed Hedge Yield Farming | All Markets (Manual - Hybrid - Semi/Automated EA) VERIFIED TRADING RESULTS - Farmed Hedge Yield Axi Copy:  https://www.mql5.com/en/signals/2356376 - Farmed Hedge Yield Exn Copy:   https://www.mql5.com/en/signals/2356404 - Farmed Hedge Yield V Copy:  https://www.mql5.com/en/signals/2357156 IMPORTANT NOTICE: FarmedHedge is a MANUAL-FOCUSED TRADING UTILITY ,not a fully automated EA. Results shown on this Signal include manual trades and overall strategic management.
一度の購入で、現在提供中および今後リリースする私のすべての MT4・MT5 インジケーターを追加料金なしで受け取れます。 購入後、受け取り方法について私にお問い合わせください。 10 件の購入ごとに 50$ ずつ、最大 999$ まで値上げする予定です。購入手続き時に Market に表示される価格が適用されます。 信頼するインジケーターをそのままに。周辺の取引作業を自動化。 あなたのシグナル。あなたのルール。あなたの取引執行。 信頼する MT5 インジケーターはあるのに、チャートの監視、シグナル待ち、ロット計算、発注、各ポジションの管理を手作業で行っていませんか? Stratiora Signal Engine MT5 は、これらの作業をつなぎます。対応する買い・売りバッファのシグナルを、エントリー、取引量計算、Stop Loss、Take Profit、フィルター、ポジション管理、口座保護までの自動処理に変換できます。 インジケーターや取引アイデアを変えるたびに別の EA を依頼する代わりに、柔軟な一つのエンジンで各シグナルの取引方法を決められます。 あなたのシグナル。あなたのル
Trade Indicator Assistant   is a powerful MT5 utility designed to turn indicators into automated trading systems. Its main feature is the ability to automatically detect an indicator’s   BUY and SELL signal buffers , without requiring you to know the buffer numbers, search through indicator settings, or modify the indicator source code. Bonus Indicator:   After purchasing Trade Indicator Assistant, contact me to receive   Trade Signal Pro   completely free as a bonus indicator. [Download Demo V
EA Overfitter
Stephen J Martret
5 (1)
That backtest looks great. But will it still be making money tomorrow, next week, next month? EA Overfitter re-runs your EA on 100 price histories it has never seen. One score tells you if the edge is real. A backtest tells you what an EA did on one price history — the one that happened to occur. What you cannot tell from it is how much of that result was the strategy and how much was the particular path. EA Overfitter answers that. It builds up to 100 synthetic price histories your EA has n
Quant Panel
Kevin Craig E Gittins
QUANT PANEL Independent per-algo analytics, protected MT5 history and professional PDF reporting Quant Panel is built for traders who run several Expert Advisors or strategies on one MT5 account and need to know how each algo is actually performing. Instead of treating the terminal as one combined portfolio, Quant Panel groups closed positions by EA comment or magic number and calculates every strategy independently. It gives you one clear dashboard for comparing algos, finding weak systems and
YuClusters
Yury Kulikov
4.93 (43)
Attention: You can view the program operation in the free version  YuClusters DEMO .  YuClusters is a professional market analysis system. The trader has unique opportunities to analyze the flow of orders, trade volumes, price movements using various charts, profiles, indicators, and graphical objects. YuClusters operates on data based on Time&Sales or ticks information, depending on what is available in the quotes of a financial instrument. YuClusters allows you to build graphs by combining da
Premium Trade Manager - コーチ内蔵型トレードパネル Premium Trade Manager は、AIトレーディングコーチをあなたのチャートの中に置き、その下に完全な執行エンジンを備えたツールです。いつも通りにトレードをセットアップし、あなた専任のAIトレーディングコーチ Max にそのセットアップをそのまま読み取らせて、発注前に率直な見解を伝えてもらいましょう。ストップの幅が規律あるアプローチに合っているか、リスクサイズは適切か、高影響のニュースイベントが数分後に迫っていないか、プロップファームの制限に近づいていないか。その下には、クリックの後をすべて処理するエンジンが備わっています。ワンクリックのリスクサイズ計算による発注、チャート上でドラッグして組み立て、発注後も動かせるプラン、最大4段階の分割利確、7種類のトレール方式、リアルタイムのプロップファームコンプライアンス、ニュースガード、そしてコストを自ら採点するスプレッド機能。判断はあなたが下す。Max がもう一度確認する。後のことはすべてパネルが担う。 購入前に実際に触れて試せます。 ブラウザ上でライブ
Daily Trading Limiter
AL MOOSAWI ABDULLAH JAFFER BAQER
5 (8)
• Please test the product in the Strategy Tester before purchasing to understand how it works. • If you face any issues, contact me via private message—I’m always available to help. • After purchase, send me a screenshot of your order to receive a FREE EA as a gift. Daily Trading Limiter — the rule you cannot break Every trader knows the number. Three trades. Two percent. One bad day and stop. And every trader has watched themselves take the fourth trade anyway. The problem was never knowing th
Take a Break pauses your Expert Advisors when trading is a bad idea: before news, after a daily loss, outside your trading hours, or when a rule you wrote yourself says so. When the pause is over, your EAs simply continue. Account protection for all your EAs in one tool: news filter, drawdown and equity protection, time filter and custom rules. One EA on one chart protects the whole account, the free indicator gives every chart its own rules on top. Free demo | What is new in 26.09 | Support Ass
FUTURES ORDERFLOW FOOTPRINT CHART Professional OrderFlow EA for MetaTrader 5 Version 1.01| Professional tool for real traders | Institutional-Grade Visualization STRATEGY TESTER USERS - PLEASE SELECT EVERY REAL TICK WHEN TESTING AND YOU HAVE DOWNLOADED HISTORICAL DATA. IF YOU SEE A WAITING SCREEN AND IT IS NOT DOWNLOADING, IT MEANS YOU HAVE LOW HISTORICAL DATA. TRY 1 MIN AND 5 MIN FIRST ON 1 DAY DATA. ONE DAY DATA SHOULD BE THE NEWEST AND MOST CURRENT DATE. PLEASE WAIT UNTIL THE MARKET HAS ROL
The product will copy all telegram signal to MT5 ( which you are member) , also it can work as remote copier.  Easy to set up, copy order instant, can work with almost signal formats, image signal,  s upport to translate other language to English Work with all type of channel or group, even channel have "Restrict Saving Content", work with  multi channel, multi MT5 Work as remote copier: with signal have ticket number, it will copy exactly via ticket number. Support to backtest signal. How to s
EASY Insight AIO – スマートで手間いらずな取引のオールインワンソリューション 概要 数秒で市場全体——FX、ゴールド、暗号資産、指数、さらには株式まで——を、手作業のチャート確認や複雑なセットアップ・インジケーター導入なしにスキャンできたらどうでしょうか? EASY Insight AIO はAIトレードのための究極のプラグ&プレイ型エクスポートツールです。市場全体のスナップショットを、クリーンなCSVファイルで一括出力。ChatGPT、Claude、Gemini、Perplexityなど、さまざまなAIプラットフォームで即座に解析できます。 ウィンドウの切り替えやグラフのごちゃごちゃしたオーバーレイはもう不要。自動エクスポートされる純粋で構造化されたインサイトだけで、無駄なチャート監視に悩まされず、スマートなデータ主導の判断に集中できます。 なぜEASY Insight AIOなのか? 本当のオールインワン • セットアップ不要、インジケーターのインストール不要、チャートへのオーバーレイ不要。インストールして起動し、エクスポートするだけです。 マルチアセット対
Timeless Charts
Samuel Manoel De Souza
5 (8)
Timeless Charts is an all-in-one trading utility for professional traders. It combines custom chart types such as Seconds Charts and Renko with advanced order flow analysis using Footprints , Clusters , Volume Profiles , VWAP studies, and anchored analysis tools for deeper market insight. Trading and position management are handled directly from the chart through an integrated trade management panel , while Market Replay and Virtual Accounts provide environments for practicing trading skills and
One button. One trade. MT5 Trading Deck is a hotkey trading panel for MetaTrader 5 that turns the platform into a keyboard-driven execution cockpit. Stop loss, take profit and lot size are pre-calculated for every key; the moment you press, a market order is live on the broker. A complete technical user manual is attached in the product Comments section. It documents every input parameter, the full hotkey map, the recommended Stream Deck XL layout, and the advanced workflows for Pre-Limit orders
VirtualTradePad PRO SE MT5 — MetaTrader 5向けプロフェッショナル取引コントロールセンター VirtualTradePad PRO SE は、 MetaTrader 5 向けのプレミアムなチャートベースの取引パネルであり、トレード管理ワークスペースです。より速い執行、明確なポジション管理、構造化されたトレード管理、視覚的なレベル計画、そしてチャート上で完結するプロフェッショナルなワークフローを求めるトレーダー向けに設計されています。 これは単なる BUY / SELL パネルではありません。PRO SE は、手動取引、予約注文、ポジション管理、部分決済、バスケット損益管理、平均化レベル、ATMルール、シグナル監視、リアルタイム市場情報、ストラテジーテスター (Strategy Tester) ワークフロー、VPS向け運用を、1つの連携されたインターフェースに統合します。 MT4版 | 完全な説明とスクリーンショット | 購入方法 | インストール方法 | ログファイルの取得方法 | テストと最適化の方法 | Expforex のすべての製品 PRO
Custom Timeframe Manager Pro: MetaTrader 5 で無制限のタイムフレームを ターミナルの標準設定では、価格変動の重要な詳細が隠れてしまうことがよくあります。分析をクラシックな期間のみに制限すると、トレーダーはトレンドの発生の瞬間や真のボラティリティレベルを見逃すリスクがあります。 Custom Timeframe Manager Pro は、MetaTrader 5 の限界を広げるプロフェッショナルなユーティリティです。分数やエキゾチックな期間を含む、あらゆるカスタム期間を作成し、ターミナルのネイティブチャートと同じように操作できます。 利用可能な期間タイプ: 秒足 :任意の数値(例:S1, S5, S15, S30)。 分数足 :分析を微調整するための非標準インターバル(例:M1.5, H1.5, D1.2)。 カスタム :戦略的分析のための多日、多週の拡大期間。 メリット: 本格的なチャート :作成された期間はMT5のネイティブチャートとして機能し、あらゆるインジケーター、オシレーター、テンプレート、EAを適用できます。これは「オーバーレイ」
EA Slipstream
Stephen J Martret
5 (1)
Your backtest filled every order at the price it asked for. Your account does not. EA Slipstream measures what execution costs your EA, using your own fills, slippages and spreads to show you the true performance of your EA. A backtest prices every trade at the level the EA named. In live trading a pending order fills at whatever price is available when it triggers, a stop closes wherever the market is when it is hit, and the spread at that moment is whatever the account was quoting. The differ
フィルタ:
レビューなし
レビューに返信