Entry Price Averages
- インディケータ
- バージョン: 2.60
- アップデート済み: 5 11月 2025
- アクティベーション: 5
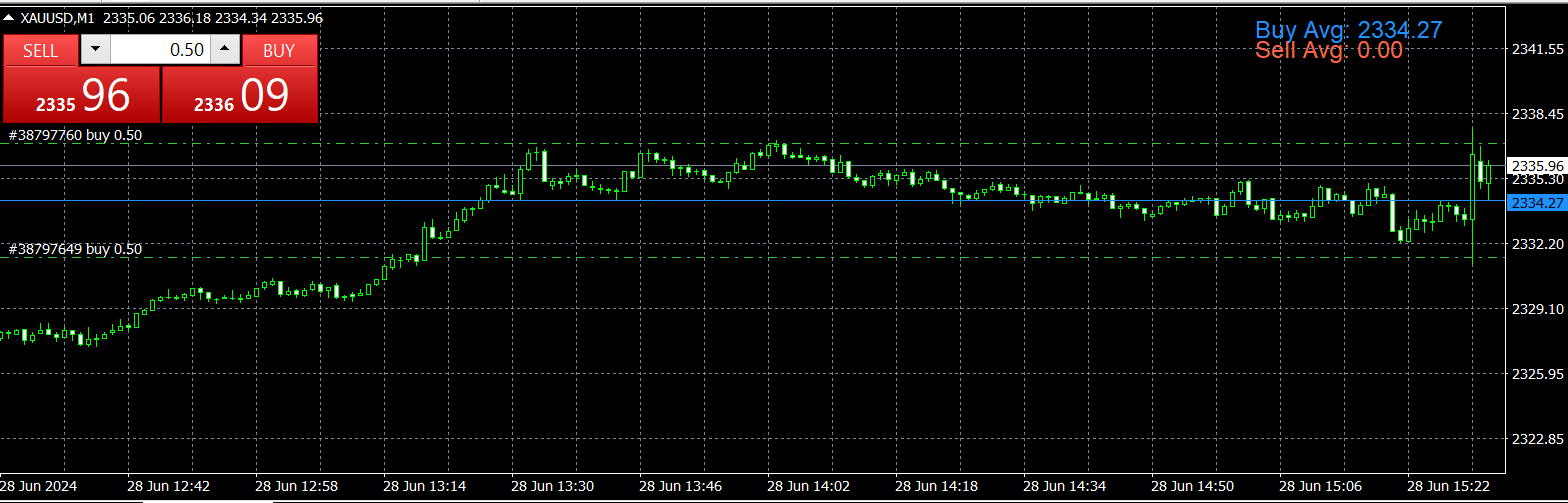
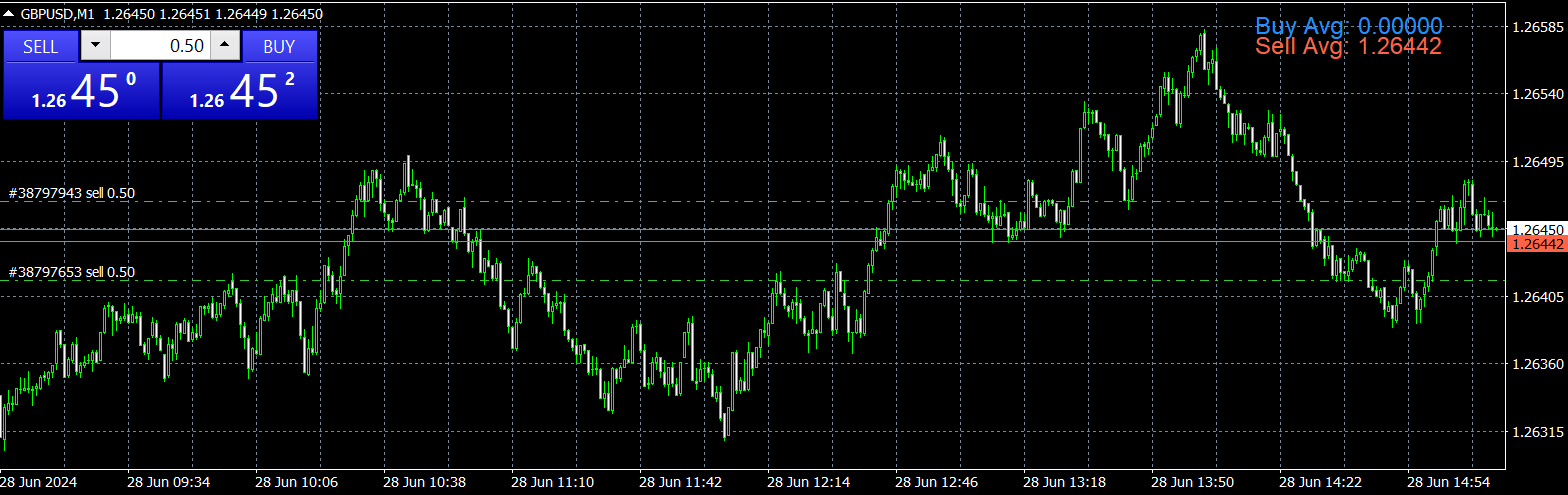
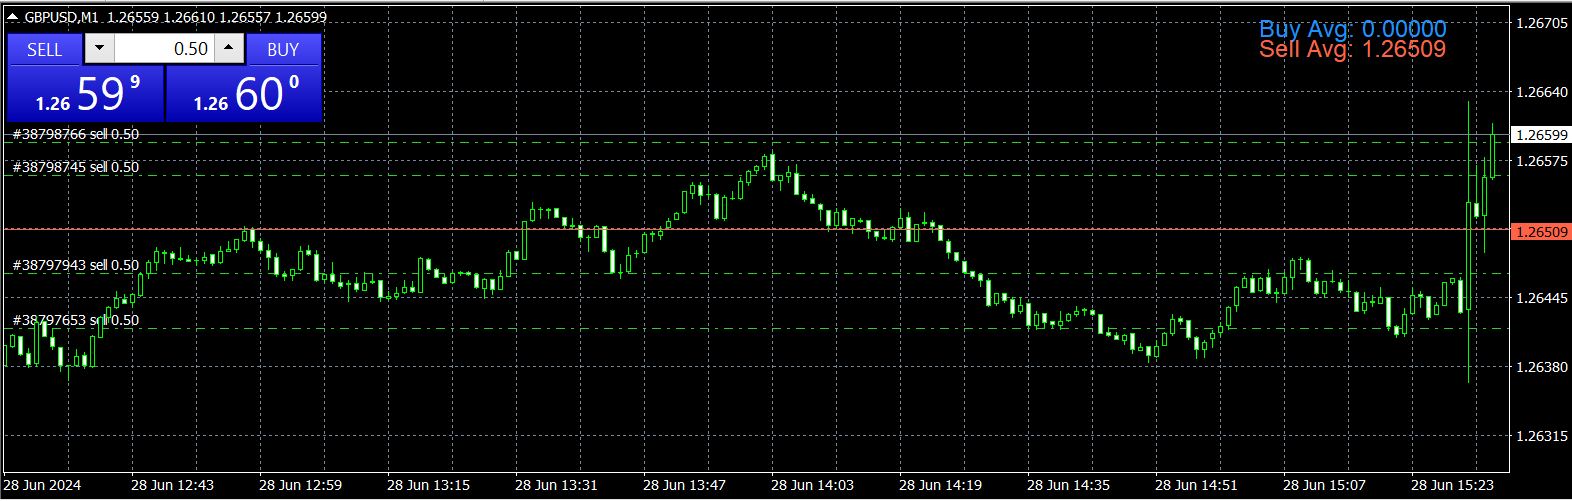
平均エントリーポジションインジケーター (The Average Entry Positions Indicator)
平均エントリーポジションインジケーターは、トレーダーに対し、チャート上での平均的な買いと売りのエントリー価格を視覚的に明確に表示します。この強力なツールは、重要なトレード管理情報を計算・表示するようになり、より良い意思決定と効率的なポジション追跡を支援します。
このツールを使用することで、トレーダーは自分の全体的なエントリーポジションを一目で素早く評価できます。
ユーザーへの注意点 — あなたに適したツールを選択してください:
* 視覚的な平均価格表示のみが必要な場合は、この製品をご利用ください(すでにチャート上にエキスパートがいる場合)。
* インタラクティブなコントロールとチャートから直接注文を管理/決済する機能が必要な場合は、**「Entry Price Averages EA with Close Orders」**をご利用ください。
Mt5:
* EA (Expert Advisor): Entry Price Averages EA with Close Orders MT5
* インジケーター (Indicator): Entry Price Averages MT5
🔑 主な機能:
* 平均エントリー価格ライン: 平均的な買いと売りのエントリー価格を、チャート上に水平線として直接表示します。
* リアルタイム損益 (P/L): パネルは現在、平均エントリー価格とともに、現在のリアルタイムでの実行中のP/Lを計算・表示します。
* 外観のカスタマイズ: 色、ラインスタイル、フォントサイズを完全に制御できます。
* 動的な配置: チャートの四隅のいずれかからの簡単な X/Yオフセットを使用して、パネルの位置を簡単に調整できます。
* シームレスな統合: トレーディング戦略を妨げることなく、ポジションの追跡を強化します。
⚙️ 入力項目の説明:
以下の設定を使用して、インジケーターの外観とレイアウトをカスタマイズします。
| 入力名 | 説明 |
|---|---|
| buyAvgPriceLineColor | 買いの平均価格水平線の色。 |
| sellAvgPriceLineColor | 売りの平均価格水平線の色。 |
| ShowLabels | テキストパネルの可視性を切り替えます(True/False)。 |
| ShowLines | チャート上の平均価格ラインの可視性を切り替えます。 |
| CornerSelection | パネルのチャートの角を選択します(左上 TopLeft、右上 TopRight、左下 BottomLeft、右下 BottomRight)。 |
| LineStyle | 平均価格ラインの視覚的なスタイルを選択します(実線 Solid、破線 Dash、点線 Dot など)。 |
| EnablePLDisplay | ラベルに損益 (Profit/Loss) の値を表示/非表示します。 |
| labelFontSize | すべてのパネルテキストのフォントサイズ。 |
| labelTextColor | ラベルの静的な部分のテキストの色。 |
| avgPriceLabelXDistance | チャート端からの水平オフセット(ピクセル単位の距離)。 |
| avgPriceLabelYDistance | チャート端からの垂直オフセット(ピクセル単位の距離)。 |
| labelValueXOffset | 「平均価格(Avg Price)」テキストと「P/L」テキストの間の水平距離。 |
| labelSpacingY | 買い行と売り行の間の垂直間隔。 |
🌟 バージョン 2.60 の新機能:
* P/L機能の追加: インジケーターは、オープンポジションのリアルタイム損益を計算・表示するようになりました。
* 新しい入力項目: 価格とP/Lラベル間の水平間隔を正確に制御するための labelValueXOffset が追加されました。