OnBalance Indicator with MA lines

オンバランス・ボリューム(OBV)は、出来高と価格を関連付け、値動きを識別するテクニカル指標です。OBVの基本的な考え方は、出来高の変化は一般に価格の変化に先行するというものである。OBVは、価格が高値で引けた期間の出来高を累積し、安値で引けた期間の 出来高を減算する。こ の 結 果 、資 産 の ト レ ン ド の 方 向 を 示 す 数 値 が 得 ら れ る 。

OBVの解釈は簡単です。OBVの上昇は、買い手が市場に参入または留まろうとしていることを示唆し、上昇トレンドのシグナルとなります。一方、OBVが低下している場合は、売り手が優勢であることを示し、下降トレンドの可能性を示唆します。

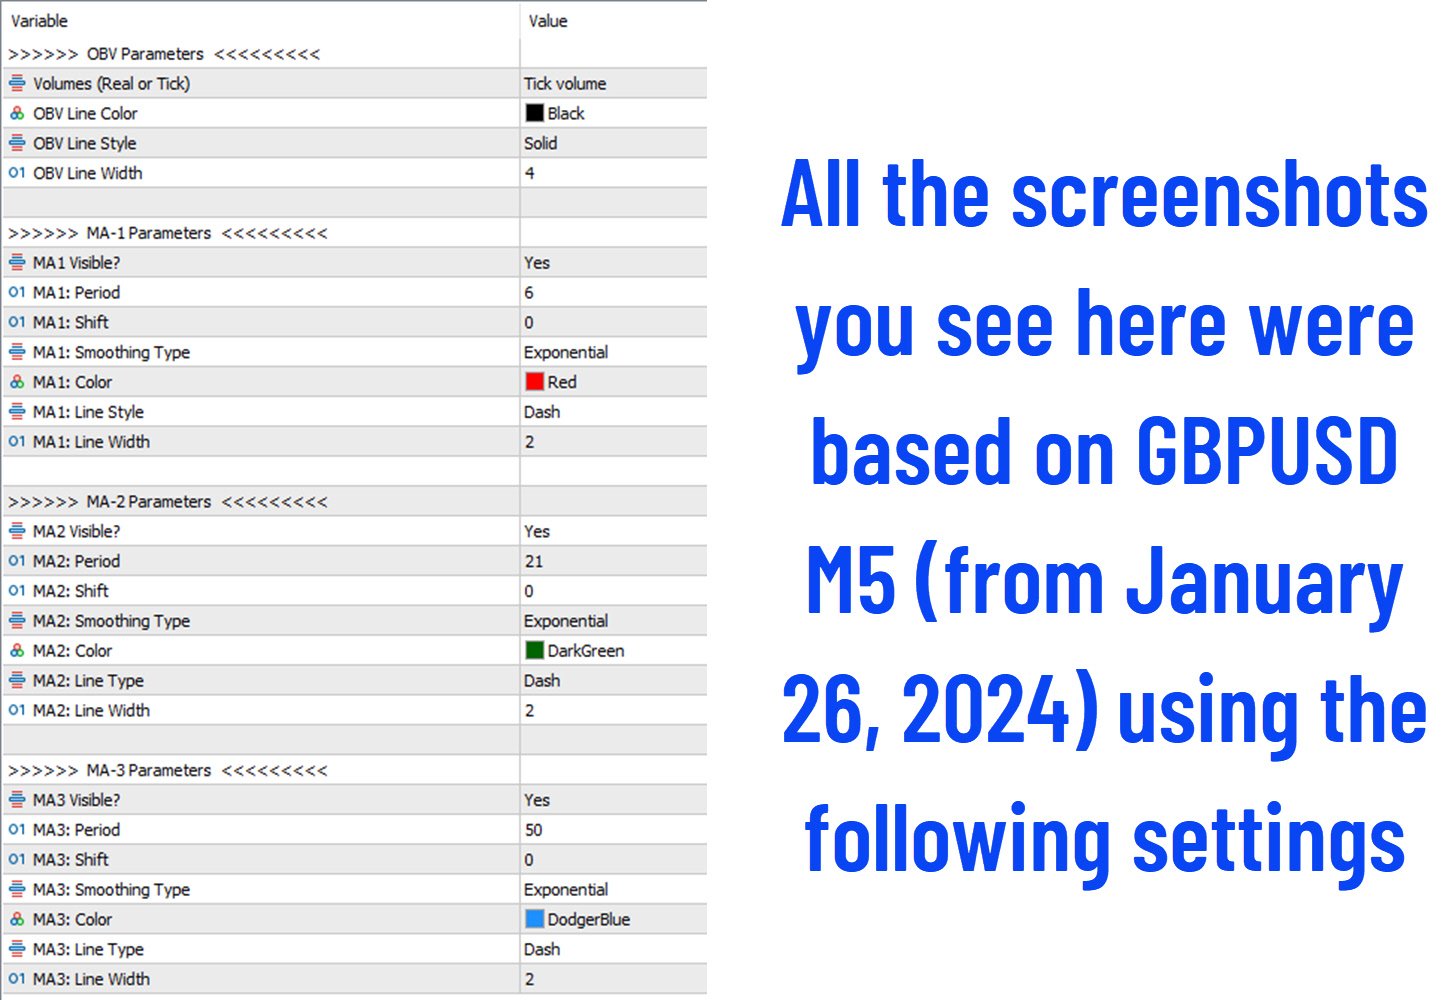
現在、シグナルに最大3つの移動平均を使用することができ、取引判断プロセスを簡素化することができます。OBVがMAラインと交差していることと、その間の距離を観察するだけです。これがOBV-MAの目的です!

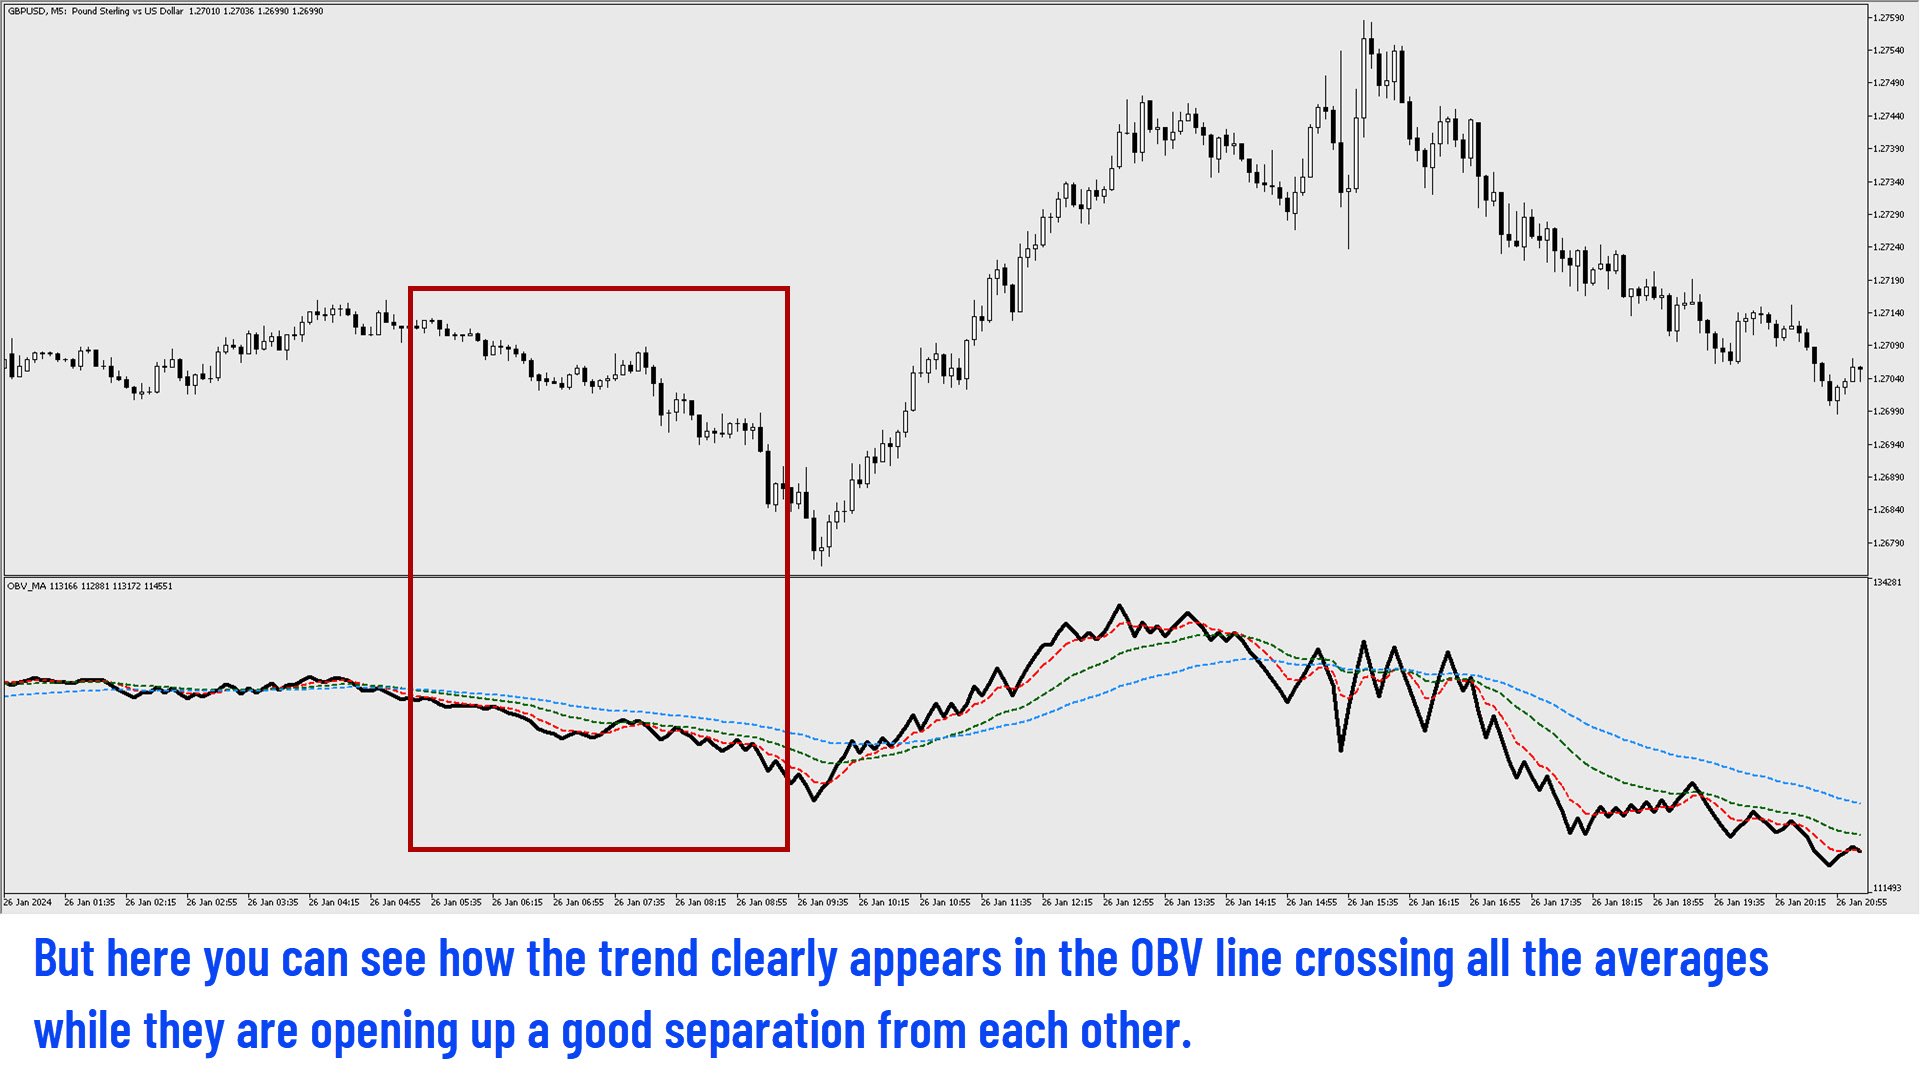
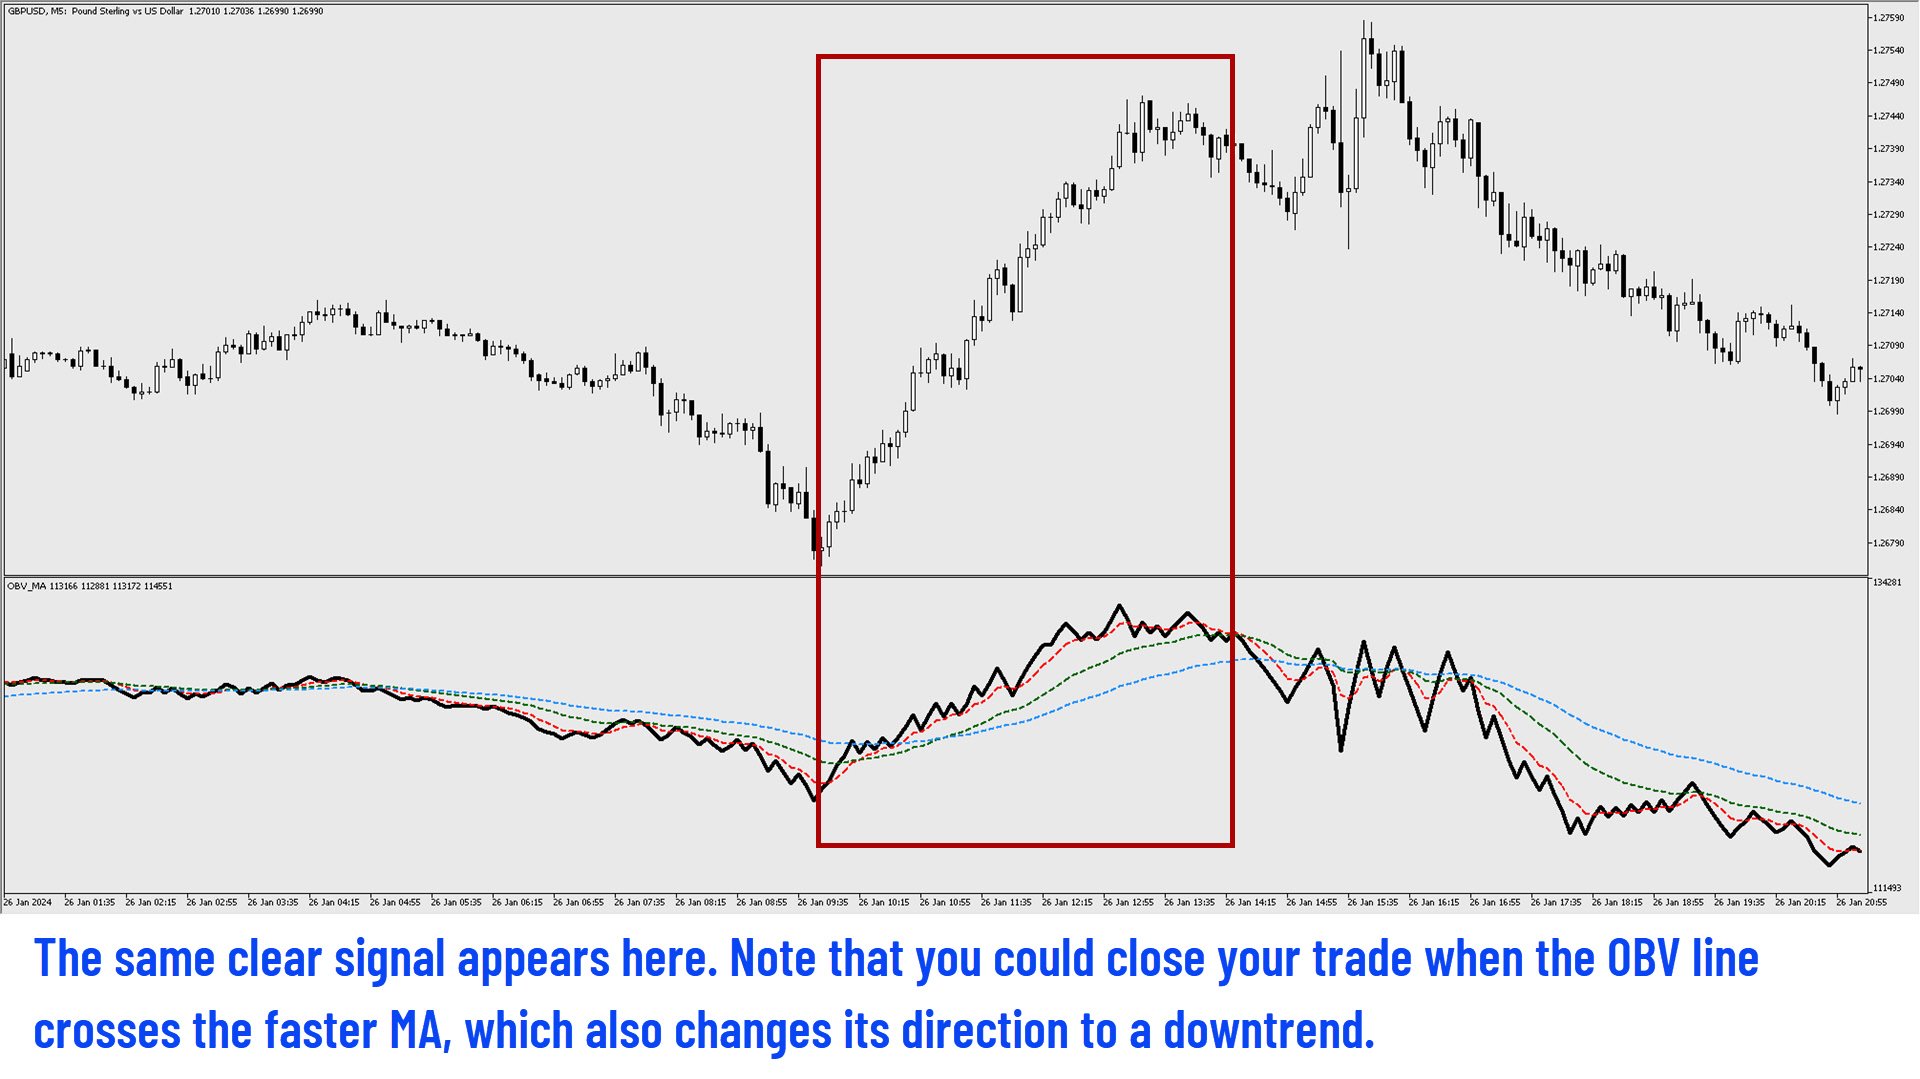
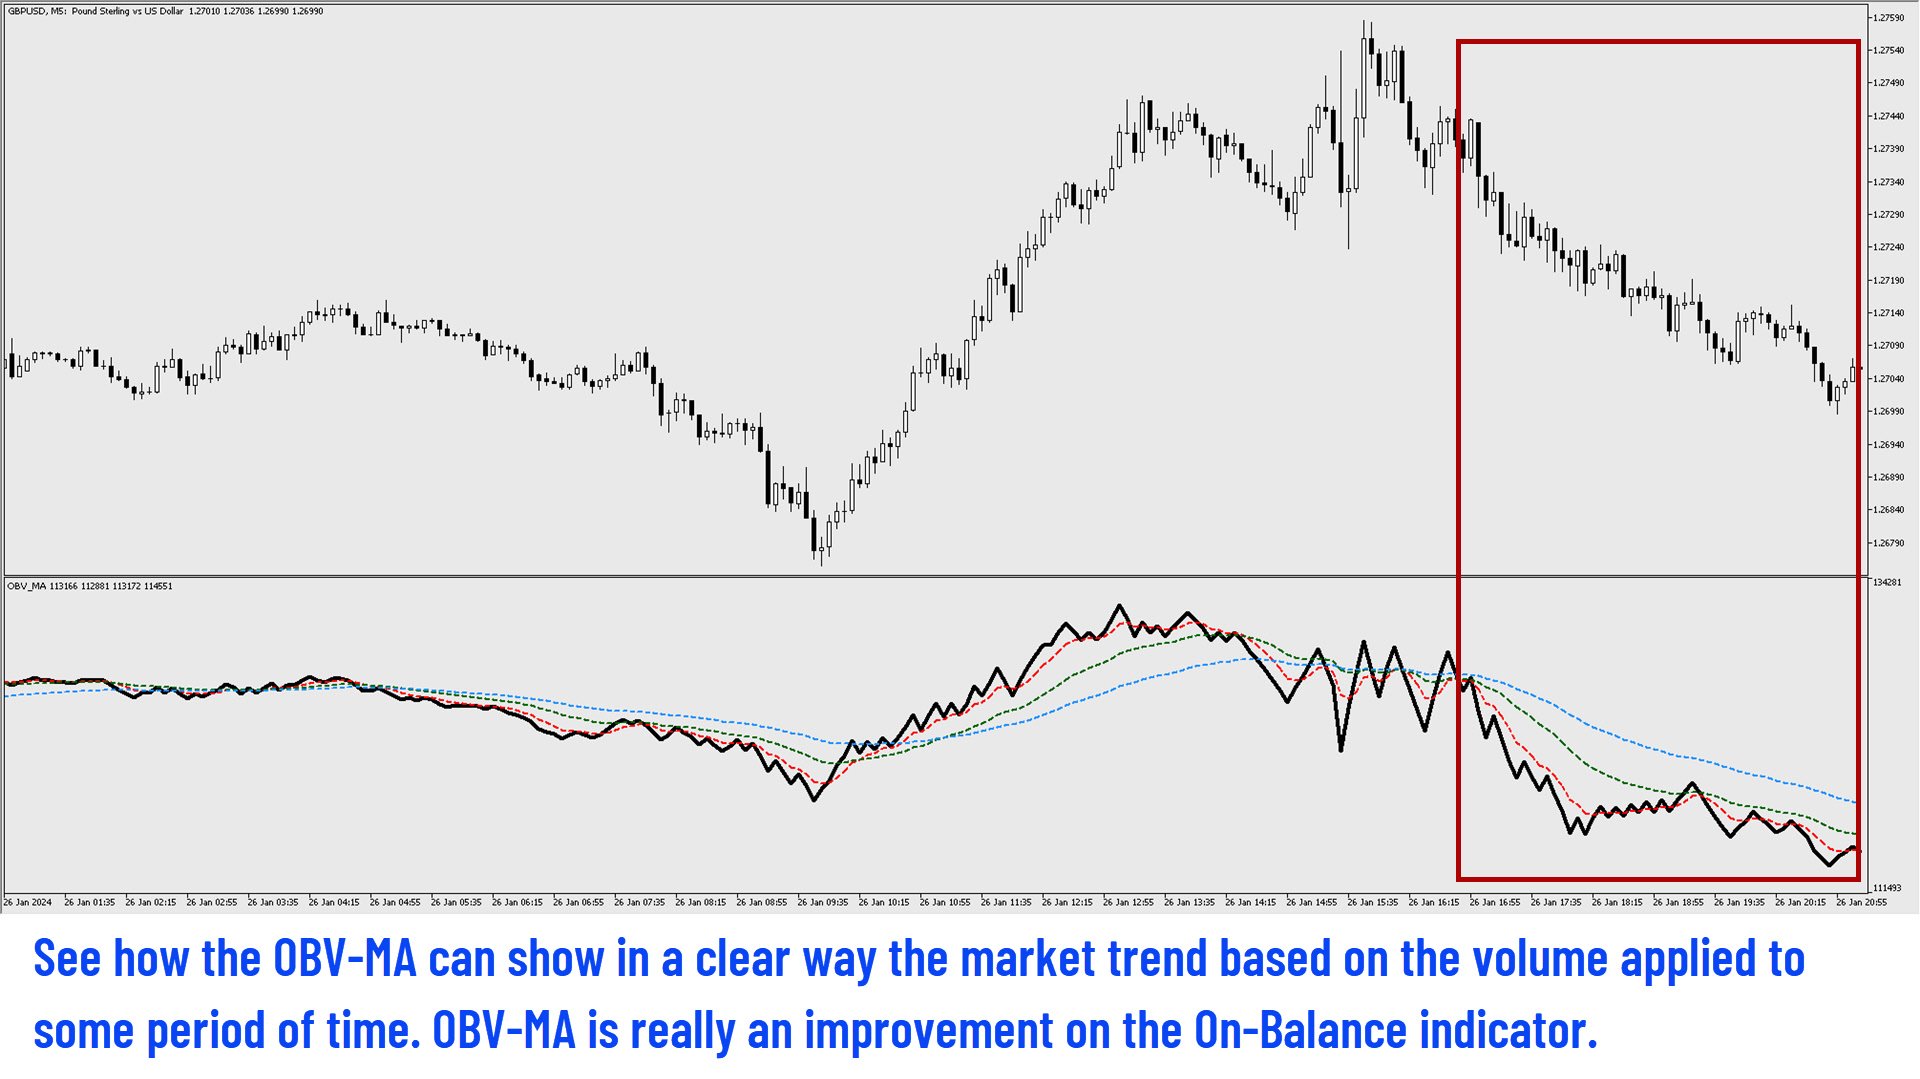
OBV線がMA線と交差し、MA線とOBV線が大きく離れている場合、上昇トレンドまたは下降トレンドの強い兆候を示します。もう一つの良いトレンドシグナルは、すべての線(OBV線とMA線)が同じ方向にあり、MA線が互いに良い間隔を保っているときです。たとえOBVがより速い平均を超えたとしても、その方向には有効なシグナルがあります。

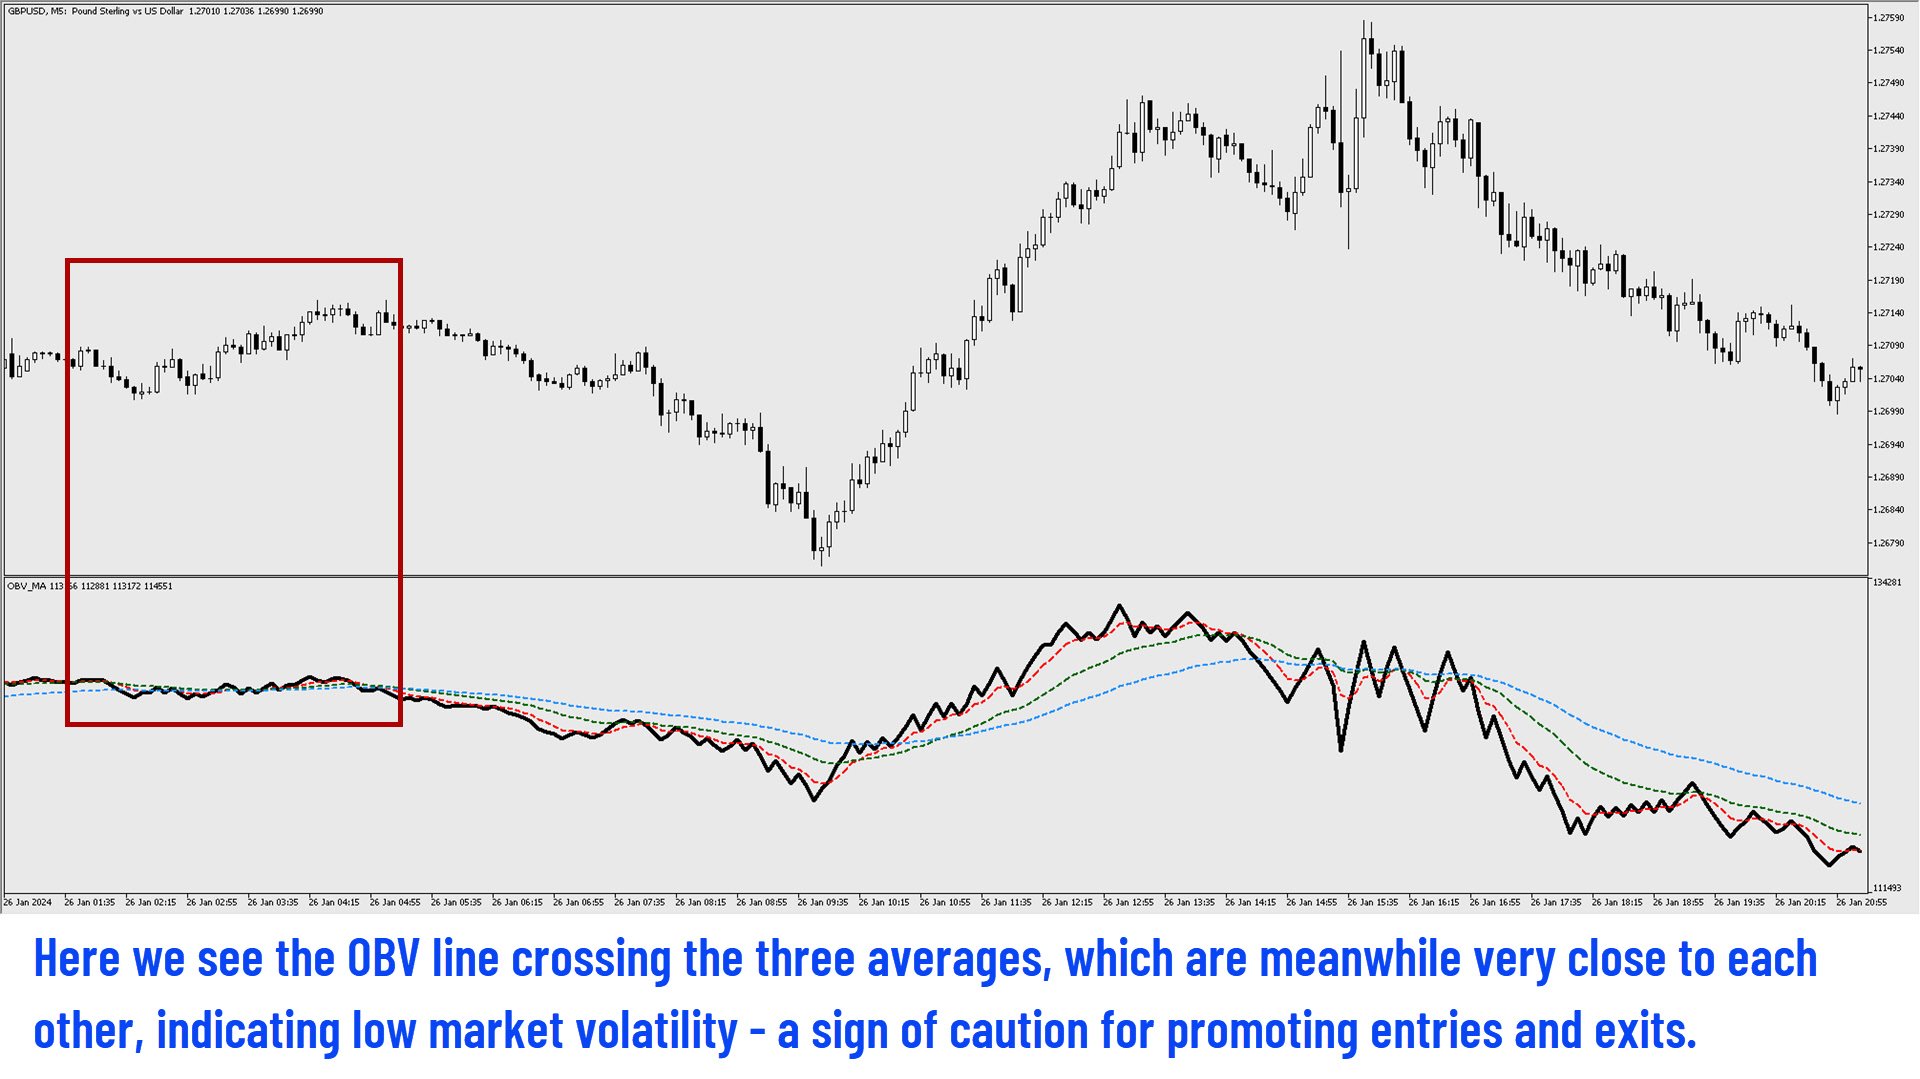
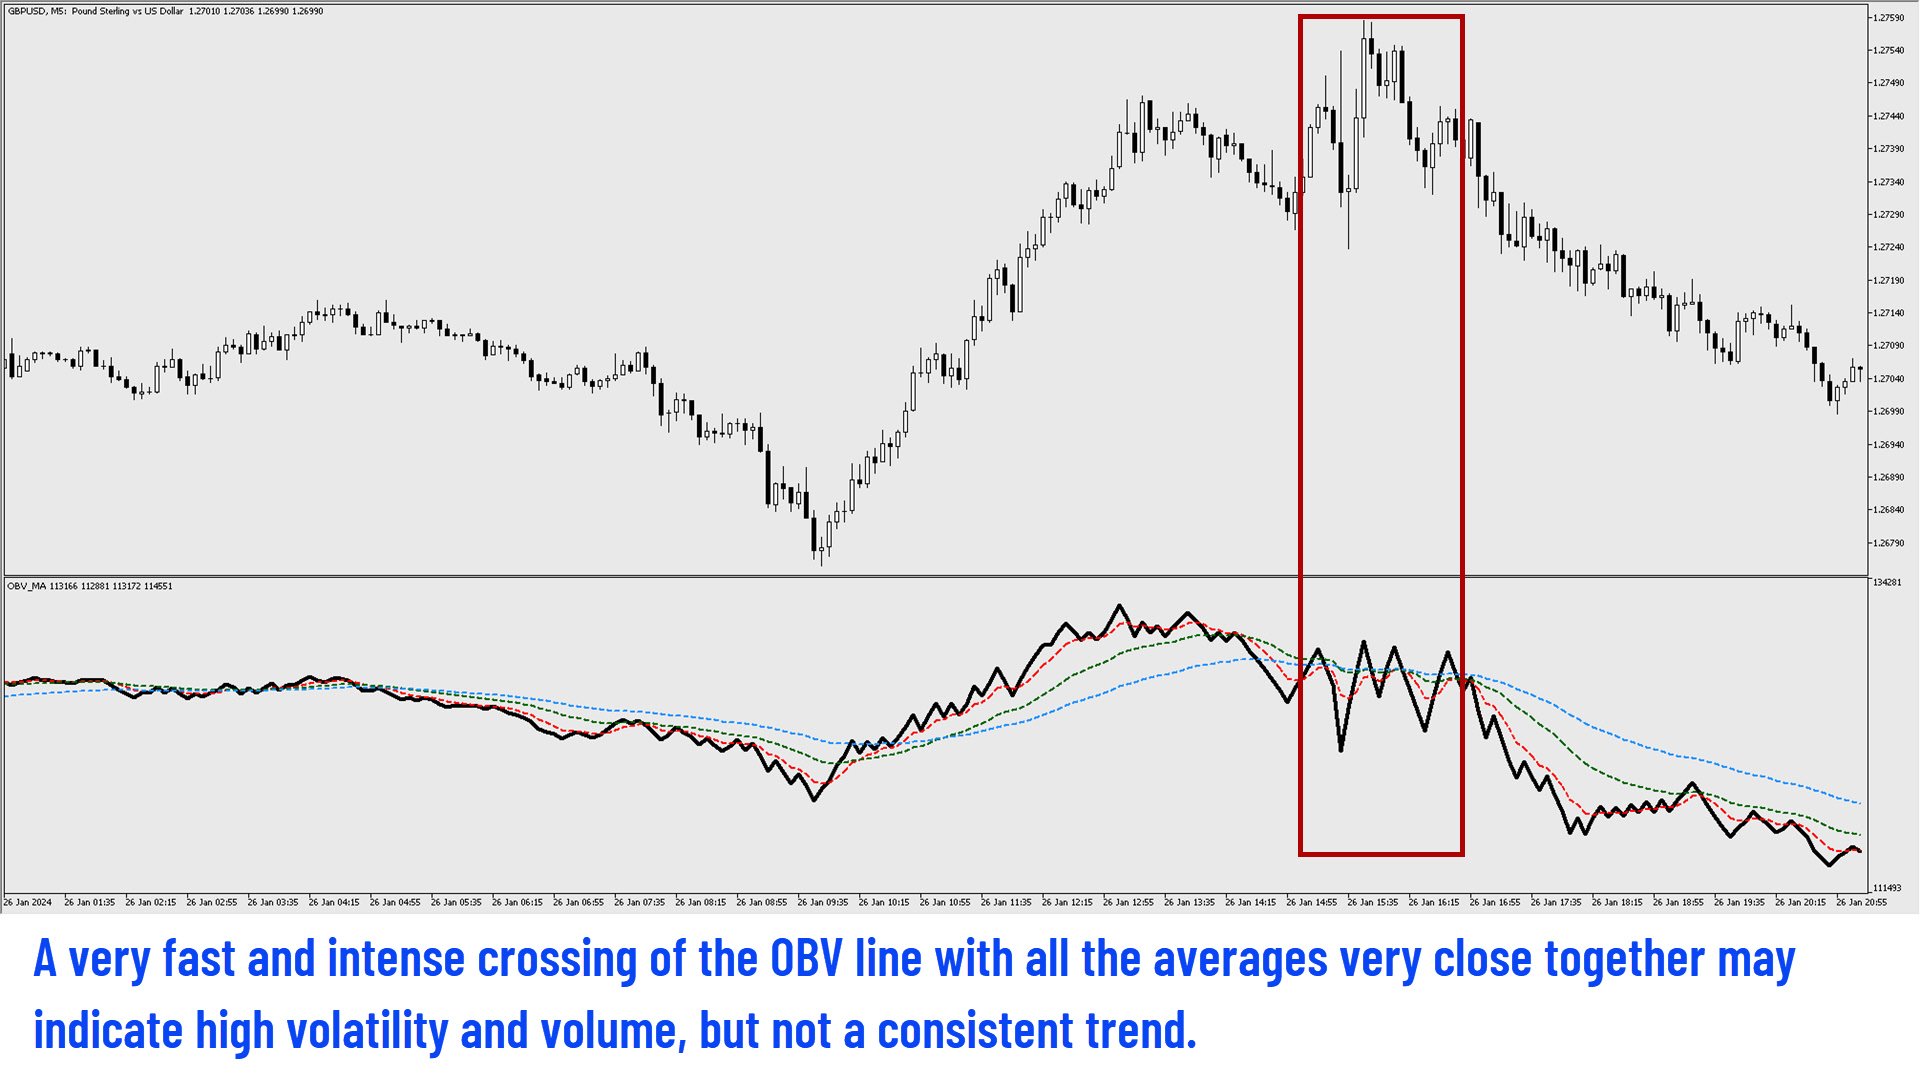
一方、すべてのMA線が密接に並んでいて、OBV線がジグザグに交差している場合、これは中立シグナルを示し、注意を促し、即座のエントリーやエグジットの決断を思いとどまらせます。

OBV-MAは、テクニカルシグナルに基づく現在の戦略をサポートする良い指標です。

おすすめのプロダクト
PRO BREAK POINT Indicator It helps traders identify Breakout points , analyze market trends , and find precise entry and exit opportunities. The indicator automatically provides: Entry Points (Buy/Sell) Take Profit levels (TP1 / TP2 / TP3) Stop Loss (SL) Support & Resistance zones Real-time Trend and Momentum analysis Perfect for both beginners and professional traders . Main Components 1. Breakout Zone Highlights the zone where the price breaks out of support or resistance.
Indicador Para Opções Binarias. Indicator for Binary Options Usa dois gales. Instalar em mt5 Esse indicador é para ser usado no tempo de vela de 5 minutos e em M5. Este também funciona em M1, porém é mais eficiente em M5. Só descompactar e copiar os arquivos na pasta de dados do seu MT5. Arquivos indicator na pasta MQL5 - Indicator. Baixe também a Media Movel totalmente gratis: https://www.mql5.com/pt/market/product/50400 Esse Indicador é para a próxima vela. Apareceu a seta, só aguardar a próx
Linha de Variacao de Preco
Renato Fabio Santos Vasconcelos
ENGLISH VERSION PRICE VARIATION LINE – TAKE CONTROL OF THE MARKET! Turn the opening price into your strategic weapon Clearly see how many points or % the market moved Auto horizontal lines at the levels YOU define Mark entry, exit, target zones and explosive regions Clean, sharp, and professional layout Simple, powerful, and essential for any serious trader
Oscilador bem próximo que o indicador SANTO mostrado pelo Bo Williams em sua metodologia PhiCube, para mim este indicador ainda é melhor que o próprio SANTO original. Ótimo para entender a força e tendência de movimentos e possíveis divergências. Preço fazendo topo e o SANTO não renovando máxima, tudo indica que teremos uma reversão ou no mínimo um drawback.
Keltner Channels (ou   Canais de Keltner ) é mais um indicador de   volatilidade   utilizado pela   análise técnica. Também chamado de   envelope , esse canal foi criado por Chester Keltner para monitorar os seus investimentos no mercado futuro de café na década de 1960. Porém, com o passar do tempo, passou também a ser utilizado para outros ativos e, atualmente, é uma das ferramentas mais utilizadas pelos traders. Nesta versão customizada foram adicionados novas opções de método de média movel
Entry and exit signals from the Double 7's Strategy by Larry Connors in his book "Short Term Trading Strategies That Work". Larry claims this strategy predicted the market's direction over 80% of the time since 1995. Picking up the gains and being exposed in the market less than 25% of the time. Good for swing trading on Daily charts of SPY, Nasdaq, China's FXI, Brazil's EWZ and the majority of the equity ETFs and World Indices. How does it work? The indicator activates the buy signal when we
Send me a message so I can send you the setfile 複数の構成が可能な堅牢なロボット 以下のスクリーンショットの設定を使用して、10 分間の時間枠で BTC を使用します。 エキスパート ロボットを購入すると、ボットを継続的に改善するために変更を要求する権利があります。 主な特徴 移動平均クロスオーバー戦略: EA は 2 つの移動平均 (MA1 と MA2) を使用して取引シグナルを生成します。 より速い MA (MA1) がより遅い MA (MA2) より上または下にクロスオーバーすると、取引がトリガーされます。 マーチンゲール戦略: 取引で損失が発生した場合、次の取引のロット サイズは乗数 (martingaleMultiplier) によって増加されます。 マーチンゲール シーケンスは、トレードが成功した後、またはマーチンゲール ステップの最大数 (maxMartingale) に達したときにリセットされます。 リスク管理: ストップロス(SL)とテイクプロフィット(TP)のレベルは設定可能です。 利益を確定し
The indicator ‘Probability Range Bands’ gives a prediction of the amount, how much the asset is moving from its current price. The range bands give probabilities, that the candle close will not exceed this certain price level. It is also called the expected move for the current candle close.   This Indicator is based on statistical methods, probabilities and volatility. Asset price is assumed to follow a log-normal distribution. Therefore, log returns are used in this indicator to determine the
Projection of Phi   Is a technical indicator that calculates dynamic support and resistance levels. It uses angular geometric projections and mathematical ratios to identify market expansion ranges. Features: Dynamic Fibonacci Expansion: Extension level projection Geometric Calculation: Angular analysis and mathematical ratios Visualization: Graphical objects with informative labels Compatibility: M1 to H4 timeframes Applications: Identification of zones for trade management Analysis of volatil
Heiken Ashi Suavizado
Juan Manuel Rojas Perez
5 (1)
El **Heiken Ashi Smoothed** es una versión suavizada del indicador técnico Heiken Ashi, que se utiliza en el análisis de gráficos de velas para identificar tendencias del mercado y pronosticar movimientos de precios. Este indicador se basa en el promedio de datos de precios para formar un gráfico de velas que ayuda a los traders a filtrar el ruido del mercado. **¿Para qué sirve?** Este indicador se utiliza para identificar cuándo los traders deben permanecer en una operación y cuándo está por
FREE
A SmartTrendMA foi projetada para identificar melhor zonas de alta, baixa e consolidação, azul alta, vermelho baixa e branco consolidação, vai te auxiliar a identificar melhor a tendência. Em parâmetro regule melhor conforme sua preferência em grau pois cada par de moeda se adequa diferentemente a cor,mude também o período e se quiser mude exponencial ou simples. 
# SSL ST Strategy MT5 Indicator - Japanese Version SSL ST Strategy MT5インジケータは、トレーダーが取引チャート上で買いシグナルと売りシグナルを明確に特定するのを支援するために設計されたテクニカル分析ツールです。直線と矢印などの視覚的インジケータと、音声、ポップアップ、およびプッシュ通知を提供し、取引機会が生じたときにトレーダーに即座に警告します。 ## 主な利点 - 色付きの直線(SSL1およびベースライン)と買いシグナル(緑の三角形)および売りシグナル(赤の三角形)の矢印を使用して、チャート上に直接明確な視覚シグナルを提供します。 - 音声アラート、ポップアップアラート、およびモバイルプッシュ通知をサポートし、トレーダーが画面から離れていても重要なシグナルを見逃さないようにします。 - シグナルロジックの反転を許可し、異なる取引戦略または市場条件に適応できます。 - 高値、安値、終値に基づいた指数移動平均線(EMA)を使用して、より反応性が高く滑らかなシグナル生成を実現します。 - 同じシグナルバーの重複ア
Moving pivot Average Fibonacci The  indicator compares the selected period with its counterpart from the previous period. The indicator determines the moving Fibonacci levels for the day or any time interval to assess the price movement range from the time average. The indicator helps predict the expected high or low for the day based on historical time data. The pivot line can be considered an average trend line and use it in a variety of trading strategies. If you have any question about the
# Multi-Timeframe Trend Sync Pro (MTTS Pro) ## Synchronize Multiple Timeframes and Trade with Trend Confluence **MTTS Pro** is an advanced technical indicator developed for traders seeking precision in multi-timeframe analysis. By consolidating information from multiple timeframes simultaneously, the indicator identifies points of high confluence where multiple timeframes confirm the same market direction. --- ## MAIN FEATURES ### **Simultaneous Multi-Timeframe Analysis** - Monitor up t
My Pivot is an Indicator based on Pivot Lines and Support-Resistance zones. This Indicator will Plot 11 SR zones including Pivot Line which will definitely help you to understand the exact SR zones of the Market. Steps to Setup the Indicator: Install the Custom Indicator; Set all the Lines Color, Width and Styles; Set visualization to All Timeframe; and DONE It can be used for: All Pairs: Forex, Cryptocurrencies, Metals, Stocks, Indices.  All Timeframe All Brokers All type of Trading S
RiskGuard PRO – Defesa Inteligente para Traders Sérios no EURJPY M15 O RiskGuard PRO é um Expert Advisor de alto desempenho, projetado exclusivamente para o par EURJPY no timeframe M15 , com foco total em preservação de capital, gestão de risco avançada e execução estratégica de múltiplas abordagens operacionais . Ao contrário dos EAs tradicionais, o RiskGuard PRO foi desenvolvido com tecnologia proprietária e arquitetura inteligente , capaz de operar com segurança mesmo em ambientes de merc
Cybertrade Auto Fibonacci retraction and projection  - MT5 Auto Fibonacci is an indicator that automatically plots the Fibonacci retracement and projection based on the number of bars you select in the indicator setting. You can customize nine different levels of retraction and three levels of projection. It works on periods longer than the period visible on the chart. All values ​​are available in the form of buffers to simplify possible automations. This indicator is the same one we use in ou
FREE
Signal Eskiya, in addition to channel lines, reflects entry signals in the form of arrows. Trading strategies using the channel indicator belong to the classic methods of technical analysis, are easy to execute, and therefore available even to beginners. Price ranges work equally well on any trading assets and timeframes, they can be used both independently and with additional confirmation from oscillators and market volumes. American traders say: “Trend is your friend”, which means “Trend is
Gold Trend Swing
Luis Ruben Rivera Galvez
5 (1)
Send me a message so I can send you the setfile 導入費用は498ドル。1298ドルに達するまで毎月100ドルずつ増加します。 XAUUSD (GOLD) の自動取引ボット。 このボットを XAUUSD (GOLD) H1 チャートに接続し、実証済みの戦略で自動的に取引しましょう。シンプルでありながら効率的な自動化を求めるトレーダー向けに設計されたこのボットは、低~中程度のスプレッドに最適化され、テクニカル指標と価格アクションの組み合わせに基づいて取引を実行します。 ボットはどのように機能しますか? 推奨される時間枠: 信号精度のバランスとノイズの低減を実現する H1 (1 時間)。 主要資産: XAUUSD (ゴールド)、明確なチャンスがある非常に変動の激しい市場。 エントリーとエグジット: ボットは価格パターン、主要レベル、モメンタム確認を分析して取引を開始/終了します。 組み込みのリスク管理: ポジション サイズを自動調整し、動的なストップロス保護を使用します。 簡単セットアップ – すぐに使用可能 推奨ロットサイズ
BBVectorDynamics_Robot is an innovative trading advisor specifically designed for volatile markets. Based on unique algorithms for analyzing market forces and identifying imbalances between buyers and sellers, this advisor helps you make precise and well-considered decisions in the trading process. Main features of the bb vector dynamics_robot advisor: Calculation of dynamic vectors. System determines the differences between the extreme price values and smoothed averages over a specified perio
KT Price Border MT5
KEENBASE SOFTWARE SOLUTIONS
KT Price Border は、3本のバンドで構成された価格チャネルを作成し、市場のスイングハイとスイングローの可能性がある領域を特定します。これらのレベルは、動的なサポートおよびレジスタンスとしても使用できます。 中央のバンドは、トレンドの方向を識別するためにも使用できます。そのため、このインジケーターはトレンドフォロー型の指標としても機能します。さらに、使いやすさとシンプルなトレードシグナルにより、初心者トレーダーにとって非常に有益です。 特徴 ほとんどの FX 通貨ペアで優れたパフォーマンスを発揮します。 短時間足と長時間足の両方で使用可能です。 スキャルピング、デイトレード、スイングトレードに適しています。 トレンドフォロー戦略と逆張り戦略の両方に対応しています。 価格がバンドを超えたときにアラートを送信できます。 価格バンドは、動的なサポートおよびレジスタンスレベルとして機能します。  価格境界の概念を理解する このインジケーターは、ボリンジャーバンドと同様に機能します。下部バンドは、市場の売られ過ぎ状態を示し、動的なサポートとして機能します。 上部バンドは、市場の
Adaptive SR Zones – Breakout Edition Adaptive SR Zones is a next-generation MetaTrader 5 indicator that automatically maps support and resistance zones and tracks breakout activity in real time. Designed for traders who rely on market structure and zone confluence, it combines multi-timeframe analysis , breakout confirmation logic , and customizable alerts into one powerful tool. No repainting. Core Features Dynamic Support & Resistance Mapping Detects zones from swing highs/lows and reaction po
Fibonacci Auto Levels Pro MT5 – リトレースメント、エクステンション、ピボットポイント Fibonacci Auto Levels Pro MT5 は、市場のスイングポイントを自動的に検出し、完全なフィボナッチ・リトレースメント、エクステンション、およびピボットポイントの構造をチャート上に描画する高度なテクニカル分析ツールです。 このインジケーターは、いくつかの独立したシステムを統合された単一の分析ツールに組み合わせています。 ピボットポイント (フィボナッチモード) ピボットポイントは、前期間の値幅に基づいて、潜在的なサポートおよびレジスタンスゾーンを特定するために使用されます。 このインジケーターは、前回の高値 (High)、安値 (Low)、終値 (Close) にフィボナッチ比率を適用して計算される フィボナッチ・ピボットポイント を使用します。 ピボットポイントの時間足は、手動で設定することも、以下のロジックを使用して自動で設定することもできます。 日中取引 ≤ 5 分 → 4 時間足 5–45 分 → 日足 45 分–4 時間 → 週足 日足
Displays trends in current chart. You can display trends of multiple timeframes in one chart by inserting this indicator as often as you want. Key features: displays trend line by finding highs and lows counts number of high/low of current trend in different color (long/short) allows you to display multiple timeframe trends in one chart Settings: Indicator Name: if you want to show M5 and H1 on one chart add TITrend twice to your current chart and rename M5 to "TITrendM5" and H1 to "TITrendH1" C
IndiceXperience
Mateus Silva Marques Dos Santos
Indicador para mercado de Índice Futuro Brasileiro (WIN) __________________________________________________________________________________________________ O indicador trabalha com rompimento de canal indicando o sentido do movimento e os 3 possíveis TP e o SL baseado no ATR. Indicação de utilização em TimeFrame de 5M, mas pode ser utilizado em qualquer tempo gráfico de sua preferencia. __________________________________________________________________________________________________
ENGLISH DESCRIPTION (MQL5 Standard Optimized) Product Name: Cybernetic Throne AI (MT5) [Subtitle: Throne Axis AMA | Sentinel Power | Sanctum Shield Safety] Introduction Cybernetic Throne AI is a kinetic authority system designed to rule the market trend with cybernetic precision. It establishes the "Throne Axis" using a rapid-response Adaptive Moving Average (AMA) , enforces directional control with Sentinel Power (Bulls/Bears Power) , and strikes only when the command threshold is breached. Thi
FRONTIER PIVOTS - Geometric Levels Indicator This indicator plots support and resistance levels/ranges on the chart using mathematical calculations. It helps traders identify potential price reaction zones based on geometric patterns. Main Features: Automatically calculates and displays key price levels Plots both support and resistance lines Uses daily price data for level calculation Clean visual presentation with different colors for different level types No repainting - levels remain static
Taylor Pivot
Pablo Filipe Soares De Almeida
注意事項: 本インジケーターは Taylor Pivot のみを表示 します。 ROC インジケーターは含まれておらず 、個別には表示されません。 Taylor Pivot  は、もともと Taylor によって開発され、その後プロのトレーダーである Linda Raschke が著書の中で広めた、古典的な短期トレード手法に基づいたインジケーターです。Raschke はこのアプローチを、短期的な市場の方向性をシンプルに特定する方法として強調しており、1 日あたり 1 回のポジション判断(買いまたは売り)に集中することで、頻繁なデイトレードと比べて心理的ストレスを軽減できるとしています。中心となる考え方は、翌セッションでの継続やフォロースルーを想定し、日足のクローズ時点でポジションを構築することで、初期の反転やマーケットテストを活用し、利益の出ているトレードをオーバーナイトで保有して追加の値動きを捉えることです。 この手法の核となるのは、日足タイムフレームにおける 2 期間の Rate of Change(ROC)から算出される短期ピボットポイントの計算です。このピボットは、直近の終値
Identificador de Inside Bar O Inside Bar é uma formação de vela de reversão / continuação, e é um dos padrões de Candle mais operados pelos trader. Esse indicador permite que você identifique um O Inside Bar no gráfico de forma rápida e fácil, lhe permitindo uma tomada de decisão muito rápida e precisa. Sendo ideal para lhe ajudar nas suas diversas estratégias de Day Trade ou swing trade. O visual e a marca registrada da análise gráfica por esse motivo esse indicador conta com 3 opções visuais p
Range Bot v2 mt5
Marcelo Jose Patino Vargas
Range Bot V2 es un sistema de trading automático diseñado especialmente para Indices Bursátiles americanos ( Us30, Us100 y Us500). Sistema capacitado para susperar challenges en cualquier compañia de fondeo que permita el uso de EAs ya que no es MG ni Grid. Tampoco es Tickscalp. Viene optimizado para US30 en horario NY. Modifique unicamente su riesgo porcentual por operacion
このプロダクトを購入した人は以下も購入しています
ARIPoint
Temirlan Kdyrkhan
1 (1)
ARIPoint is a powerful trading companion designed to generate high-probability entry signals with dynamic TP/SL/DP levels based on volatility. Built-in performance tracking shows win/loss stats, PP1/PP2 hits, and success rates all updated live. Key Features: Buy/Sell signals with adaptive volatility bands Real-time TP/SL/DP levels based on ATR Built-in MA Filter with optional ATR/StdDev volatility Performance stats panel (Success, Profit/Loss, PP1/PP2) Alerts via popup, sound, push, or email Cu
Azimuth Pro
Ottaviano De Cicco
5 (1)
発売プロモーション Azimuth Proは先着100名様限定で 299ドル でご提供します。最終価格は 499ドル となります。 リテールとインスティテューショナルのエントリーの違いはインジケーターではなく、ロケーションにあります。 多くのトレーダーは、モメンタムを追いかけたり、遅行シグナルに反応して、任意の価格レベルでエントリーします。機関投資家は、需給が実際にシフトする構造的なレベルに価格が到達するのを待ちます。 Azimuth Proはこれらのレベルを自動的にマッピングします:スイングアンカーVWAP、マルチタイムフレーム構造ライン、高確率ロケーションにのみ出現するABCパターン。 Azimuth Proは、構造分析とインテリジェントな自動化の両方を求めるプロフェッショナルトレーダー向けに構築されています。 Azimuthが外科的精度で市場構造をマッピングする一方、Azimuth Proはインテリジェンスレイヤーを追加します:トレーディングスタイルの自動検出、スマート設定された移動平均線、20年のデータでバックテストされた最適化パラメータ。その結果、お使いの銘柄と
無料の AUX インジケーターと EA サポ   直接ダウンロード — ここをクリック [ D.I.C.E ] The DICE Indicator Divergence in Chaos Environment は、エリオット波動理論とトレーディングカオス手法を組み合わせて使用するトレーダーのために設計された MT5 専用ツールです。価格変動の中の隠れたおよび通常のダイバージェンスを検出し、ビル・ウィリアムズが説明したカオス市場環境と同期します。 主な特徴 エリオット波動に対応したダイバージェンス検出:波動構造と調和した強気・弱気ダイバージェンスを識別。 カオス手法の統合:AO(オーサムオシレーター)と市場構造に整合。 マルチタイムフレームスキャン:異なる時間枠でダイバージェンスを分析し、トレンドの転換を確認。 視覚的アラートとオブジェクト:チャート上の矢印、ライン、マーカーで即座に識別。 市場適応読解:カオス的状況に自動適応し、ノイズを除去して有効なセットアップを維持。 ブレイクプルバックエントリー手法:シンプルなフィボナッチリトレースメントとピボットポイントを使用。 利点 ダイ
Super Signal – Skyblade Edition プロ仕様のノンリペイント / ノーラグ・トレンドシグナルシステム。卓越した勝率を実現 | MT4 / MT5 対応 1分足、5分足、15分足などの低い時間足で最も効果を発揮します。 主な特徴: Super Signal – Skyblade Edition は、トレンド取引に特化したスマートなシグナルシステムです。マルチレイヤーのフィルターロジックを用いて、明確な方向性と実際のモメンタムに支えられた強力なトレンドのみを検出します。 このシステムは 天井や底を予測するものではありません 。次の3つの条件がすべて満たされた場合にのみシグナルを発生させます: 明確なトレンド方向 モメンタムの増加 健全なボラティリティ構造 市場セッションに基づく流動性分析と組み合わせることで、シグナルの精度とタイミングがさらに向上します。 シグナルの特性: すべての矢印シグナルは 100% 非リペイント / 遅延なし 一度出現したシグナルは固定され、点滅・消失しません チャート上の矢印、情報パネル、ポップアップ通知、音声アラート、プッシュ通知
このインジケーターは、市場で 関心が示されたゾーン をハイライトし、その後に 注文の蓄積ゾーン を表示します。 これは、大規模な**板情報(オーダーブック)**のように機能します。 これは、 巨大な資金 のためのインジケーターです。その性能は卓越しています。 市場にどんな関心が存在していても、 必ず目に見えるようになります 。 (これは 完全に再設計され、自動化されたバージョン です。もはや手動分析は必要ありません。) トランザクションスピード(取引速度) は新しい概念のインジケーターで、市場で大口注文が どこに・いつ 集中しているかを示し、それに基づいたチャンスを提供します。 トレンドの変化を 非常に早い段階 で察知することができます。 FXでは「出来高」と呼ばれているものは誤解されています。実際には、これは 時間あたりの価格変動量 です。したがって、正しい名称は トランザクションスピード です。 考え方・行動・分析の仕方すべてが問われます。 分析パラダイムの転換は非常に重要です。 このインジケーターは、FXにおける出来高の考え方を 根本から再定義 し、論理的な形で正確に活用する、
まず第一に、この取引ツールはノンリペイント、ノンリドロー、ノンラグの指標であり、プロの取引に理想的ですことを強調する価値があります。 オンラインコース、ユーザーマニュアル、デモ。 スマートプライスアクションコンセプトインジケーターは、新米から経験豊富なトレーダーまで、非常 に強力なツールです。Inner Circle Trader AnalysisやSmart Money Concepts Trading Strategiesなど、20以上の有用な指標を1つに組み合わせています。このインジケーターはスマートマネーコンセプトに焦点を当て、大手機関の取引方法を提供し、彼らの動きを予測するのに役立ちます。 特に、流動性分析に優れており、機関がどのように取引しているかを理解しやすくしています。市場のトレンドを予測し、価格の動きを慎重に分析するのに優れています。機関の戦略とトレードを合わせることで、市場の動向についてより正確な予測ができます。このインジケーターは多目的であり、市場構造を分析し、重要な注文ブロックを特定し、さまざまなパターンを認識するのに優れています。 このインジケーター
Introduction to X3 Chart Pattern Scanner X3 Cherart Pattern Scanner is the non-repainting and non-lagging indicator detecting X3 chart patterns including Harmonic pattern, Elliott Wave pattern, X3 patterns, and Japanese Candlestick patterns. Historical patterns match with signal patterns. Hence, you can readily develop the solid trading strategy in your chart. More importantly, this superb pattern scanner can detect the optimal pattern of its kind. In addition, you can switch on and off individu
ARICoin is a powerful trading companion designed to generate high-probability entry signals with dynamic TP/SL/DP levels based on volatility. Built-in performance tracking shows win/loss stats, PP1/PP2 hits, and success rates all updated live. Key Features: Buy/Sell signals with adaptive volatility bands Real-time TP/SL/DP levels based on ATR Built-in MA Filter with optional ATR/StdDev volatility Performance stats panel (Success, Profit/Loss, PP1/PP2) Alerts via popup, sound, push, or email Cust
ARIScalp is a powerful trading companion designed to generate high-probability entry signals with dynamic TP/SL/DP levels based on volatility. Built-in performance tracking shows win/loss stats, PP1/PP2 hits, and success rates all updated live. Key Features: Buy/Sell signals with adaptive volatility bands Real-time TP/SL/DP levels based on ATR Built-in MA Filter with optional ATR/StdDev volatility Performance stats panel (Success, Profit/Loss, PP1/PP2) Alerts via popup, sound, push, or email Cus
AriX
Temirlan Kdyrkhan
1 (4)
AriX Indicator for MT5 A powerful trend-following and signal-evaluation tool AriX is a custom MT5 indicator that combines Moving Averages and ATR-based risk/reward logic to generate clear buy/sell signals. It visualizes dynamic SL/TP levels, evaluates past trade outcomes, and displays win/loss statistics in a clean on-chart panel. Key features include: Buy/Sell signals based on MA crossovers ATR-based SL/TP1/TP2/TP3 levels with visual lines and labels Signal outcome tracking with real-time stat
MetaForecast M5
Vahidreza Heidar Gholami
5 (3)
MetaForecastは、価格データのハーモニクスに基づいて、どんな市場の未来を予測し視覚化します。市場が常に予測可能ではありませんが、価格にパターンがある場合、MetaForecastは可能な限り正確な未来を予測できます。他の類似製品と比較して、MetaForecastは市場のトレンドを分析することでより正確な結果を生成することができます。 入力パラメータ Past size (過去のサイズ) MetaForecastが将来の予測を生成するために使用するバーの数を指定します。モデルは選択したバー上に描かれた黄色の線で表されます。 Future size (将来のサイズ) 予測すべき将来のバーの数を指定します。予測された将来は、ピンクの線で表示され、その上に青い回帰線が描かれます。 Degree (程度) この入力は、MetaForecastが市場で行う分析のレベルを決定します。 Degree 説明  0 Degree 0の場合、価格の全てのピークや谷、そして詳細をカバーするために、「Past size」の入力に大きな値を使用することが推奨されています。  1 (推奨) Degre
Big Player Range
Thalles Nascimento De Carvalho
5 (3)
BigPlayerRange — MT5向け最強インジケーター BigPlayerRange は、MetaTrader 5 で日経ミニやドル先物などの取引において、 最も効果的なインジケーター と評価されています。大口投資家(機関投資家)の行動を可視化し、高精度なテクニカル分析を可能にします。 どのように機能するのか? BigPlayerRangeは、買い圧力ゾーン(緑ライン)と売り圧力ゾーン(赤ライン)を描画し、価格がその範囲を超えるとトレンド方向への動きを示唆します。 緑のライン上で終値: 買いの勢いが強く、上昇トレンドの可能性。 赤のライン下で終値: 売り圧力が優勢で、下落が予想される。 範囲内での価格: レンジ相場でブレイクを待つ段階。 主なメリット: 機関投資家ゾーンの検出: 大口のエントリーポイントを視覚化。 自動ターゲット計算: 利確ポイントを戦略的に設定。 プルバックの可能性分析: リスク管理に役立つ情報提供。 推奨の使い方: Imbalance DOM Pro と併用してゾーンブレイクを確認。 SwingVolum
Rtc ML Ai | Predictor CORE MACHINE LEARNING ENGINE Adaptive ML Market Predictor – Multi-Bar Trend & Candle Forecast What This Indicator Does This indicator is a  real-time market prediction engine  designed to analyze price behavior and estimate  future market tendencies . Unlike conventional indicators, this system  does not rely on static parameters or historical curve-fitting , but adapts its internal state dynamically during live market operation. Instead of using static rules, the indic
Orderflow Scalp Pro v2.4   delivers institutional-grade trading intelligence through advanced volume analysis, dynamic VWAP calculations, real-time aggressive score monitoring, and precision arrow signals. This complete trading system transforms complex market data into clear, actionable signals for consistent profitability on 3-4 minute timeframes. Full Documentation: [Download PDF] Four Powerful Components in One System Volume Profile HeatMap with POC/VAH/VAL Transform your charts into inst
「 Dynamic Scalper System MT5 」インジケーターは、トレンド波の中でスキャルピング取引を行う手法のために設計されています。 主要通貨ペアと金でテスト済みで、他の取引商品との互換性があります。 トレンドに沿った短期的なポジションオープンのシグナルを提供し、追加の価格変動サポートも提供します。 インジケーターの原理 大きな矢印はトレンドの方向を決定します。 トレンド波の中では、小さな矢印の形でスキャルピングシグナルを生成するアルゴリズムが機能します。 赤い矢印は強気方向、青い矢印は弱気方向です。 トレンドの方向には敏感な価格変動ラインが描かれ、小さな矢印のシグナルと連動します。 シグナルは次のように機能します。適切なタイミングでラインが現れるとエントリーシグナルが形成され、ラインが開いている間はポジションが保持され、完了すると取引が終了します。 推奨される動作時間枠はM1~H4です。 矢印は現在のローソク足に形成され、次のローソク足が開いている場合は、前のローソク足の矢印は再描画されません。 入力パラメータ Trend Wave Period - トレ
もちろんです。以下は、提供いただいたテキストの日本語への翻訳です: MT4用の天文学指標をご紹介します:究極の天体トレーディングコンパニオン トレーディング体験を天空の高みに高める準備はできていますか?私たちの革命的なMT4用の天文学指標をご紹介します。この革新的なツールは、複雑なアルゴリズムの力を借りて、類まれなる天文学的洞察と精密な計算を提供します。 あなたの指先で宇宙の情報を:   宝のような天文学的データが明らかになる包括的なパネルをご覧ください。惑星の地理的/太陽中心座標、太陽と地球の距離、星の大きさ、伸び、星座、黄道座標および赤道座標、さらには水平座標まで、それぞれが綿密に計算され美しく表示されています。指標によって生成される垂直線は時間値に対応し、トレーディングの旅に宇宙の視点を提供します。 惑星のラインと関係:   グラフを飾る惑星のラインの魔法を体験し、スケールと角度をカスタマイズできます。直感的なコントロールパネルを介して各惑星のラインの表示を簡単に切り替えることができます。指定された時刻範囲内での合会、六分会、四分会、三分会、対会、逆行の指標で天体の関係の芸術を発
Weis Wave with Alert MT5
Trade The Volume Waves Single Member P.C.
4.94 (17)
Rental/Lifetime Package Options and Privileges  Rent Monthly Six Months   Yearly/Lifetime Weis Wave with Speed with Alert+Speed Index x x x Manual  x x x Quick Set up Video x x x Blog x x x Lifetime Updates x x x Setup and Training Material x x Discord Access Channel "The SI traders"          x Rectangle Break Alert Tool      x How to trade with it:    http://www.tradethevolumewaves.com   ** If you purchase please contact me to setup your  : Training Room and  complete manual access.  Wei
RelicusRoad Pro: 定量的市場オペレーティングシステム 【期間限定】無制限アクセス 70% OFF - 2,000人超のトレーダーと共に なぜ多くのトレーダーは「完璧な」インジケーターを使っても失敗するのでしょうか? それは、文脈を無視して 単一の概念 だけでトレードしているからです。文脈のないシグナルは単なるギャンブルです。勝ち続けるには、 根拠の重なり(コンフルエンス) が必要です。 RelicusRoad Proは単なる矢印インジケーターではありません。完全な 定量的市場エコシステム です。独自のボラティリティモデリングを用いて、価格が推移する「適正価値の道(Fair Value Road)」をマッピングし、ノイズと真の構造的ブレイクを判別します。 推測はやめましょう。機関投資家レベルの「ロード・ロジック」でトレードを。 コアエンジン:「Road」アルゴリズム システムの中心となる Road Algo は、市場環境にリアルタイムで適応するダイナミックなボラティリティチャネルです。 安全ライン(平衡点) と、価格が数学的に反転しやすい 拡張レベル を投影します。 Si
Hunter Spike
Jaime Humberto Gomez Arias
Hunter Spike This indicator consists of two regression channels calibrated with the current movement of the synthetic index algorithm, for any Deriv or Weltrade broker. Each channel has a signal, a target that alerts us when the price touches them, indicating buys on booms or gains and sells on crashes or pains. -configuration for booms or gains: Channel zone 1 (30) Channel zone 2 (0) -configuration for crashes or pains: Channel zone 1 (100) Channel zone 2 (70) Zones freely configurable by
Elliott Wave Trend was designed for the scientific wave counting. This tool focuses to get rid of the vagueness of the classic Elliott Wave Counting using the guideline from the template and pattern approach. In doing so, firstly Elliott Wave Trend offers the template for your wave counting. Secondly, it offers Wave Structural Score to assist to identify accurate wave formation. It offers both impulse wave Structural Score and corrective wave Structure Score. Structural Score is the rating to sh
WARNING: This indicator is distributed EXCLUSIVELY on MQL5.com MT4 version:   https://www.mql5.com/it/market/product/160363 MT5 version:   https://www.mql5.com/it/market/product/160410 ============================================================================================= MAX RIBBON ver 1.00 The indicator that shows you the TREND clearly and unambiguously! ============================================================================================= DESCRIPTION MAX RIBBON is an advanced tre
このインジケーターは実践的なトレードに最適な自動波動分析のインジケーターです! 場合... 注:   Tang Lun (Tang Zhong Shuo Zen) の命名規則の影響で、私は波のグレーディングに西洋の名前を使用することに慣れていません。基本的な波を ペン 、二次波のバンドを セグメント と名付けました。同時に、 セグメント にはトレンドの方向が指定されます (この命名方法は将来のノートで使用されます。最初に言っておきます)。ただし、アルゴリズムは曲がりくねった理論とはほとんど関係がないため、付けるべきではありません。これは、私の市場分析 によって要約された、絶えず変化する複雑な運用ルール を反映しています。 バンドは標準化され、人によって異なることがないよう定義されており、市場参入を厳密に分析する上で重要な役割を果たす人為的な干渉の描画方法が排除されています。 このインジケーターを使用することは、取引インターフェイスの美しさを改善することと同等であり、元の K ライン取引を放棄し、取引の新しいレベルに連れて行きます。また、宣伝の観点から顧客の認識も向上します。 イ
FOOTPRINTORDERFLOW: The Authoritative Guide ( This indicator is also compatible with economic providers that do not offer DOM data and BID/ASK data, It also supports various foreign exchange transactions, DEMO version,modleling must choose " Every tick based on real ticks"  ) Important notice: Before placing an order, please contact me first, and I will provide you with professional answers and services 1. Overview FOOTPRINTORDERFLOW  is an advanced Order Flow analysis tool designed for MetaTra
The Super Arrow Indicator provides non-repainting buy and sell signals with exceptional accuracy. Key Features No repainting – confirmed signals remain fixed Clear visual arrows: green for buy, red for sell Real-time alerts via pop-up, sound, and optional email Clean chart view with no unnecessary clutter Works on all markets: Forex, gold, oil, indices, crypto Adjustable Parameters TimeFrame Default:   "current time frame" Function:   Sets the time frame for indicator calculation Options:   Can
VWAP Scalping Pro – Advanced VWAP & Market Profile System Professional-Grade VWAP + Market Profile Technology for Precision Trading VWAP Scalping Pro is an advanced analytical tool that integrates Volume-Weighted Average Price (VWAP) analysis with professional Market Profile visualization. It provides traders with institutional-style insights into price structure, volume distribution, and session dynamics — ideal for scalping, intraday, and swing trading strategies. Key Features Triple VWAP St
無料のAUXインジケーター、EAサポート、完全ガイドをご利用ください – https://www.mql5.com/en/blogs/post/763955 トレンドを見極める。パターンを読む。エントリーのタイミングを掴む。 30秒以内の3ステップ!分析不要で簡単トレード — あなたのスマートアシスタントがワークフローを簡素化します チャートの過剰な情報にもう悩まされない。 スマートバイアス検出で自信を持ってトレード。 すべての通貨、暗号資産、株式、金属、指数、あらゆる時間足に対応。 クリックして実行するだけ — それだけで十分。 スピードと明快さを求める忙しいトレーダーに最適。 TPTSyncXは、 トレンド、パターン、 ローソク足のトリガー 分析を、洗練されたインテリジェントなビジュアルシステムとしてシームレスに統合する、強力なオールインワンMetaTrader 5インジケーターです。明確さ、正確さ、スピードを求めるトレーダー向けに設計されており、プライスアクション、構造的パターン、市場タイミングツールを組み合わせて、高確率のトレードセットアップを特定するのに役立ちます。 主な
SynaptixQuant Dominance Matrix: Institutional-Grade Market State Extraction Engineered for traders who require a data-driven view of market behaviour beyond surface-level indicators. The Synaptix Quant (SQ) Dominance Matrix is not a conventional currency strength display. Behind its intentionally streamlined interface runs a sophisticated analytical architecture designed to quantify market conditions with precision. Every output is generated through layered signal processing built to identify d
Multi Kernel Regression Indicator MT5 Professional Non-Repainting Trend Following System with 17 Advanced Kernel Functions Overview The Multi Kernel Regression indicator is a sophisticated technical analysis tool that applies advanced statistical kernel regression methods to price data, offering traders a powerful edge in identifying trends and potential reversal points. Unlike traditional moving averages, kernel regression provides adaptive smoothing that responds intelligently to market dynam
Step into the world of Forex trading with confidence, clarity, and precision using Gold Indicator a next-generation tool engineered to take your trading performance to the next level. Whether you’re a seasoned professional or just beginning your journey in the currency markets, Gold Indicator equips you with powerful insights and help you trade smarter, not harder. Built on the proven synergy of three advanced indicators, Gold Indicator focuses exclusively on medium and long-term trends elimina
note: this indicator is for METATRADER4, if you want the version for METATRADER5 this is the link:  https://www.mql5.com/it/market/product/108106 TRENDMAESTRO ver 2.5 TRENDMAESTRO recognizes a new TREND from the start, he never makes mistakes. The certainty of identifying a new TREND is priceless. DESCRIPTION TRENDMAESTRO identifies a new TREND in the bud, this indicator examines the volatility, volumes and momentum to identify the moment in which there is an explosion of one or more of these da
作者のその他のプロダクト
ケルトナー・エンハンスドは、ケルトナー・チャネルの精度と見やす さを向上させるもので、METAデフォルトを超える多くの調整オプショ ンと5つの価格計算を備えています。 ケルトナーEインディケータは、ボリンジャーバンドや移動平均エンベロープ に類似したバンド型インディケータです。ケルトナーEは、ボリンジャーバンドや移動平均線に似た帯状のインジケータで す。 ケルトナー・チャネルを使用する際に注意すべき主な現象は、上限エンベロープの上方または下限エンベロープの下方へのブレイクアウトです。上側のエンベロープを上抜けた場合は、買われ過ぎを意味します。下限エンベロープを下抜けた場合は、売られ過ぎを意味する。 ただし、ケルトナー・チャネルを使用する際には、買われすぎや売られすぎの状態はしばしば強さの兆候であることに留意してください。 トレンドが明確に定義されている場合、買われ過ぎや売られ過ぎは強さを示すことがあります。この場合、現在のトレンドは強まり、最終的に継続する。横ばい相場では、少し違った動きをする。相場が横ばいトレンドにある場合、買われすぎや売られすぎの読みは、多くの場合、価格が
FREE
毎日特定のローソク足で動くPIVOTを何度探したことでしょう。 多くのトレーダーは、マーケットが開いてから30分後、正午12時など、毎日特定の時刻を基準にして、その日のトレンドの方向性を推し量ることを好みます。 このインディケータでは、特定の時間(時、分)を指定し、その時間から翌日までのピボットを同時にプロットすることができます。その特定のローソク足/時間に基づき、中央値、最大値、最小値、サポ ート、レジスタンスの5本のラインが表示されます。 選択した時間がPERIODの制限外(M5タイムフレームの10:12など)である場合、この値は最も近いローソク足の時間に切り上げられます。さらに、ユーザーはすべての線のスタイル、色、幅を設定することができます。 これで良いトレードができることを願っています。 また、時間範囲に基づくPIVOTが必要な場合は、 他の製品をご覧ください 。
FREE
ジュリック・アドバンストMA(JurMA)は、マーク・ジュリックが考案した オリジナルのJMAをベースに開発されたノンリペイントのテクニカル 指標です。 従来の移動平均線に見られるラグを減らし、平滑性を向上させ、ノイズを減らすように設計されています。JurMAは市場のボラティリティに適応し、ユーザーが感度を微調整できるため、金融市場のトレンドや反転を見極めるのに役立ちます。この適応性と効率性により、トレーダーやアナリストの間で人気があります。 他のテクニカル・インディケータの広い文脈では、「感度」とは、価格データの変 化に対してインディケータがどれだけ速く反応するかを意味します。ローソク足の本数ではなく、インジケータが一定期間の値動きをどのように解釈するか(反応性の大小)を意味します。JurMAは、このインジケータの動作、特に「移行プロセスの質」を調整するために、PHASE機能パラメータを提供しています。PHASEは線の "滑らかさ "とは関係なく、平均計算におけるJarikの公式と直接相互作用する方法であることを理解することが重要です(ノイズをフィルタリングするのに適しています
TrendOnCloseは、特定のローソク足サイクル内のトレンドとカウンター トレンドの統計分析に焦点を当てた、バイナリー市場投資家向けの高度 なインディケータです。 各サイクル は、ローソク足の終値によって定義され、次のサイクルが始まるまでの間、トレン ド方向(UP/DOWN - BULL/BEAR)を確立します。統計分析は2つの構成で行われます: ⦁ SUBSEQUENT CANDLEとしての統計目標: アルゴリズムは、サイクル内の後続のローソク足に焦点を当てます。 ⦁ INTERCYCLESとしての統計ゴール: アルゴリズムは、各サイクル間のすべてのローソク足を考慮する。 選択された統計目標に基づき、各ローソク足のトレンドがCYCLEローソク足のトレンドと比較され、同一方向の場合はTREND-Percent(TD)とTrend-Occurrences(N-TD)が増加し、トレンドが乖離している場合はCOUNTER-TREND(CTとN-CT)が増加します。さらに、このインジケータは、日足、週足、月足の統計的な合計を提供し、これらの期間中、各サイクル の「トレンド」または「
HAshi-EはHeiken-Ashiシグナルを分析する強化された方法です。 説明 HAshi-Eは、Heiken-Ashiシグナルを分析するための強化された方法です。HAshi-Eは、Heiken-Ashiシグナルを分析するための強化された方法です。HAshi-Eは、Heiken-Ashiシグナルを分析するための強化された方法です。伝統的なローソク足チャートとは異なり、ヒーケンアシのローソク足は過去のバーの平均値を使って計算されるため、よりスムーズで解釈しやすい視覚的表現が可能です。 その主な利点は、ほとんどの人が本来の読み方をしない理由でもあります。Heiken-Ashiローソク足には平均値に関する情報が含まれており、通常、資産ローソク足の前に配置されているため、色や形に惑わされ、不適切な時間帯や遅い時間帯にエントリーやエグジットを行う人をよく見かける。 HAshi-Eは、伝統的なHeiken-Ashiインジケータの改良版です! HAshi-E(チャート版)の特徴: 同じデータを異なる角度から見る HAshi-Eは、伝統的なHeiken-Ashiローソク足だけでなく、ライ
Designed by Welles Wilder for daily commodity charts, the ADXW is now used in various markets by technical traders to assess the strength of a trend or even a trend for short- or long-term trades. The ADXW uses a positive (DI+) and negative (DI-) directional indicator in addition to its trend line (ADX). According to Wilder, a trend has strength when the ADX signal is above 25; the trend is weak (or the price has no trend) when the ADX is below 20. The absence of a trend does not mean that th
テクニカル分析の領域では、ParbMAはParabolic SARのトレンドを調査するための非常に直感的なツールとして浮かび上がります。この革新的なアプローチは、カスタマイズ可能なラインを活用し、その色、形状、幅のオプションにおいてその汎用性が際立っています。この柔軟性により、視覚的な分析が向上し、戦略の立案や意思決定に大きく役立ちます。 ParbMA(Parabolic Moving Average)は、J. Welles WilderのParabolic SAR(Stop and Reverse)と移動平均の概念を組み合わせたカスタムの技術指標です。このハイブリッド指標は、これらの手法の利点を捉え、金融市場における価格トレンドと潜在的な反転ポイントを追跡する独自の方法をトレーダーに提供することを目的としています。 ParbMAの主な特徴 カスタマイズ可能な視覚的表現: ParbMAの中心には、ラインを通じてトレンドを表現する能力があります。ユーザーはこのラインを好みに合わせて、様々な色、形状、幅から選択することができます。このカスタマイズのレベルにより、トレンドの表現がユー
Compared to simple or exponential moving averages, slow adaptive trend lines might offer a more nuanced view of the trend by adjusting their sensitivity based on market conditions. However, their slow nature might also mean they are late in signaling reversals when market conditions change rapidly - and that is the difference between them and our SlowAMA . SlowAMA was designed to be a better long-term trend indicator than EMA and other Moving Averages. It uses our JurMA calculations, reducing
HAshi-EはHeiken-Ashiシグナルを分析するための強化された方法です。 説明 HAshi-Eは、Heiken-Ashiシグナルを分析するための強化された方法です。HAshi-Eは、Heiken-Ashiシグナルを分析するための強化された方法です。HAshi-Eは、Heiken-Ashiシグナルを分析するための強化された方法です。伝統的なローソク足チャートとは異なり、ヒーケンアシのローソク足は過去のバーの平均値を使って計算されるため、よりスムーズで解釈しやすい視覚的表現が可能です。 その主な利点は、ほとんどの人が本来の読み方をしない理由でもあります。HAshiローソク足には平均値に関する情報が含まれており、通常、資産ローソク足の前に配置されているため、色や形に惑わされ、不適切な時間帯や遅い時間帯にエントリーやエグジットを行う人をよく見かけます。 このような背景から、HAshi-Eは従来のHeiken-Ashiインジケータの改良版です! HAshi-E(別ウィンドウ版)の特徴: 同じデータを様々な角度から見る: HAshi-Eは伝統的なローソク足だけでなく、ライン、
毎日特定の時間枠で機能するPIVOTを何度探しましたか? 多くのトレーダーは、NYSEが開く2時間前から1時間後まで、あるいはNYSEが開 いてから30分後までといったように、毎日特定の時間間隔に基づいて、その 日のトレンドの方向性を予測することを好みます。 このインディケータは、特定の時間間隔(時 間と分)を指定し、その時間間隔から同じ時間間隔で翌日までのピボッ トをプロットします。こ れ に 基 づ い て 、中 央 値 、高 値 、安 値 、サ ポ ー ト 、レ ジ ス タ ン ス の 5本の線が表示されます。 選択した時間がPERIODの制限外(M5タイムフレームの10:12など)である場合、この値は最も近いローソク足の時間に切り上げられます。さらに、スタイル、色、幅の面ですべてのラインを設定することができます。 これで良いトレードができることを願っています。
VIDYA-ENHANCEDインディケータ(Variable Index Dynamic Average)は、トレンドや横ばいの動きを識別するために使用されるテクニカル分析ツールです。 VIDYA-ENHANCED は、チャンデ・モメンタム・オシレーターをボラティリティ指標と して使用し、市場のボラティリティに基づいて動的に感度を調整します。この機能により、VIDYA-ENHANCEDは値動きの激しい局面ではより機敏に、ボラティリティの低い局面ではより安定した動きを維持することができます。 特徴 - メタトレーダー標準より5つ多い12のオプションから価格を選択! - VIDYAとEMAの期間を選択。 - VIDYAラインの色、タイプ、幅を変更。
フィルタ:
レビューなし
レビューに返信