Scalping Dandruff

Scalping Dandruff

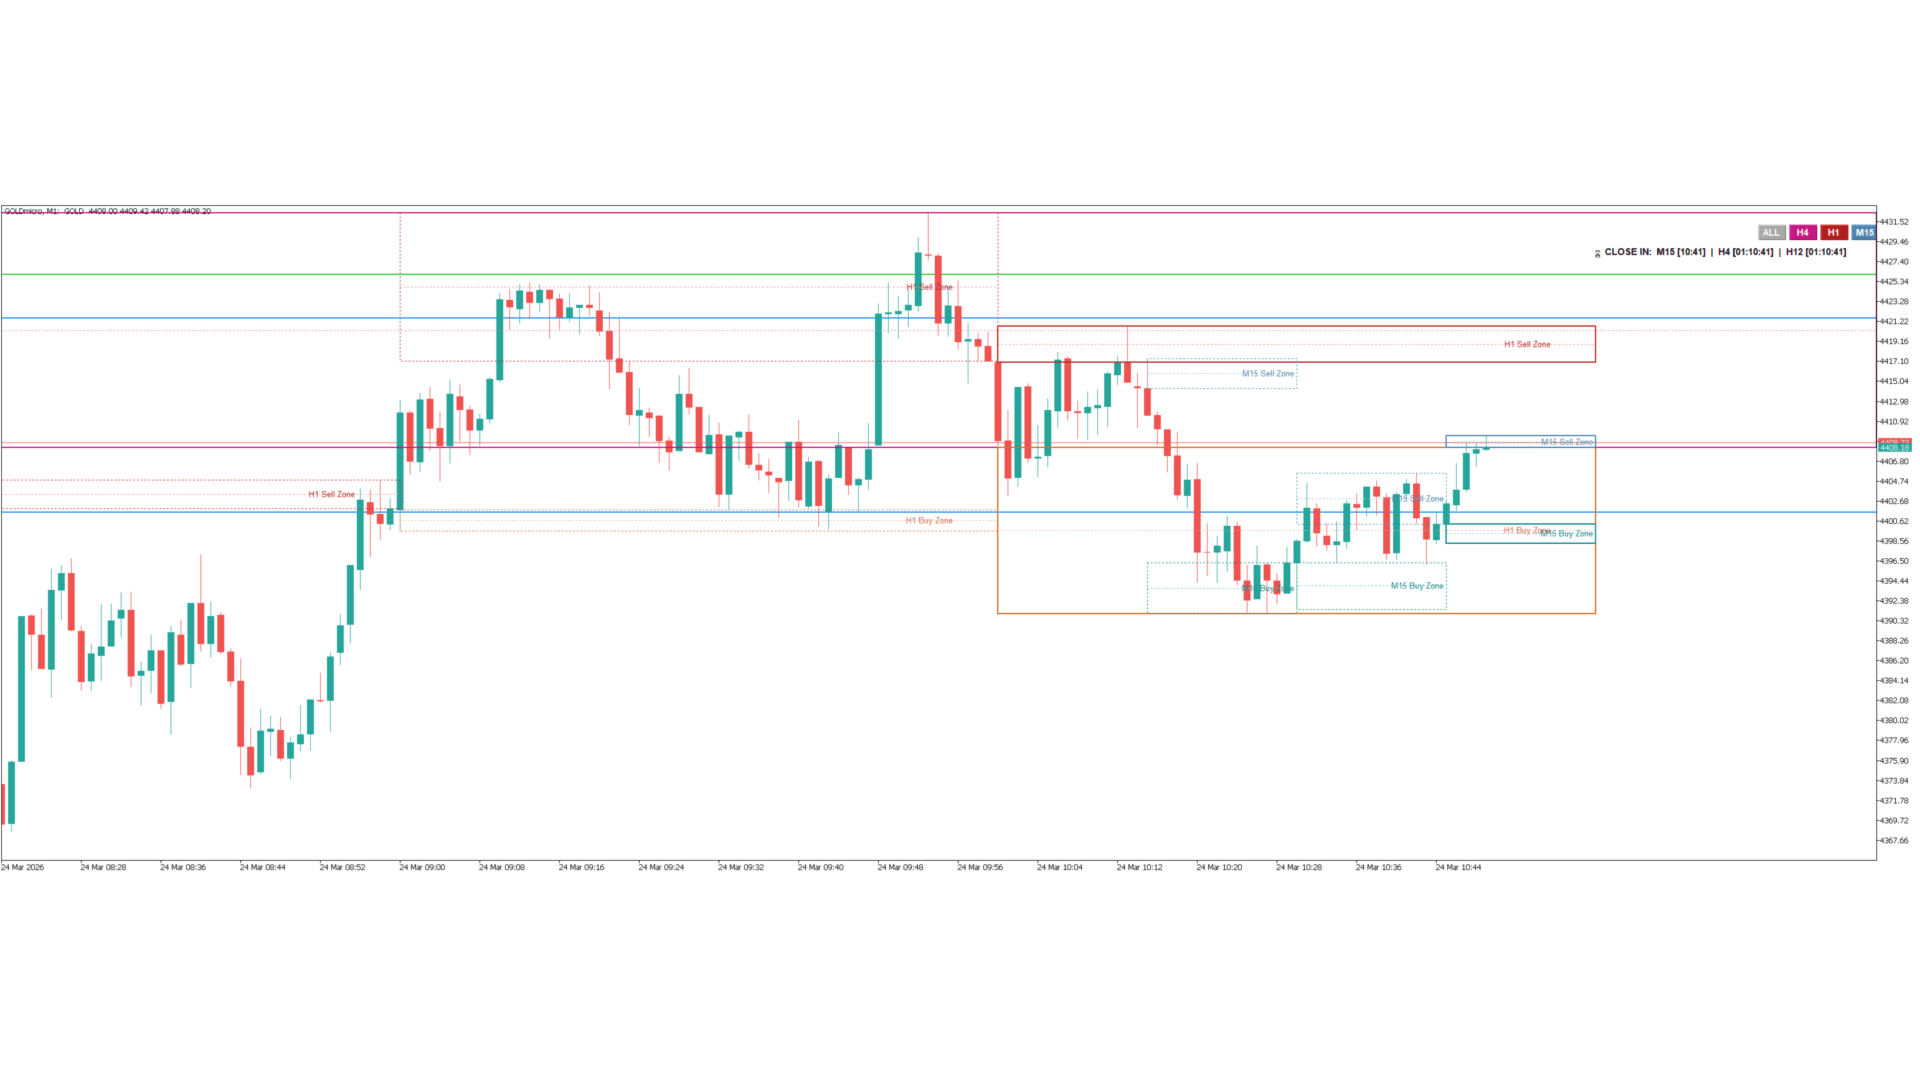
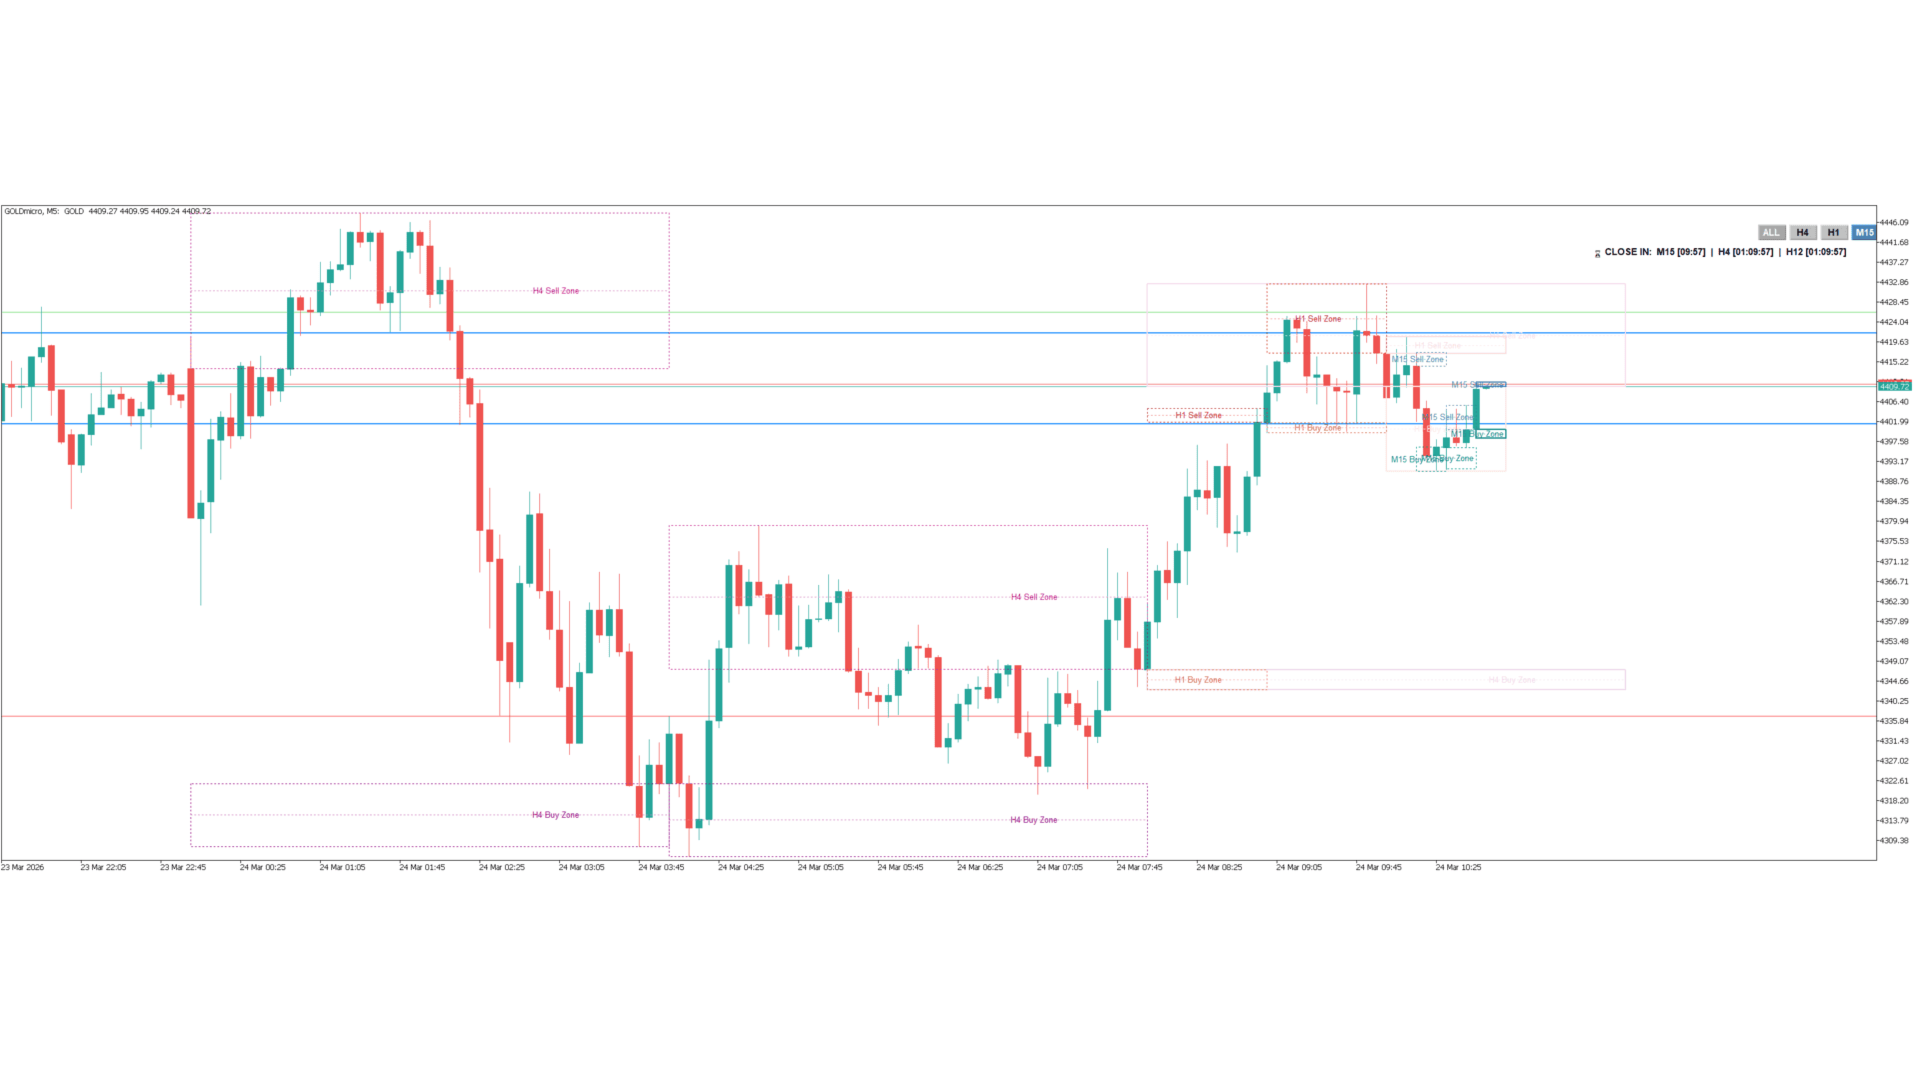
Scalping Dandruffは、MetaTrader 5用に設計されたマルチタイムフレーム構造マッピングインジケーターです。特定の時間ベースの標準作業手順(SOP)に基づき、重要な水平サポートおよびレジスタンスゾーンを自動的に描画します。特定の日中のウィンドウで極端な高値と安値を特定することにより、インジケーターはこれらのレベルを前方に投影し、トレーダーが実行タイムフレーム上で直接マクロ市場構造を視覚化できるようにします。

主な機能:

  • 厳密なヒゲの分離 (Strict Wick Isolation): チャートを混乱させる巨大なブロックを描画する代わりに、ローソク足の実体(始値/終値)から極端なヒゲの高値または安値まで正確にゾーンを描画します。これにより、チャートを非常にクリーンに保ち、拒否(リジェクション)エリアを厳密に強調します。

  • スマートゴーストテクノロジー (Smart Ghosting): M15などの下位タイムフレームに焦点を当てる場合、重なり合うマクロゾーン(H1およびH4)は自動的に不透明度が下がり、アクティブなプライスアクションを妨げないようにフェードアウトします。現在の価格の左側にある過去のマクロゾーンは、構造の参照用として100%表示されたままになります。

  • 均衡トラッキング (Equilibrium Tracking): 各買いゾーンおよび売りゾーン内に、正確な反応レベルを特定するのに役立つ50%の均衡(Equilibrium)中間点線を自動的に計算して点線で描画します。

  • インタラクティブなGUIコントロール: チャート上の目立たない内蔵ボタンを使用して、H4、H1、またはM15構造の表示を瞬時に切り替えます。起動時は即座に明確な判断ができるよう、デフォルトでM15に焦点が当てられます。

  • 動的な千鳥配置ラベル: ゾーンのテキストラベルは動的に右揃えされ、千鳥状(階段状)に配置されます。これにより、画面の右端でH4、H1、およびM15のラベルが重なったり衝突したりすることがなくなります。

  • 統合されたローソク足タイマー: 日中のタイミングを把握しやすいよう、画面の隅にM15、H4、H12、D1のローソク足確定までのミニマルなカウントダウンタイマーを搭載しています。

カスタマイズと入力設定:

  • ブローカー時間の同期: 設定でSOPの時間を簡単に調整し、特定のブローカーのサーバー時間をニューヨークセッションのターゲットウィンドウに正確に合わせることができます。

  • 視覚設定: すべてのタイムフレームのライン、レジスタンスボックス、サポートボックスの色を完全にカスタマイズし、個人のチャートテンプレートに完全に一致させることができます。

  • ゾーンの制限: 端末の高いパフォーマンスを維持し、視覚的な疲労を軽減するために、チャートに描画される過去のゾーンの正確な数を制御します。

サポート: ご質問、設定のサポート、またはテクニカルサポートについては、MQL5の組み込みプライベートメッセージングシステムを通じて直接お問い合わせください。

おすすめのプロダクト
Signal Eskiya, in addition to channel lines, reflects entry signals in the form of arrows. Trading strategies using the channel indicator belong to the classic methods of technical analysis, are easy to execute, and therefore available even to beginners. Price ranges work equally well on any trading assets and timeframes, they can be used both independently and with additional confirmation from oscillators and market volumes. American traders say: “Trend is your friend”, which means “Trend is
Moving pivot Average Fibonacci The  indicator compares the selected period with its counterpart from the previous period. The indicator determines the moving Fibonacci levels for the day or any time interval to assess the price movement range from the time average. The indicator helps predict the expected high or low for the day based on historical time data. The pivot line can be considered an average trend line and use it in a variety of trading strategies. If you have any question about the
I recommend you to read the  product's blog  (manual) from start to end so that it is clear from the beginning what the indicator offers. This multi time frame and multi symbol supply and demand zone dashboard indicator sends alerts when the price has reached a supply/demand zone. It is also possible to use it to be alerted about regular double tops/bottoms instead of zones. It can be used with all time frames from M1 to MN. Maximum 9 time frames can be shown in the dashboard at the same time. 
Projection of Phi   Is a technical indicator that calculates dynamic support and resistance levels. It uses angular geometric projections and mathematical ratios to identify market expansion ranges. Features: Dynamic Fibonacci Expansion: Extension level projection Geometric Calculation: Angular analysis and mathematical ratios Visualization: Graphical objects with informative labels Compatibility: M1 to H4 timeframes Applications: Identification of zones for trade management Analysis of volatil
Multichart V and H Line Sync Overview Multichart V and H Line Sync is the essential tool for multi-timeframe traders. It instantly synchronizes your Horizontal Support/Resistance Lines and Vertical Time Lines across all open charts of the same symbol. Stop drawing the same levels on M5, H1, and D1 charts manually. With this tool, draw a line once, and it automatically replicates on every other timeframe. Perfect for keeping your technical analysis consistent and your workspace clean. Key Feature
FREE
mql4 version:  https://www.mql5.com/en/market/product/44606   Simple indicator to calculate profit on fibonacci retracement levels with fixed lot size, or calculate lot size on fibonacci levels with fixed profit. Add to chart and move trend line to set the fibonacci retracement levels. Works similar as default fibonacci retracement line study in Metatrader. Inputs Fixed  - select what value will be fix, lot or profit Fixed value  - value that will be fix on all levels Levels  - levels for which
Adaptive SR Zones – Breakout Edition Adaptive SR Zones is a next-generation MetaTrader 5 indicator that automatically maps support and resistance zones and tracks breakout activity in real time. Designed for traders who rely on market structure and zone confluence, it combines multi-timeframe analysis , breakout confirmation logic , and customizable alerts into one powerful tool. No repainting. Core Features Dynamic Support & Resistance Mapping Detects zones from swing highs/lows and reaction po
Considering the main theories of Forex (Dow Theory, support lines, chart patterns, and Fibonacci retracements), It tells you the price range where whales (large investors) are likely to appear. You can trade at the price points that professionals also aim for. You no longer have to warry about where to aim next. We are live-streaming the actual operation of the system. Please check for yourself if it is usable. Please check it out for yourself. https://www.youtube.com/@ganesha_forex We do not
Liquidity Map  Overview The Liquidity Map indicator is an advanced visualization tool based on ICT Smart Money Concepts . It automatically identifies daily Buy Zones , Sell Zones , and Liquidity Levels , showing where price is likely to reverse or continue based on institutional order flow. It calculates key levels from the daily session — such as the previous day’s high, low, and midpoint — then derives a premium (sell bias) and discount (buy bias) structure. When price trades into these mapped
The indicator ‘Probability Range Bands’ gives a prediction of the amount, how much the asset is moving from its current price. The range bands give probabilities, that the candle close will not exceed this certain price level. It is also called the expected move for the current candle close.   This Indicator is based on statistical methods, probabilities and volatility. Asset price is assumed to follow a log-normal distribution. Therefore, log returns are used in this indicator to determine the
LR Pivots Combo Statistics That Show You Where the Market Stands! Key Features (updated V2.1) 1. Auto-Plotting Linear Regression Channel Trend Direction — Uses slope (normalized by ATR) to identify whether the market is in an uptrend, downtrend, or ranging sideways. Trend Quality (R-Squared) — Tells you if the trend is statistically consistent (Stable) or just noise (Volatile). Useful for filtering out unreliable setups. Standard Deviation Bands — Shows how far price has deviated from the regre
FREE
The Wamek Support and Resistant (WSR) Indicator is a remarkable tool that stands out in the world of technical analysis. It sets itself apart by cleverly combining price action and leading indicators to delineate support and resistance levels with a high degree of accuracy. Its unique feature is its adaptability; users can fine-tune the indicator by adjusting input parameters, enabling them to create customized support and resistance levels that suit their trading strategies. Notably, one of WSR
PROB MULTI-TF INSTITUCIONAL Probabilidad Operativa Multitemporal con Confirmación Estructural PROB MULTI-TF INSTITUTIONAL es un indicador avanzado diseñado para traders que buscan operar con confirmación estructural real, sin señales aisladas. El sistema analiza simultáneamente múltiples temporalidades y calcula un Global Bias porcentual , mostrando de forma clara cuándo el mercado presenta mayor probabilidad de: Compra (BUY) Venta (SELL) Neutralidad (WAIT) ¿Cómo funciona? El indica
Projection インジケーター(BCB Elevate)は、完全なプロ仕様のマーケット構造およびトレンド追従ツールです。手動トレーダー向けに作られており、マクロトレンドフィルター(EMA 100)、動的な ATR トレーリングストップ、スイングの高値/安値(Swing High/Low)ピボット追跡を組み合わせ、高精度なチャートシグナルを提供します。 チャートを再描画したり散らかしたりする代わりに、Projection インジケーターは条件が厳密に整うまで待機し、エントリー矢印、ストップロスの目標、テイクプロフィットレベルを描画します。 主な機能: トレンド検出: 構造的なスイング高値/安値を使用して真の市場トレンドを識別します。 マクロフィルター: EMA 100 を基準線として用い、支配的なモメンタムに沿った取引のみを行えるようにします。 動的 ATR ストップ: 変動性に応じたストップロスと二段階のテイクプロフィット(TP1 と TP2)ゾーンを自動計算します。 RSI ピーク検出: 取引中に RSI が極端な過熱/過冷状態に達したときにアラートを出し、理想的な決済機会を提
Linha de Variacao de Preco
Renato Fabio Santos Vasconcelos
ENGLISH VERSION PRICE VARIATION LINE – TAKE CONTROL OF THE MARKET! Turn the opening price into your strategic weapon Clearly see how many points or % the market moved Auto horizontal lines at the levels YOU define Mark entry, exit, target zones and explosive regions Clean, sharp, and professional layout Simple, powerful, and essential for any serious trader
オンバランス・ボリューム(OBV)は、出来高と価格を関連付け、値動きを識別するテクニカル指標です。OBVの基本的な考え方は、出来高の変化は一般に価格の変化に先行するというものである。OBVは、価格が高値で引けた期間の出来高を累積し、安値で引けた期間の 出来高を減算する。こ の 結 果 、資 産 の ト レ ン ド の 方 向 を 示 す 数 値 が 得 ら れ る 。 OBVの解釈は簡単です。OBVの上昇は、買い手が市場に参入または留まろうとしていることを示唆し、上昇トレンドのシグナルとなります。一方、OBVが低下している場合は、売り手が優勢であることを示し、下降トレンドの可能性を示唆します。 現在、シグナルに最大3つの移動平均を使用することができ、取引判断プロセスを簡素化することができます。OBVがMAラインと交差していることと、その間の距離を観察するだけです。これがOBV-MAの目的です! OBV線がMA線と交差し、MA線とOBV線が大きく離れている場合、上昇トレンドまたは下降トレンドの強い兆候を示します。もう一つの良いトレンドシグナルは、すべての線(OBV線とMA線)が同
+++++++++++++++++++++++++++++++++++++++++++++++++++++++++++++++++++++++++++++++++++++++++++++++++ +++ Link to EURUSD Only Free Version -->  https://www.mql5.com/en/market/product/156904?source=Unknown +++++++++++++++++++++++++++++++++++++++++++++++++++++++++++++++++++++++++++++++++++++++++++++++++ Hallo Trader, This is a traditional GANN & FIBONACCI strategy based on detection of an impulsive move in the opposite direction. This is called a Breakout. At the moment of Breakout, the indicator draw
Rtc ML Ai | Predictor CORE MACHINE LEARNING ENGINE Adaptive ML Market Predictor – Multi-Bar Trend & Candle Forecast What This Indicator Does This indicator is a  real-time market prediction engine  designed to analyze price behavior and estimate  future market tendencies . Unlike conventional indicators, this system  does not rely on static parameters or historical curve-fitting , but adapts its internal state dynamically during live market operation. Instead of using static rules, the indic
Adaptive Fibonacci Trend Zones is an MT5 indicator built for traders who want a clean structure-based Fibonacci workflow without constantly redrawing anchors by hand. The indicator automatically detects the dominant swing, builds the active Fibonacci map, projects trade-map zones and adapts its behavior across scalp, intraday and swing conditions. Instead of leaving outdated levels on the chart when structure changes, the indicator can disable the active trade map and wait for a new anchor. T
FRONTIER PIVOTS - Geometric Levels Indicator This indicator plots support and resistance levels/ranges on the chart using mathematical calculations. It helps traders identify potential price reaction zones based on geometric patterns. Main Features: Automatically calculates and displays key price levels Plots both support and resistance lines Uses daily price data for level calculation Clean visual presentation with different colors for different level types No repainting - levels remain static
市場構造は、より高い時間枠でのブレイクアウトがトレーダーにトレンドをクリアするのに役立つ可能性があるものです. 1. このインディケータは最後の 2 つの構造 (ZigZag の前の高値と安値) のみに ZigZag を描画し、ZigZag の新しいバーは構造のブレークが発生したときにのみ形成されます。 2. 構造体の破壊時にターミナルとプッシュ通知を提供 3. [ と ] キーから ZigZag の Extdepth を増減して、スイングを調整します。 4. Line AB BC と CD の色を変える 5.多くのチャートに追加し、複数のシンボルでアラートを取得します Break of Structure Multi ExtDepth Breakout Multi Symbol Scanner を探している場合は、この製品を使用できます。 Multi Symbol Multi ExtDepth ZigZag Breakout Scanner
A SmartTrendMA foi projetada para identificar melhor zonas de alta, baixa e consolidação, azul alta, vermelho baixa e branco consolidação, vai te auxiliar a identificar melhor a tendência. Em parâmetro regule melhor conforme sua preferência em grau pois cada par de moeda se adequa diferentemente a cor,mude também o período e se quiser mude exponencial ou simples. 
O Alexxander Autotrader é seu robô especialista em trade em minidólar WDO na bolsa brasileira B3. Com estratégia única, o robô já está configurado para operar minidólar na abertura do pregão, operando em fechamentos de gaps principalmente. O robô também pode ser otimizado para operar além do horário de abertura. Alem disso, o robô pode ser configurado com trailling stop, horários de trades e tipo de stop, se fixo ou dinâmico. OBS: alterar o parâmetro BR1 para BR.
Kindly rate and comment about the product for upgradation & Support The 5 EMA is plotted in green color ( Lime ). The 14 EMA is plotted in red color ( Red ). The 20 EMA is plotted in blue color ( Blue ). The 200 EMA is plotted in yellow color ( Yellow ). The Quarter EMA that provided calculates and plots four Exponential Moving Averages (EMAs) on the chart using different periods: 5, 14, 20, and 200. Each EMA is represented by a different color on the chart. Here's a description of each EMA:
Kindly rate and comment about the product for upgradation & Support The   5 EMA   is plotted in   green   color ( Lime ). The  14 EMA  is plotted in  red  color ( Red ). The   20 EMA   is plotted in   blue   color ( Blue ). The  200 EMA  is plotted in  black  color ( Black ). The   200 EMA   is plotted in   yellow   color ( Yellow ). The Quarter EMA that provided calculates and plots four Exponential Moving Averages (EMAs) on the chart using different periods: 5, 14, 20, and 200. Each EMA is
Turpial Pullback
Arlos Elias Rivas Romero
Indicator Type Strategy (Pullback) for all Symbols and Periodicity, Preferably from 30M periodicity. Can be used for manual trading. Its workspace corresponds to channel of 3 bars of Bill Willians. Also relies on the indicator Rsi and Atr. BUY when: There is a Green Arrow STOPLOSS to buy, below the bottom line of the channel (red line)" SELL when: There is a Red Arrow. STOPLOSS to sell, above the upper line of the channel (blue line)
Modern Spike Indicator Features: 1. Support and Resistance Lines: Displays dynamic horizontal dashed lines on the chart representing current support and resistance levels calculated from recent price swings. 2. Spike Detection Arrows: Shows up arrows (green) for potential upward spikes and down arrows (red) for potential downward spikes, triggered when price breaks S/R levels with RSI confirmation. 3. Trend Analysis: Incorporates ADX (Average Directional Index) to determine market trend stre
IKAN MFX 金融市場の変動の激しい世界では、最良の取引機会を見つけ、リスクを最小限に抑えることはすべての投資家にとって常に大きな課題です。そこで私たちは、先進的な自動取引システムであるIKAN(Intelligent Knowledge Automated Navigator)を開発しました。 IKANは単なるツールではなく、人工知能と長年の取引経験の完璧な組み合わせです。IKANは毎秒何百万ものデータポイントを分析し、市場のトレンドを特定し、価格の動きを予測し、正確な取引決定を行うことができます。 広大な金融の海を航行する船をイメージしてください。IKANは嵐の波を乗り越え、危険な暗礁を避け、目的地に安全に到達するのを助ける先進的なナビゲーションシステムです。 IKANを使えば、単なる取引ではなく、自信と安心感を持って取引ができます。IKANをあなたの金融市場攻略の旅の信頼できる仲間にしてください。 IKAN MFXは、EURUSD、GBPUSD、USDCAD、NZDUSD、AUDCAD、AUDUSD、AUDNZD、EURGBP、EURCAD、GBPCADなどの人気通貨ペアで効
Title: Dynamic SR Levels Pro Short Description: A next-generation, multi-timeframe Support & Resistance indicator that automatically detects, adapts, and invalidates key price zones based on real-time market volatility. Stop guessing, start seeing. Full Description: Tired of manually drawing support and resistance lines that quickly become outdated? Dynamic SR Levels Pro is the ultimate solution for traders who demand precision, adaptability, and a clean, clutter-free chart. This is not just ano
このプロダクトを購入した人は以下も購入しています
ARIPoint is a powerful trading companion designed to generate high-probability entry signals with dynamic TP/SL/DP levels based on volatility. Built-in performance tracking shows win/loss stats, PP1/PP2 hits, and success rates all updated live. Key Features: Buy/Sell signals with adaptive volatility bands Real-time TP/SL/DP levels based on ATR Built-in MA Filter with optional ATR/StdDev volatility Performance stats panel (Success, Profit/Loss, PP1/PP2) Alerts via popup, sound, push, or email Cu
SignalTech MT5 is a fully rule based trading system for EURUSD, USDCHF, USDJPY, AUDUSD, NZDUSD, EURJPY, AUDJPY, NZDJPY, CADJPY.  All the winning trades with chart setups are published on the comments page. 2025-12 1174 Pips 2026-01 2624 Pips 2026-02 2937 Pips 2026-03 2165 Pips 2026-04 2243 Pips It can generate signals with Buy/Sell Arrows and Pop-Up/Sound Alerts. Each signal has clear Entry and Stop Loss levels, which should be automatically flagged on the chart, as well as potential Targets 1,
Azimuth Pro
Ottaviano De Cicco
5 (7)
Azimuth Pro V2:MT5向けシンセティック・フラクタル構造分析と確認済みエントリー 概要 Azimuth Pro は Merkava Labs によるマルチレベルスイング構造インジケーターです。4つのネストされたスイングレイヤー、スイングアンカーVWAP、ABCパターン検出、3タイムフレーム構造フィルタリング、そして確定バーでの確認済みエントリー — 1つのチャートで、ミクロスイングからマクロサイクルまでを網羅するワークフロー。 これはブラインドシグナル製品ではありません。ロケーション、コンテキスト、タイミングを重視するトレーダーのための構造ファーストワークフローです。 V2発売記念オファー — Azimuth Pro V2をUSD 399で(次の100本)。最終価格:USD 499。 1. V2での変更点 シンセティック・マルチタイムフレームエンジン 上位タイムフレーム分析をMeridian Proと同じ独自のシンセティックアーキテクチャで一から再構築。よりクリーンなHTFコンテキスト、安定したライブ動作、従来のMTF同期問題なし。シンセティックエンジンは 固定比率タ
RelicusRoad Pro: 定量的市場オペレーティングシステム 【期間限定】無制限アクセス 70% OFF - 2,000人超のトレーダーと共に なぜ多くのトレーダーは「完璧な」インジケーターを使っても失敗するのでしょうか? それは、文脈を無視して 単一の概念 だけでトレードしているからです。文脈のないシグナルは単なるギャンブルです。勝ち続けるには、 根拠の重なり(コンフルエンス) が必要です。 RelicusRoad Proは単なる矢印インジケーターではありません。完全な 定量的市場エコシステム です。独自のボラティリティモデリングを用いて、価格が推移する「適正価値の道(Fair Value Road)」をマッピングし、ノイズと真の構造的ブレイクを判別します。 推測はやめましょう。機関投資家レベルの「ロード・ロジック」でトレードを。 コアエンジン:「Road」アルゴリズム システムの中心となる Road Algo は、市場環境にリアルタイムで適応するダイナミックなボラティリティチャネルです。 安全ライン(平衡点) と、価格が数学的に反転しやすい 拡張レベル を投影します。 Si
MetaTrader 5 向けスマート多層ブレイクアウト&プルバック検出器 「スマート・シンプル・ファスト!」 高確率のブレイクアウトエントリーを見逃すことにうんざりしていませんか? 複数のチャートを何時間もスキャンし、ブレイクアウトをトレンド方向と通貨のモメンタムに合わせようとして、それでも動きを逃してしまうことはありませんか? Break Pullback は、1つのインジケーターでそのすべてを解決します。 Break Pullback とは何ですか? Break Pullback は、マーケットストラクチャー、ブレイクアウト、トレンド継続のセットアップを取引するトレーダー向けに特別に設計されたプロフェッショナルグレードの MetaTrader 5 インジケーターです。 リアルタイムで複数の通貨ペアにわたるブレイクとプルバックの形成を自動的に検出し、3層の確認を通じてすべてのシグナルをフィルタリングします: ストラクチャラルブレイクアウト検出 — チャート上の主要なブレイクレベルを特定 HTF 日足バイアス — エントリーを支配的な日足トレンド方向に合わせる 通貨強弱指数 —
まず第一に、この取引ツールはノンリペイント、ノンリドロー、ノンラグの指標であり、プロの取引に理想的ですことを強調する価値があります。 オンラインコース、ユーザーマニュアル、デモ。 スマートプライスアクションコンセプトインジケーターは、新米から経験豊富なトレーダーまで、非常 に強力なツールです。Inner Circle Trader AnalysisやSmart Money Concepts Trading Strategiesなど、20以上の有用な指標を1つに組み合わせています。このインジケーターはスマートマネーコンセプトに焦点を当て、大手機関の取引方法を提供し、彼らの動きを予測するのに役立ちます。 特に、流動性分析に優れており、機関がどのように取引しているかを理解しやすくしています。市場のトレンドを予測し、価格の動きを慎重に分析するのに優れています。機関の戦略とトレードを合わせることで、市場の動向についてより正確な予測ができます。このインジケーターは多目的であり、市場構造を分析し、重要な注文ブロックを特定し、さまざまなパターンを認識するのに優れています。 このインジケーター
「 Dynamic Scalper System MT5 」インジケーターは、トレンド波の中でスキャルピング取引を行う手法のために設計されています。 主要通貨ペアと金でテスト済みで、他の取引商品との互換性があります。 トレンドに沿った短期的なポジションオープンのシグナルを提供し、追加の価格変動サポートも提供します。 インジケーターの原理 大きな矢印はトレンドの方向を決定します。 トレンド波の中では、小さな矢印の形でスキャルピングシグナルを生成するアルゴリズムが機能します。 赤い矢印は強気方向、青い矢印は弱気方向です。 トレンドの方向には敏感な価格変動ラインが描かれ、小さな矢印のシグナルと連動します。 シグナルは次のように機能します。適切なタイミングでラインが現れるとエントリーシグナルが形成され、ラインが開いている間はポジションが保持され、完了すると取引が終了します。 推奨される動作時間枠はM1~H4です。 矢印は現在のローソク足に形成され、次のローソク足が開いている場合は、前のローソク足の矢印は再描画されません。 入力パラメータ Trend Wave Period - トレ
OmniSync Projection
Antonio-alin Teculescu
5 (1)
Chronos Fractal Engine is an innovative price projection indicator for MetaTrader 5, designed to transform your technical analysis by intelligently identifying and projecting historical price patterns. Built upon an advanced correlation algorithm and the fractal principles of the market, this powerful tool visualizes potential future price movements, giving you a unique edge in your trading decisions. What is Chronos Fractal Engine? At its core, the Chronos Fractal Engine employs a sophisticat
The Zone Trading Indicator is a technical analysis tool for MetaTrader 5 that automatically identifies and displays tradable price zones across multiple timeframes to assist with structured market analysis. The indicator plots Monthly, Weekly, Daily, and H4 tradable zones , allowing traders to view higher- and lower-timeframe price areas simultaneously. These zones are designed to support one-candle–based entry approaches by highlighting predefined areas where price interaction may be monitored.
ARICoin is a powerful trading companion designed to generate high-probability entry signals with dynamic TP/SL/DP levels based on volatility. Built-in performance tracking shows win/loss stats, PP1/PP2 hits, and success rates all updated live. Key Features: Buy/Sell signals with adaptive volatility bands Real-time TP/SL/DP levels based on ATR Built-in MA Filter with optional ATR/StdDev volatility Performance stats panel (Success, Profit/Loss, PP1/PP2) Alerts via popup, sound, push, or email Cust
==================================================================== SMC Pro v6.1 APEX AI — XAUUSD Gold Empire MetaTrader 5 Indicator · Smart Money Concepts · Predictive Intelligence Engine ==================================================================== SMC Pro v6.1 APEX AI is a professional Smart Money Concepts indicator system built exclusively for XAUUSD (Gold) on MetaTrader 5. It combines the complete SMC framework — Order Blocks, Liquidity sweeps, Fair Value Gaps, Break of Structure,
マーケットメーカーのためのツール。 Meravith は次の機能を提供します: すべての時間足を分析し、現在有効なトレンドを表示します。 強気と弱気の出来高が等しくなる流動性ゾーン(出来高均衡)を強調表示します。 異なる時間足のすべての流動性レベルをチャート上に直接表示します。 テキスト形式の市場分析を生成し、参考情報として表示します。 現在のトレンドに基づいて目標値、サポートレベル、ストップロスを計算します。 取引のリスクリワード比を算出します。 口座残高に基づいてポジションサイズを計算し、潜在的な利益を推定します。 また、市場に大きな変化があった場合には警告を表示します。 インジケーターの主要ライン: 強気/弱気の出来高エグゾーストライン ― 目標値として機能します。 市場のトレンドを示すライン。市場が強気か弱気かによって色が変わり、トレンドのサポートとして機能します。主にその色が市場センチメントを示します。 出来高均衡ライン(Eq)。Eq(Volume Equilibrium)ラインはシステムの中核です。これは買い手と売り手の出来高のバランスポイントを表します。市場の流動性を示し
多くの矢印インジケーターは、シグナルだけを表示して、その後の判断をすべてトレーダーに任せてしまいます。KT Alpha Hunter Arrows は、完整なトレードプランをチャート上に提示します。 各シグナル矢印が表示されるたびに、エントリーライン、ストップロス、4つのテイクプロフィット水準、そして現在の銘柄と時間足が今トレードに値するかどうかを示すリアルタイムのエッジ判定が、すでに描画された状態で表示されます。付属の Trade Manager EA は、あなたが手動でエントリーした後の実行管理を担当し、相場が荒れて判断がぶれやすい場面でも規律あるトレードを保ちやすくします。リペイントなし。確定足シグナルのみ。Forex、ゴールド、指数、その他あなたが取引するあらゆる銘柄に対応します。 主な機能 リペイントしない買い矢印と売り矢印を、足の確定後にのみ表示。 各シグナルに、エントリーライン、構造的ストップロス、4つのテイクプロフィット水準を表示。 Edge Dashboard が、現在のチャートで買いセットアップと売りセットアップを別々に評価。 判定システム:No Edge、Mar
UZFX {SSS} スキャルピング・スマートシグナル MT5は、変動の激しい市場において正確かつリアルタイムのシグナルを求めるスキャルパー、デイトレーダー、スイングトレーダー向けに設計された、リペイントしない高性能な取引インジケーターです。(UZFX-LABS)によって開発されたこのインジケーターは、価格行動分析、トレンド確認、スマートフィルタリングを組み合わせることで、すべての通貨ペアおよび時間軸において、高確率の売買シグナルを生成します。 推奨* 最適な時間足:15分足以上。 {1時間足}が私のお気に入りです。そして、その成果は驚くべきものです...! 注:{ LTL 164343 }インジケーターと組み合わせることで、シグナルの勝率を高めることができます。 LTLシグナルでトレンドを判断し、SSSシグナルをエントリーシグナルとして活用してください。 このアプローチにより勝率が最大化され、誤ったシグナルの発生を防ぐことができます。 主な機能 スマートシグナル検出 – 強力なトレンド反転や継続パターンを正確に特定します。 マルチタイムフレーム・スキャルピング – すべての時間
Ziva LSE System
Hassan Abdullah Hassan Al Balushi
ZIVA LSE System A Professional Liquidity & Structure Execution Framework Executive Overview ZIVA LSE System is a professionally engineered analytical framework designed to interpret market behavior through structural logic and liquidity dynamics. It is not positioned as a conventional indicator. Rather, it functions as a structured execution environment that organizes price action into a clear, disciplined decision-making model. The system is built to deliver consistency, clarity, and controlled
AriX
Temirlan Kdyrkhan
1 (4)
AriX Indicator for MT5 A powerful trend-following and signal-evaluation tool AriX is a custom MT5 indicator that combines Moving Averages and ATR-based risk/reward logic to generate clear buy/sell signals. It visualizes dynamic SL/TP levels, evaluates past trade outcomes, and displays win/loss statistics in a clean on-chart panel. Key features include: Buy/Sell signals based on MA crossovers ATR-based SL/TP1/TP2/TP3 levels with visual lines and labels Signal outcome tracking with real-time stat
MightyPips Sentiment Pro is an advanced market sentiment analysis indicator for MetaTrader 5, designed to help traders better understand who is in control of the market by analyzing buying and selling pressure. Instead of relying on price alone, this indicator focuses on sentiment dynamics , comparing institutional-style buying and selling behavior against retail market activity to highlight potential trend strength, exhaustion, and directional bias. What MightyPips Sentiment Pro Does MightyP
MATADOR GOLD — XAUUSD M5 ( TimeFrame M5 ) Scalp Signals for MT5 Strategy Tester Visualization Video https://youtu.be/_cWbbyg2RSs Not every move deserves a signal. MATADOR GOLD was built for traders who prefer selective, structured, high-quality decision support over noisy, hyperactive signal tools. Designed specifically for Gold (XAUUSD / GOLD) on M5 , MATADOR helps you read short-term momentum with more discipline by combining trend logic, market-condition filters, momentum timing, spread pro
Introducing Assembler:  The best value for money,  Designed for advanced traders and professionals, yet accessible for ambitious beginners ready to elevate their trading game. Great for ICT, SMC, TREND and breakout traders . Combining advanced analytics, a sleek graphical interface, and highly customizable features, Assembler empowers you to trade with precision, clarity, and confidence. Key Features of Assembler 1. Dynamic Graphical User Interface (GUI): A fully draggable, customizable interf
Presenting one-of-a-kind Gann Indicator for XAUUSD IQ Gold Gann Levels is a non-repainting, precision tool designed exclusively for XAUUSD/Gold intraday trading. It uses W.D. Gann’s square root method to plot real-time support and resistance levels, helping traders spot high-probability entries with confidence and clarity. William Delbert Gann (W.D. Gann) was an exceptional market analyst whose trading technique was based on a complex blend of mathematics, geometry, astrology, and ancient calcul
A tool for on-chart strategy backtesting and performance analysis. A utility for developing, debugging, and testing custom trading ideas and indicator functions. An indicator designed to quickly test trading concepts and visualize the effectiveness of different input parameters. An all-in-one sandbox for testing everything from simple crossovers to complex, multi-condition trading systems.
Niveaux mensuels + PinBar + Marubozu + ALERTES (MQL5) Version : 2.0 FINAL Auteur : KOUAME N'DA LEMISSA See More Description du produit Cet indicateur avancé pour MetaTrader 5 combine l'analyse des niveaux mensuels, la reconnaissance des modèles de chandeliers japonais (PinBar et Marubozu) et un système d'alerte en temps réel. Il aide les traders à identifier rapidement les zones clés du marché et les opportunités de trading à forte probabilité. Caractéristiques principales Affichage automatiqu
トレンドに沿ってトレードする際の主な難しさは、レベルを見つけることではなく、どこが実際に有効なエントリーポイントなのかを理解することにあります。 価格はしばしばレベルに反応しますが、動きが継続しないことが多く、その結果、誤ったエントリーや機会損失につながります。 Owl Smart Levels は単にレベルを表示するだけではなく 、市場構造とプルバックに基づいてゾーンを形成します。これにより、エントリーポイントを異なる視点で評価でき、一部の誤シグナルを回避できます。 Owl Smart Levels システムに含まれるもの Owl Smart Levels は単なるレベルの表示ではなく、各要素が連携する 完全なトレードモデル です。 内容は以下の通りです: Owl Smart Levels(インジケーター) トレンド方向、プルバックゾーン、事前定義されたエントリー・StopLoss・TakeProfitレベルを表示 システムガイド 実際のトレードでのシグナルの扱い方を解説:どの状況を考慮し、どれを回避し、どのようにトレードを管理するか トレード判断チェックリスト シグナルを迅
このインジケーターは、市場で 関心が示されたゾーン をハイライトし、その後に 注文の蓄積ゾーン を表示します。 これは、大規模な**板情報(オーダーブック)**のように機能します。 これは、 巨大な資金 のためのインジケーターです。その性能は卓越しています。 市場にどんな関心が存在していても、 必ず目に見えるようになります 。 (これは 完全に再設計され、自動化されたバージョン です。もはや手動分析は必要ありません。) トランザクションスピード(取引速度) は新しい概念のインジケーターで、市場で大口注文が どこに・いつ 集中しているかを示し、それに基づいたチャンスを提供します。 トレンドの変化を 非常に早い段階 で察知することができます。 FXでは「出来高」と呼ばれているものは誤解されています。実際には、これは 時間あたりの価格変動量 です。したがって、正しい名称は トランザクションスピード です。 考え方・行動・分析の仕方すべてが問われます。 分析パラダイムの転換は非常に重要です。 このインジケーターは、FXにおける出来高の考え方を 根本から再定義 し、論理的な形で正確に活用する、
note: this indicator is for METATRADER4, if you want the version for METATRADER5 this is the link:  https://www.mql5.com/it/market/product/108106 TRENDMAESTRO ver 2.5 TRENDMAESTRO recognizes a new TREND from the start, he never makes mistakes. The certainty of identifying a new TREND is priceless. DESCRIPTION TRENDMAESTRO identifies a new TREND in the bud, this indicator examines the volatility, volumes and momentum to identify the moment in which there is an explosion of one or more of these da
ジャン・ミーウスの天文学的アルゴリズムを使用して、トレーディングチャート上に月相を表示するテクニカルインジケーターです。プロの天文台に相当する科学的精度で月の周期を表す連続した曲線を特徴としています。FX、商品、指数、株式を含む MT5 上のあらゆるシンボルと時間枠に対応しています。現在の月相、照明率、テクニカル分析のための参考レベルを表示する情報パネルを搭載しています。色とスタイルの設定は完全にカスタマイズ可能です。精密な天文計算に基づくリアルタイムの月データを提供し、トレーダーが月の情報を客観的に市場分析に組み込むことを可能にします。 このインジケーターは、当社の認証済み MQL5 シグナル「NaviMoonCycle」(ID: 2354163)で実際に使用されており、実際の OANDA ライブ口座で実資金によるトレードを行っています。このシグナルは、主要な FX 通貨ペアにおいて、本インジケーターによって特定される月の周期フェーズに基づく戦略を適用しています。 リアルタイムの結果、月次パフォーマンス、取引履歴はこちらでご確認いただけます: https://www.mql5.c
TPA True Price Action indicator reveals the true price action of the market makers through 100% non-repainting signals strictly at the close of a candle! TPA shows entries and re-entries, every time the bulls are definitely stronger than the bears and vice versa. Not to confuse with red/green candles. The shift of power gets confirmed at the earliest stage and is ONE exit strategy of several. There are available now two free parts of the TPA User Guide for our customers. The first "The Basics"
IVISTscalp5
Vadym Zhukovskyi
5 (6)
iVISTscalp5 — 時間ベースの市場予測システム iVISTscalp5は一般的なインジケーターではありません。 MetaTrader 5向けの時間ベースの予測システムであり、 市場がいつ動く可能性が高いかを特定します。 ⸻ 特徴  • 正確なタイミング  • BUY / SELL予測  • 平均利益の可能性  • 週間予測  • 120以上の金融商品 ⸻ コンセプト 市場は価格だけでなく時間によっても動く ⸻ iVISTscalp5 — 時間による優位性 iVISTscalp5インジケーターをご紹介します。このインジケーターは、トレーディングにおいて独自でありながら効果的です。時間データに基づくこのインジケーターは、多年にわたる経験と金融市場の深い分析の結果です。iVISTscalp5インジケーターは、手動トレーディングにとって優れたツールです。便利さ、簡単さ、可視化 - すべての複雑さが内部に隠されています。私たちは、iVISTscalp5インジケーターの設定と使用を最大限に簡素化しました。このインジケーターは、MT5ターミナルにあるすべての金融商品
プレミアムレベルは、正しい予測の精度が80%を超える独自の指標です。 この指標は、最高のトレーディングスペシャリストによって2か月以上テストされています。 あなたが他のどこにも見つけられない作者の指標! スクリーンショットから、このツールの正確さを自分で確認できます。 1は、1キャンドルの有効期限を持つバイナリーオプションの取引に最適です。 2はすべての通貨ペア、株式、商品、暗号通貨で機能します 手順: 赤い矢印が表示されたらすぐにダウントレードを開き、青い矢印が表示されたら閉じます。青い矢印の後に開くこともできます。 試してテストしてください!推奨設定はデフォルトです! 日足チャートで最高の精度を示します! インディケータは、2600 Pipsの収益性に対して、約10Pipsという非常に小さなマージンを使用します。
ZIVA Signal Intelligence
Hassan Abdullah Hassan Al Balushi
ZIVA Signal Intelligence An Adaptive, Modular Market Intelligence System ZIVA Signal Intelligence is not positioned as a conventional trading indicator. It is a fully integrated, proprietary market intelligence system engineered to deliver structured, high-precision interpretation of price behavior within a controlled analytical environment. Developed through an independent architectural approach, ZIVA does not rely on, derive from, or replicate existing indicators. It represents a standalone
フィルタ:
レビューなし
レビューに返信