OnBalance Indicator with MA lines

L'On-Balance Volume (OBV) è un indicatore tecnico che mette in relazione volume e prezzo per identificare i movimenti di prezzo. L'idea di base dell'OBV è che le variazioni di volume generalmente precedono le variazioni di prezzo. L'indicatore accumula i volumi per i periodi in cui il prezzo chiude in rialzo e sottrae i volumi per i periodi in cui il prezzo chiude in ribasso. Il risultato è un valore utilizzato per identificare la direzione del trend dell'asset.

L'interpretazione dell'OBV è semplice: un OBV in aumento suggerisce che gli acquirenti sono disposti a entrare o rimanere nel mercato, il che può segnalare una tendenza al rialzo. D'altro canto, un OBV in diminuzione può indicare che i venditori stanno dominando, suggerendo una possibile tendenza al ribasso.

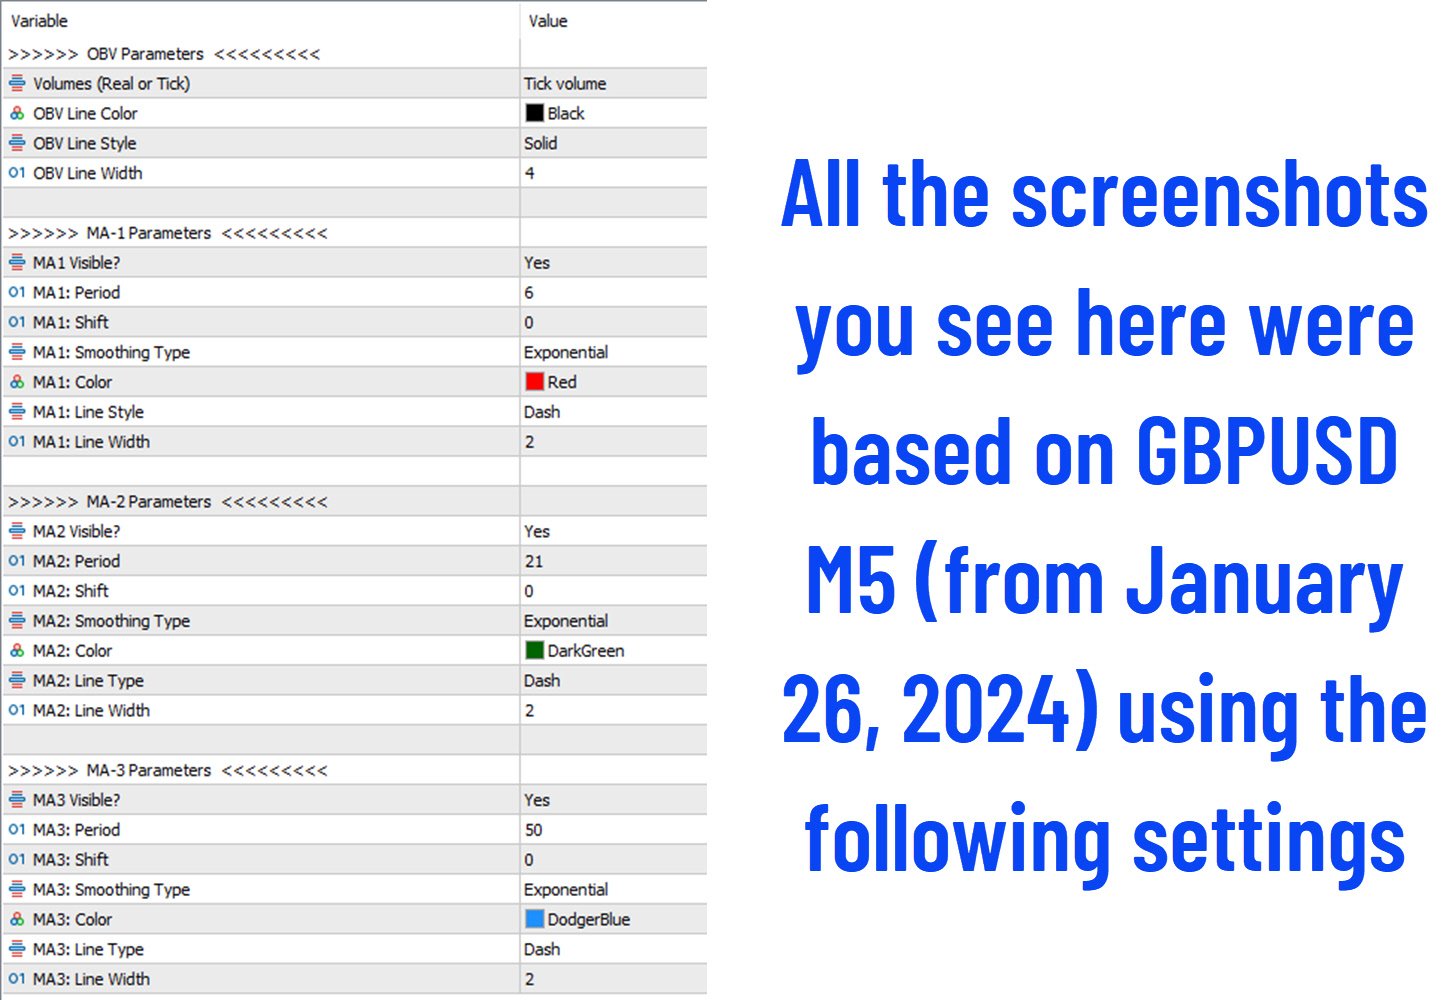
Ora è possibile utilizzare fino a tre medie mobili nel proprio segnale, semplificando il processo decisionale di trading. È sufficiente osservare l'OBV che attraversa le linee delle MA e le distanze tra di esse. Questo è l'obiettivo di OBV-MA!

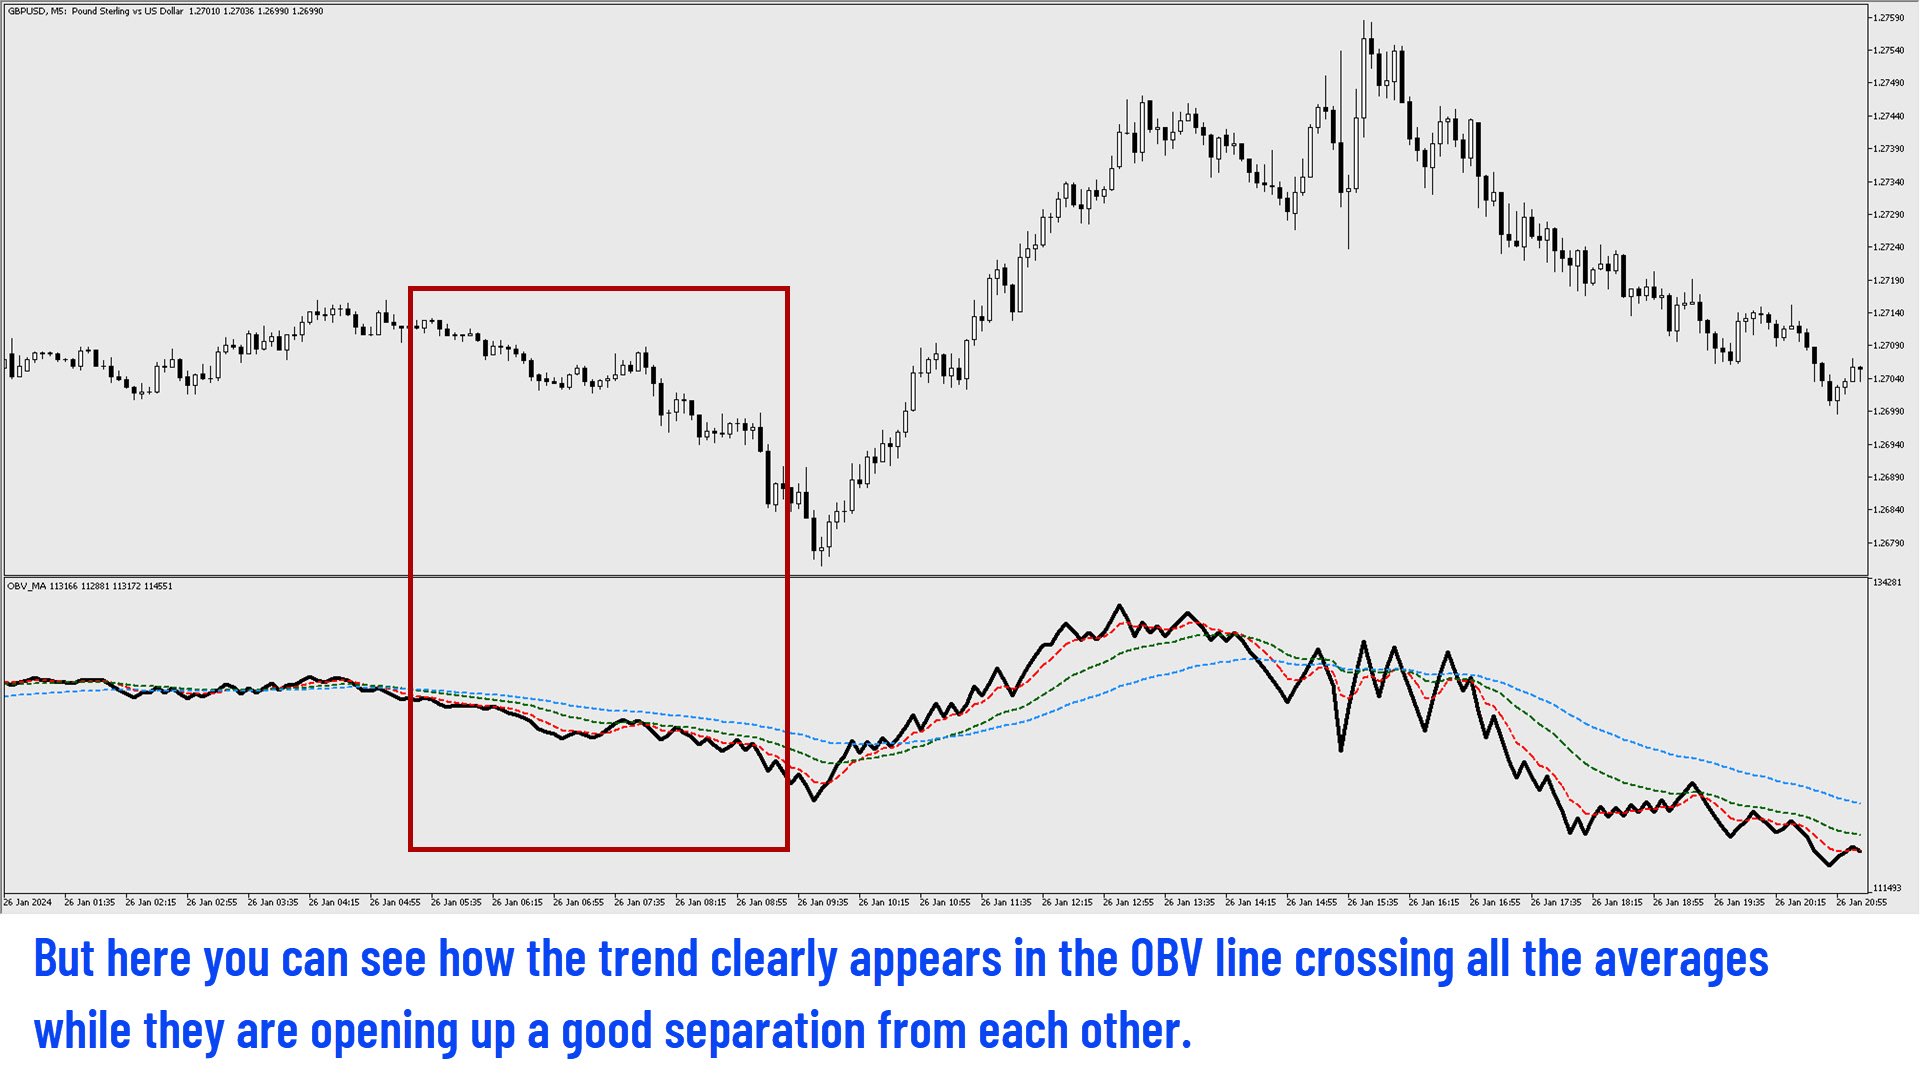
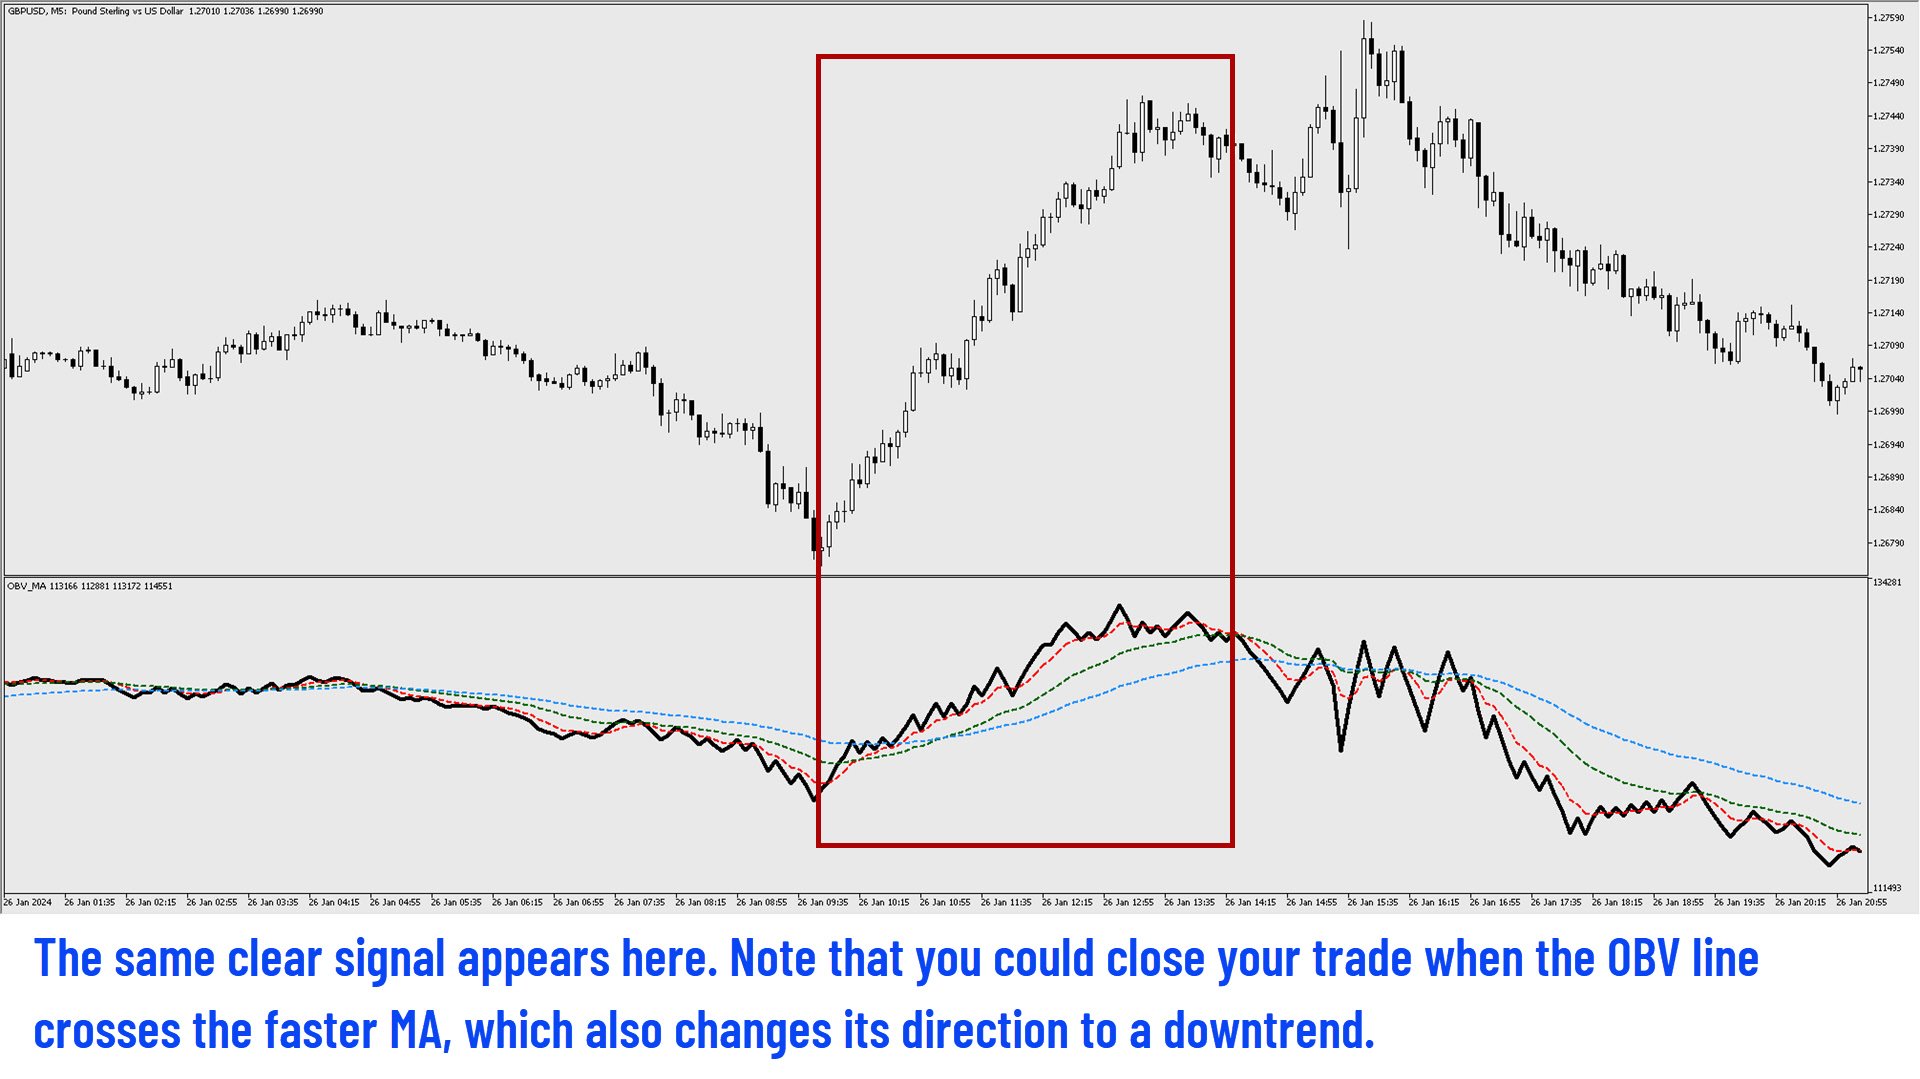
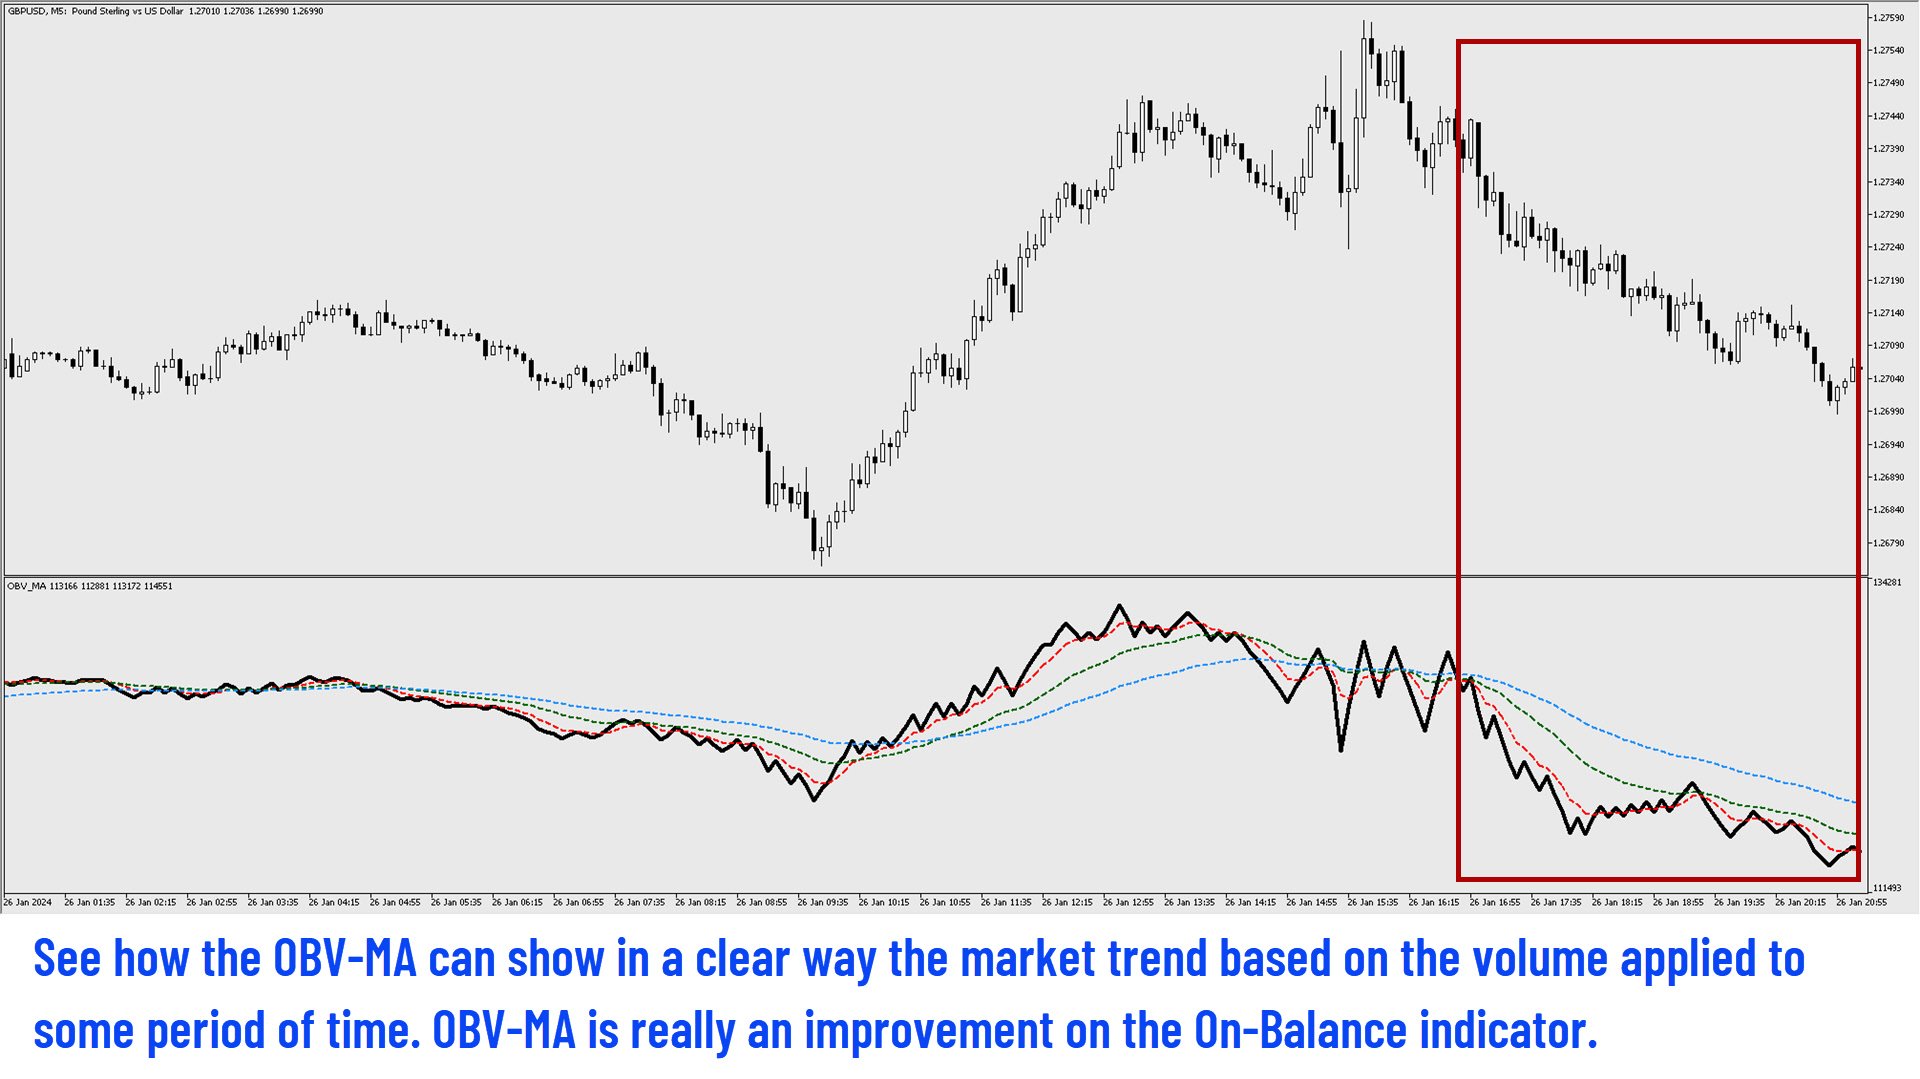
Quando la linea OBV attraversa le linee MA e queste mantengono una distanza significativa tra loro, si ha una forte indicazione di tendenza al rialzo o al ribasso. Un altro buon segnale di tendenza è quando vediamo tutte le linee (OBV e MA) nella stessa direzione, con le linee MA che mantengono una buona separazione l'una dall'altra. Anche se l'OBV incrocia la media più veloce, abbiamo comunque un segnale valido nella direzione in questione.

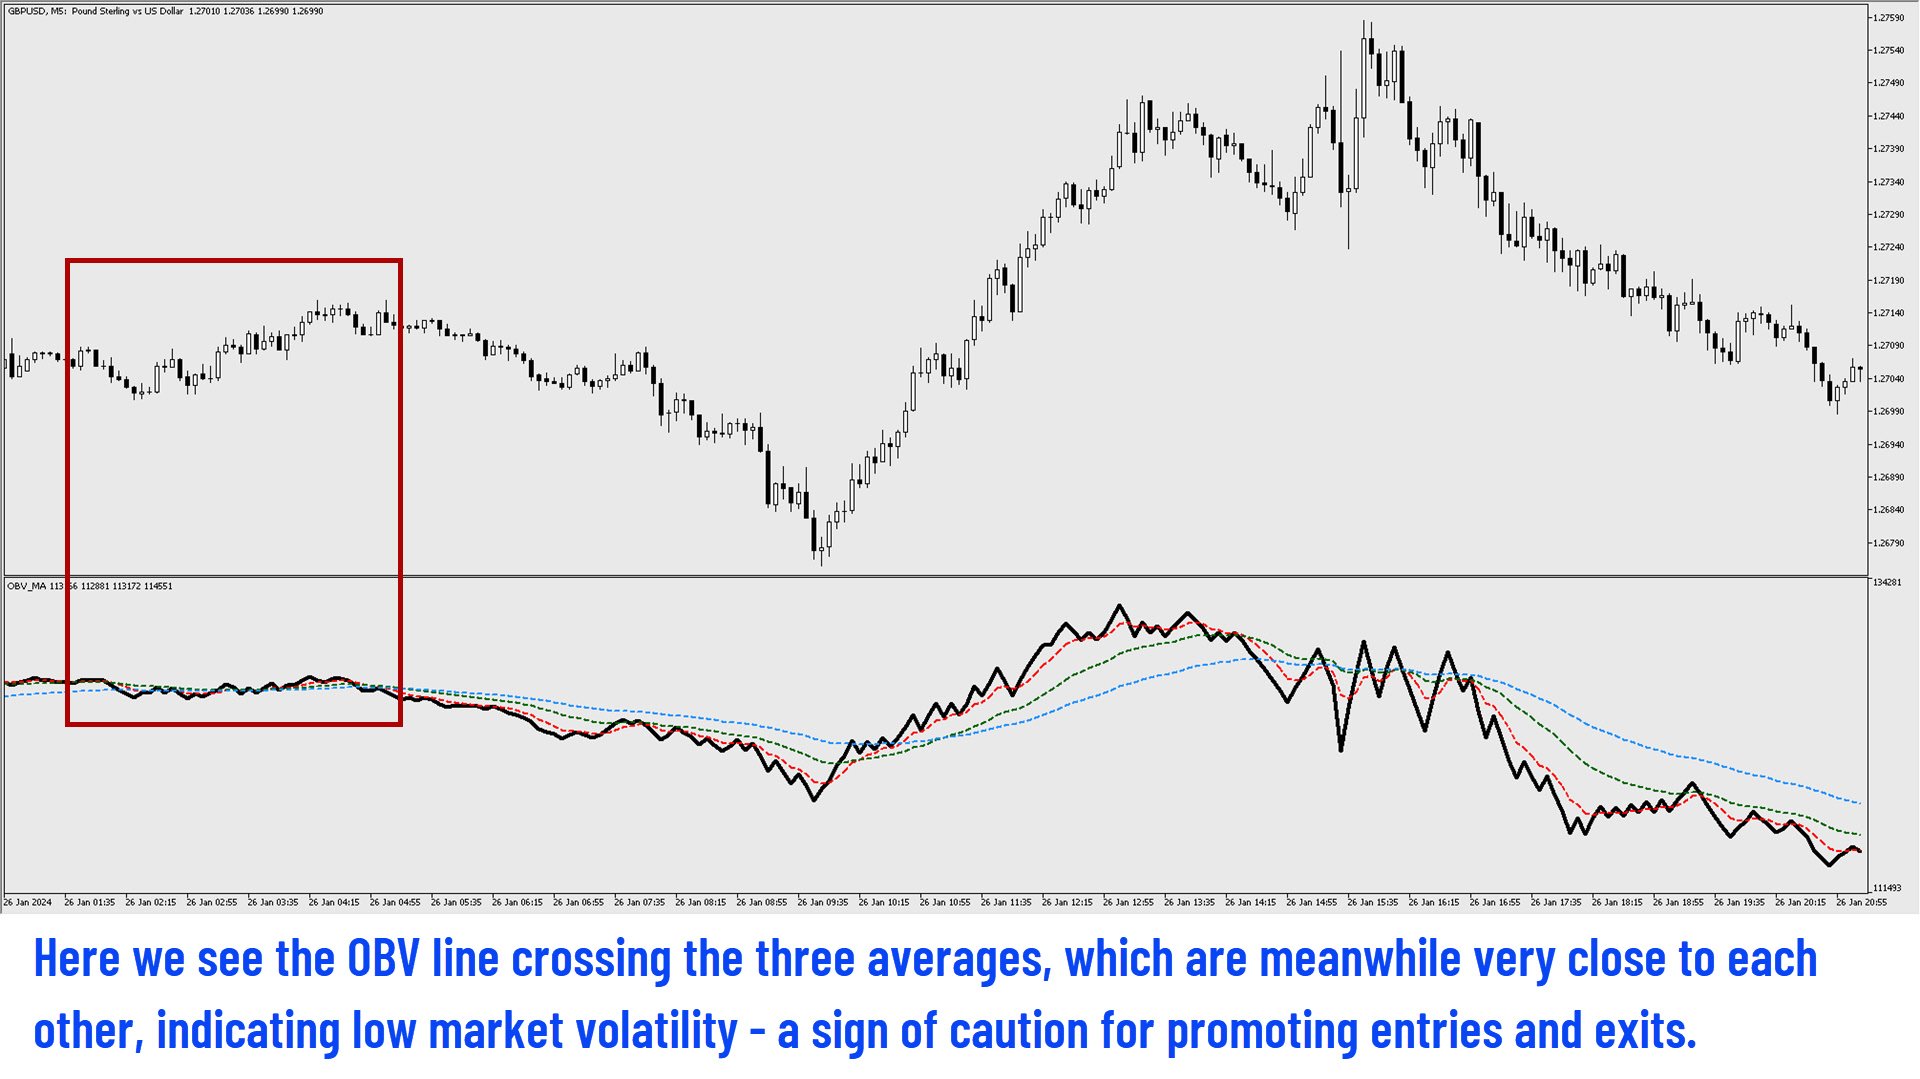
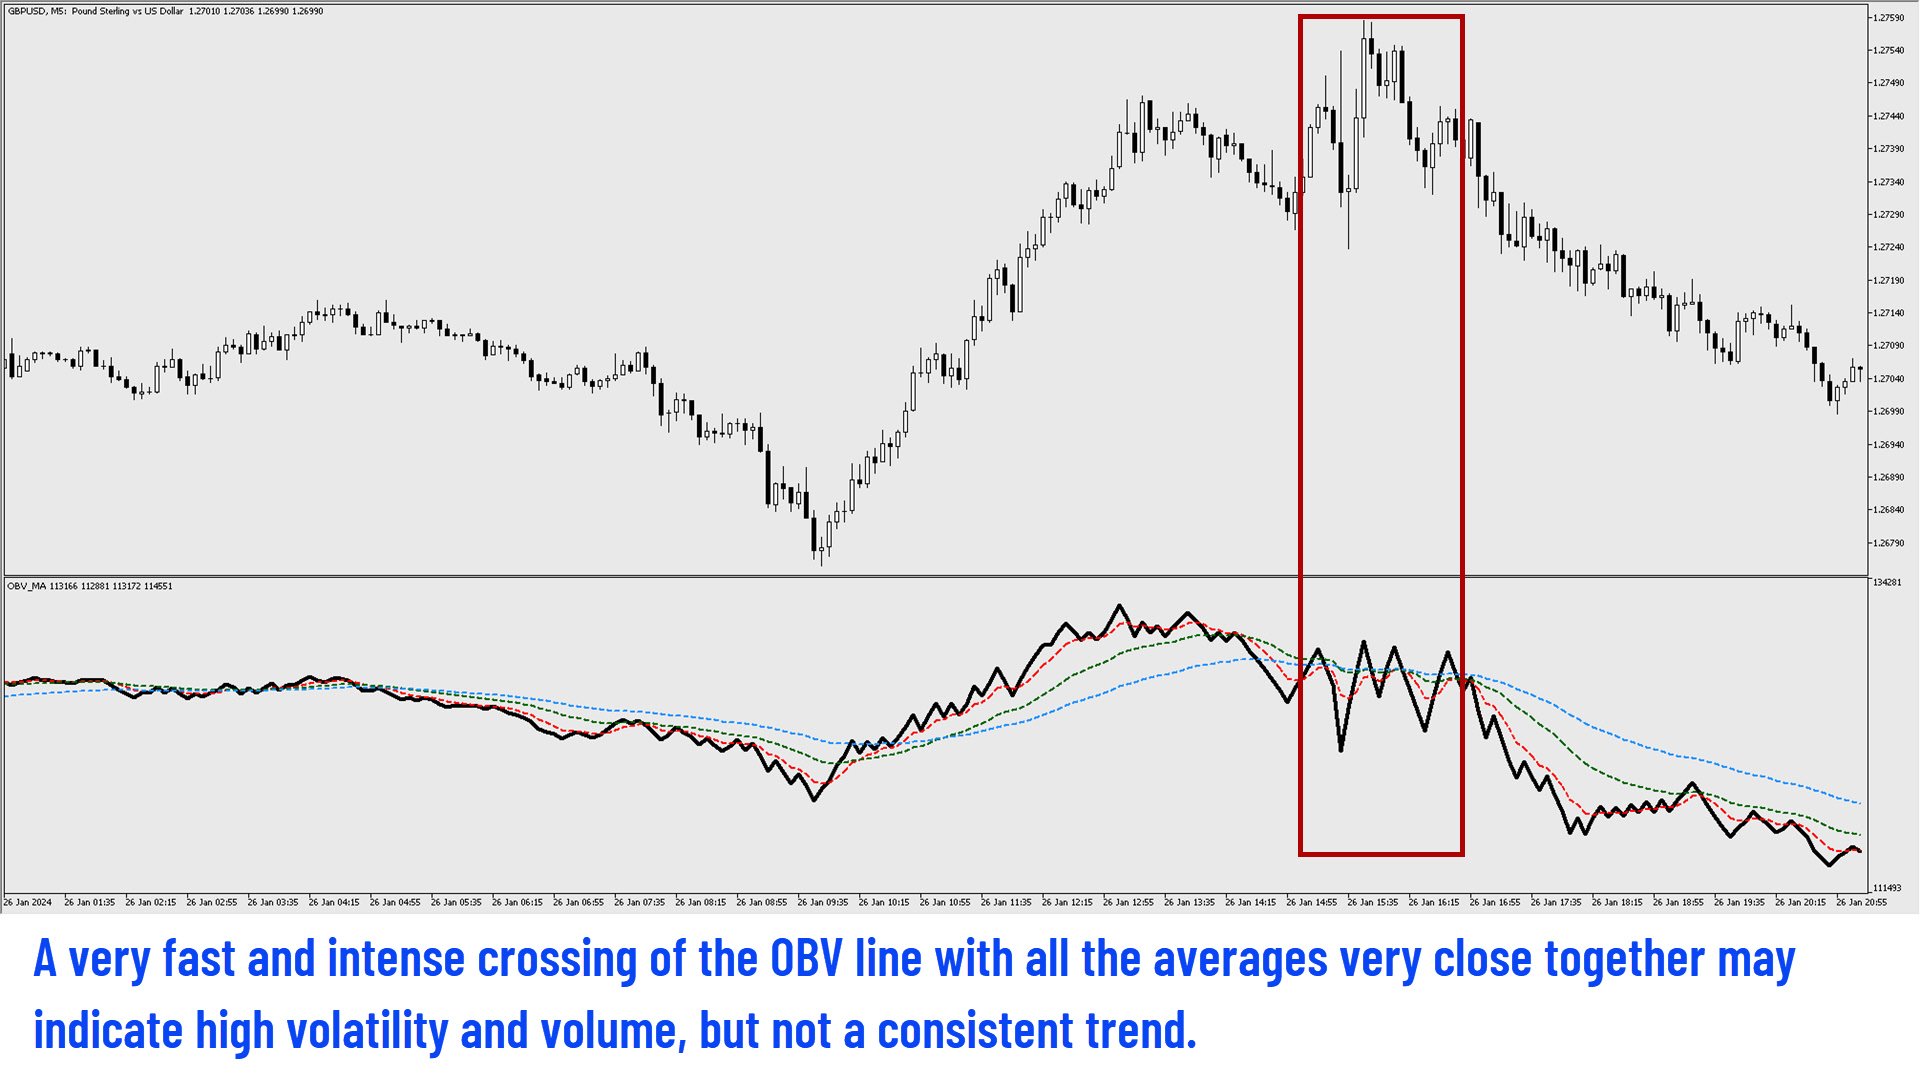
D'altra parte, se tutte le linee MA sono strettamente allineate e la linea OBV le attraversa a zig-zag, ciò indica un segnale neutro, che suggerisce cautela e scoraggia qualsiasi decisione di entrata o uscita immediata.

L'OBV-MA è un buon indicatore per supportare la vostra attuale strategia basata su segnali tecnici.

Prodotti consigliati
DM IND Exclusive
Sergio Vidal Prado
Indicador Para Opções Binarias. Indicator for Binary Options Usa dois gales. Instalar em mt5 Esse indicador é para ser usado no tempo de vela de 5 minutos e em M5. Este também funciona em M1, porém é mais eficiente em M5. Só descompactar e copiar os arquivos na pasta de dados do seu MT5. Arquivos indicator na pasta MQL5 - Indicator. Baixe também a Media Movel totalmente gratis: https://www.mql5.com/pt/market/product/50400 Esse Indicador é para a próxima vela. Apareceu a seta, só aguardar a próx
Linha de Variacao de Preco
Renato Fabio Santos Vasconcelos
ENGLISH VERSION PRICE VARIATION LINE – TAKE CONTROL OF THE MARKET! Turn the opening price into your strategic weapon Clearly see how many points or % the market moved Auto horizontal lines at the levels YOU define Mark entry, exit, target zones and explosive regions Clean, sharp, and professional layout Simple, powerful, and essential for any serious trader
PROB MULTI-TF INSTITUCIONAL Probabilidad Operativa Multitemporal con Confirmación Estructural PROB MULTI-TF INSTITUTIONAL es un indicador avanzado diseñado para traders que buscan operar con confirmación estructural real, sin señales aisladas. El sistema analiza simultáneamente múltiples temporalidades y calcula un Global Bias porcentual , mostrando de forma clara cuándo el mercado presenta mayor probabilidad de: Compra (BUY) Venta (SELL) Neutralidad (WAIT) ¿Cómo funciona? El indica
Santo Oscilator
Gustavo Goncalves
5 (1)
Oscilador bem próximo que o indicador SANTO mostrado pelo Bo Williams em sua metodologia PhiCube, para mim este indicador ainda é melhor que o próprio SANTO original. Ótimo para entender a força e tendência de movimentos e possíveis divergências. Preço fazendo topo e o SANTO não renovando máxima, tudo indica que teremos uma reversão ou no mínimo um drawback.
Veloticker
Alexandro Matos
VeloTicker PRO is a professional trading indicator designed to reveal hidden market pressure at key institutional price levels. At these levels, the market often experiences: - Liquidity concentration - Institutional participation - Price reactions (reversals or breakouts) The indicator displays two real-time gauges: BUY Pressure Gauge SELL Pressure Gauge Each gauge measures the strength of buying and selling activity based on tick volume flow. This allows traders to instantly iden
FREE
Keltner Channels (ou   Canais de Keltner ) é mais um indicador de   volatilidade   utilizado pela   análise técnica. Também chamado de   envelope , esse canal foi criado por Chester Keltner para monitorar os seus investimentos no mercado futuro de café na década de 1960. Porém, com o passar do tempo, passou também a ser utilizado para outros ativos e, atualmente, é uma das ferramentas mais utilizadas pelos traders. Nesta versão customizada foram adicionados novas opções de método de média movel
Setup Double 7s
Luigi Nunes Labigalini
Entry and exit signals from the Double 7's Strategy by Larry Connors in his book "Short Term Trading Strategies That Work". Larry claims this strategy predicted the market's direction over 80% of the time since 1995. Picking up the gains and being exposed in the market less than 25% of the time. Good for swing trading on Daily charts of SPY, Nasdaq, China's FXI, Brazil's EWZ and the majority of the equity ETFs and World Indices. How does it work? The indicator activates the buy signal when we
Send me a message so I can send you the setfile Robot robusto con diverse configurazioni disponibili, Da utilizzare con BTC su un intervallo di tempo di 10 minuti con le impostazioni nello screenshot qui sotto. Acquistando il robot esperto, hai il diritto di richiedere modifiche per continuare a migliorare il bot. Caratteristiche principali Strategia di crossover della media mobile: L'EA utilizza due medie mobili (MA1 e MA2) per generare segnali di trading. Un incrocio della MA più veloce
Draws high of the day and low of the day anchored VWAPs for multiple days.                   DaysBack = Today only, today + 1 day back, today + 2 days back...               Today recalculates live                             Historical days are computed ONCE and frozen (static).                Colors tab shows exactly 2 entries:                                  High of the day VWAP color  (default: Green)                                   Low of the day VWAP color  (default: Red)               
Probability Range Bands
Florian Nuebling
5 (1)
The indicator ‘Probability Range Bands’ gives a prediction of the amount, how much the asset is moving from its current price. The range bands give probabilities, that the candle close will not exceed this certain price level. It is also called the expected move for the current candle close.   This Indicator is based on statistical methods, probabilities and volatility. Asset price is assumed to follow a log-normal distribution. Therefore, log returns are used in this indicator to determine the
Scalping Dandruff
Daniel Yusoff Bin Asri
Scalping Dandruff Scalping Dandruff è un indicatore di mappatura strutturale multi-timeframe progettato per MetaTrader 5. Traccia automaticamente le zone chiave orizzontali di supporto e resistenza basate su specifiche Procedure Operative Standard (SOP) basate sul tempo. Identificando i massimi e minimi estremi durante specifiche finestre intraday, l'indicatore proietta questi livelli in avanti per aiutare i trader a visualizzare la struttura macro del mercato direttamente sui loro timeframe di
Projection of Phi
Nestor Jose Mendez Boza
Projection of Phi   Is a technical indicator that calculates dynamic support and resistance levels. It uses angular geometric projections and mathematical ratios to identify market expansion ranges. Features: Dynamic Fibonacci Expansion: Extension level projection Geometric Calculation: Angular analysis and mathematical ratios Visualization: Graphical objects with informative labels Compatibility: M1 to H4 timeframes Applications: Identification of zones for trade management Analysis of volatil
Heiken Ashi Suavizado
Juan Manuel Rojas Perez
4 (2)
El **Heiken Ashi Smoothed** es una versión suavizada del indicador técnico Heiken Ashi, que se utiliza en el análisis de gráficos de velas para identificar tendencias del mercado y pronosticar movimientos de precios. Este indicador se basa en el promedio de datos de precios para formar un gráfico de velas que ayuda a los traders a filtrar el ruido del mercado. **¿Para qué sirve?** Este indicador se utiliza para identificar cuándo los traders deben permanecer en una operación y cuándo está por
FREE
SmartTrendMA
Jhones Jorente Garcia
A SmartTrendMA foi projetada para identificar melhor zonas de alta, baixa e consolidação, azul alta, vermelho baixa e branco consolidação, vai te auxiliar a identificar melhor a tendência. Em parâmetro regule melhor conforme sua preferência em grau pois cada par de moeda se adequa diferentemente a cor,mude também o período e se quiser mude exponencial ou simples. 
Moving pivot Average Fibonacci The  indicator compares the selected period with its counterpart from the previous period. The indicator determines the moving Fibonacci levels for the day or any time interval to assess the price movement range from the time average. The indicator helps predict the expected high or low for the day based on historical time data. The pivot line can be considered an average trend line and use it in a variety of trading strategies. If you have any question about the
SharperTrader Sync Indicator
Valeri Colisse Dos Santos Dieizo
SharperTrader Sync Indicator SharperTrader Sync Indicator was developed for traders seeking a professional and organized interface. It allows you to keep your price chart completely clean in one window while distributing your indicators and oscillators across separate windows, keeping them all 100% synchronized. Key Features: Clean Chart Focus: Trade with a clutter-free price chart by moving your oscillators to secondary windows without losing the connection between them. Symbol & Timeframe Sync
Multi Timeframe Trend Sync
Jamille De Jesus Velasco
# Multi-Timeframe Trend Sync Pro (MTTS Pro) ## Synchronize Multiple Timeframes and Trade with Trend Confluence **MTTS Pro** is an advanced technical indicator developed for traders seeking precision in multi-timeframe analysis. By consolidating information from multiple timeframes simultaneously, the indicator identifies points of high confluence where multiple timeframes confirm the same market direction. --- ## MAIN FEATURES ### **Simultaneous Multi-Timeframe Analysis** - Monitor up t
Euro Escalper
Cristofher Robles
Euro Escalper — Indicatore Professionale di Scalping Istituzionale Euro Escalper V1 e un indicatore di trading ad alte prestazioni progettato per trader che richiedono precisione istituzionale in ogni entrata. Funziona con Indici Sintetici (Deriv), Forex e qualsiasi asset disponibile su MetaTrader 5. Combina zone di liquidita basate su Fibonacci, un motore SuperTrend integrato e un pannello di controllo professionale in tempo reale. Vantaggi Principali Senza Ridisegno: Le frecce di segnale appai
My Pivot
Ashok Kumar Singha
My Pivot is an Indicator based on Pivot Lines and Support-Resistance zones. This Indicator will Plot 11 SR zones including Pivot Line which will definitely help you to understand the exact SR zones of the Market. Steps to Setup the Indicator: Install the Custom Indicator; Set all the Lines Color, Width and Styles; Set visualization to All Timeframe; and DONE It can be used for: All Pairs: Forex, Cryptocurrencies, Metals, Stocks, Indices.  All Timeframe All Brokers All type of Trading S
Risk Guard Pro
Muniz Machado Thiago
RiskGuard PRO – Defesa Inteligente para Traders Sérios no EURJPY M15 O RiskGuard PRO é um Expert Advisor de alto desempenho, projetado exclusivamente para o par EURJPY no timeframe M15 , com foco total em preservação de capital, gestão de risco avançada e execução estratégica de múltiplas abordagens operacionais . Ao contrário dos EAs tradicionais, o RiskGuard PRO foi desenvolvido com tecnologia proprietária e arquitetura inteligente , capaz de operar com segurança mesmo em ambientes de merc
Cybertrade Auto Fibonacci
Emanuel Andriato
4.9 (10)
Cybertrade Auto Fibonacci retraction and projection  - MT5 Auto Fibonacci is an indicator that automatically plots the Fibonacci retracement and projection based on the number of bars you select in the indicator setting. You can customize nine different levels of retraction and three levels of projection. It works on periods longer than the period visible on the chart. All values ​​are available in the form of buffers to simplify possible automations. This indicator is the same one we use in ou
FREE
Signal Eskiya, in addition to channel lines, reflects entry signals in the form of arrows. Trading strategies using the channel indicator belong to the classic methods of technical analysis, are easy to execute, and therefore available even to beginners. Price ranges work equally well on any trading assets and timeframes, they can be used both independently and with additional confirmation from oscillators and market volumes. American traders say: “Trend is your friend”, which means “Trend is
Gold Trend Swing
Luis Ruben Rivera Galvez
5 (1)
Send me a message so I can send you the setfile $498 per l'introduzione, aumenterà di 100 al mese fino a raggiungere $1298 Bot di trading automatizzato per XAUUSD (ORO). Collega questo bot ai tuoi grafici XAUUSD (GOLD) H1 e lascialo operare automaticamente con una strategia comprovata! Progettato per i trader che cercano un'automazione semplice ma efficiente, questo bot esegue operazioni in base a una combinazione di indicatori tecnici e andamento dei prezzi, ottimizzato per spread bassi e m
Nebulon Smart Trap AI – Advanced Liquidity Trap Analysis for MetaTrader 5 Nebulon Smart Trap AI is a professional market analysis indicator for MetaTrader 5, developed for traders who want a more structured way to identify liquidity events, false breakouts, stop-hunt reactions, demand and supply interactions, and potential reversal zones directly from price action. Modern financial markets are heavily influenced by liquidity. Price often moves beyond obvious highs and lows, attracts breakout tra
BBVectorDynamics_Robot is an innovative trading advisor specifically designed for volatile markets. Based on unique algorithms for analyzing market forces and identifying imbalances between buyers and sellers, this advisor helps you make precise and well-considered decisions in the trading process. Main features of the bb vector dynamics_robot advisor: Calculation of dynamic vectors. System determines the differences between the extreme price values and smoothed averages over a specified perio
KT Price Border MT5
KEENBASE SOFTWARE SOLUTIONS
KT Price Border crea un canale di prezzo a tre bande che identifica le potenziali aree di massimo e minimo nel mercato. Questi livelli possono anche essere utilizzati come supporti e resistenze dinamiche. La banda centrale può essere utilizzata per identificare la direzione del trend, rendendolo un indicatore di tipo trend-following. Inoltre, la sua semplicità d’uso e la chiarezza dei segnali di trading lo rendono particolarmente utile per i trader principianti. Caratteristiche Funziona bene c
Adaptive SR Zones – Breakout Edition Adaptive SR Zones is a next-generation MetaTrader 5 indicator that automatically maps support and resistance zones and tracks breakout activity in real time. Designed for traders who rely on market structure and zone confluence, it combines multi-timeframe analysis , breakout confirmation logic , and customizable alerts into one powerful tool. No repainting. Core Features Dynamic Support & Resistance Mapping Detects zones from swing highs/lows and reaction po
Fibonacci Auto Levels Pro MT5 – Ritracciamenti, Estensioni e Punti Pivot (Pivot Points) Fibonacci Auto Levels Pro MT5 è uno strumento avanzato di analisi tecnica che rileva automaticamente i punti di swing del mercato e disegna strutture complete di Ritracciamento (Retracement), Estensione (Extension) e Punti Pivot (Pivot Point) di Fibonacci sul grafico. Questo indicatore combina diversi sistemi indipendenti in un unico strumento analitico unificato: Punti Pivot (Modalità Fibonacci) I Punti Pivo
Caicai L&S Yield Histogram Important Notice: This indicator is an integral tool of the automated EA Caicai Long and Short Pair Trading . This indicator visually displays the percentage deviation (Yield %) of a pair's current spread relative to its own historical mean. It is an excellent tool for quickly visualizing the gross financial potential of a market distortion in Long & Short operations. Main Features: Percentage Visualization: Understand the size of the distortion in palpable percentage
Buy and Sell ATR
Marco Engstermann
3 (1)
Buy and Sell ATR Indicator updated version 1.2 (2026) ATR-based trend indicator with visual signals, dynamic support/resistance, and TP/SL levels. This indicator identifies market trends using an ATR channel and displays clear Buy and Sell signals.  It draws a dynamic trend line that changes color (green for uptrend, red for downtrend), shows arrows for entries, and plots the latest Take Profit and Stop Loss levels directly on the chart. Detailed Description in the comments post 2. Set files in
FREE
Gli utenti di questo prodotto hanno anche acquistato
Neuro Poseidon MT5
Daria Rezueva
4.95 (19)
Neuro Poseidon is a new indicator by Daria Rezueva. It combines precise trading signals with adaptive TP/SL levels - creating best possible trades as a result! Message me and get  Neuro Poseidon Assistant  as a gift to automize your trading process! What makes it stand out? 1. Proven profitability on all assets and timeframes 2. Only confirmed BUY and SELL signals present on the chart 3. Adaptive TP & SL levels generated by the software for each trade 4. Easy to understand - suitable for al
PrimeScalping
Temirlan Kdyrkhan
PrimeScalping is a powerful trading companion designed to generate high-probability entry signals with dynamic TP/SL/DP levels based on volatility. Built-in performance tracking shows win/loss stats, PP1/PP2 hits, and success rates — all updated live. Key Features: Buy/Sell signals with adaptive volatility bands Real-time TP/SL/DP levels based on ATR Built-in MA Filter with optional ATR/StdDev volatility Performance stats panel (Success, Profit/Loss, PP1/PP2) Alerts via popup, sound, push, or e
SignalTech MT5 is an unique fully rule based trading system for EURUSD, USDCHF, USDJPY, AUDUSD, NZDUSD, EURJPY, AUDJPY, NZDJPY, CADJPY.  All the winning trades with chart setups are published on the comments page. 2026-05 4107 Pips (Until 05-29 NY Closed) 2026-04 2243 Pips 2026-03 2165 Pips 2026-02 2937 Pips 2026-01 2624 Pips 2025-12 1174 Pips It can generate signals with Buy/Sell Arrows and Pop-Up/Sound Alerts. Each signal has clear Entry and Stop Loss levels, which should be automatically flag
Azimuth Pro
Ottaviano De Cicco
5 (7)
Azimuth Pro V2: Synthetic Fractal Structure and Confirmed Entries for MT5 Overview Azimuth Pro is a multi-level swing structure indicator by Merkava Labs . Four nested swing layers, swing-anchored VWAP, ABC pattern detection, three-timeframe structural filtering, and closed-bar confirmed entries — one chart, one workflow from micro-swings to macro-cycles. This is not a blind signal product. It is a structure-first workflow for traders who care about location, context, and timing. V2 Launch Offe
RelicusRoad Pro MT5
Relicus LLC
4.96 (24)
RelicusRoad Pro: Sistema Operativo Quantitativo di Mercato 70% DI SCONTO ACCESSO A VITA (TEMPO LIMITATO) - UNISCITI A 2.000+ TRADER Perché la maggior parte dei trader fallisce anche con indicatori "perfetti"? Perché operano su Singoli Concetti isolati. Un segnale senza contesto è una scommessa. Per vincere serve CONFLUENZA . RelicusRoad Pro non è un semplice indicatore. È un Ecosistema Quantitativo completo . Mappa la "Fair Value Road", distinguendo tra rumore e rotture strutturali. Smetti di in
Questo prodotto è stato aggiornato per il mercato 2026 e ottimizzato per le ultime build di MT5. AVVISO DI AGGIORNAMENTO PREZZO: Smart Price Action Concepts è attualmente disponibile a $200 . Il prezzo aumenterà a $299 dopo i prossimi 30 acquisti . OFFERTA SPECIALE: Dopo l’acquisto, inviami un messaggio privato per ricevere un bonus gratuito + regalo . Prima di tutto, vale la pena sottolineare che questo strumento di trading è un indicatore non-repainting, non-redrawing e non-lagging, il che lo
ARIPoint
Temirlan Kdyrkhan
1 (1)
ARIPoint is a powerful trading companion designed to generate high-probability entry signals with dynamic TP/SL/DP levels based on volatility. Built-in performance tracking shows win/loss stats, PP1/PP2 hits, and success rates all updated live. Key Features: Buy/Sell signals with adaptive volatility bands Real-time TP/SL/DP levels based on ATR Built-in MA Filter with optional ATR/StdDev volatility Performance stats panel (Success, Profit/Loss, PP1/PP2) Alerts via popup, sound, push, or email Cu
MetaForecast M5
Vahidreza Heidar Gholami
5 (3)
MetaForecast predice e visualizza il futuro di qualsiasi mercato basandosi sull'armonia dei dati dei prezzi. Sebbene il mercato non sia sempre prevedibile, se esiste un modello nei prezzi, MetaForecast può prevedere il futuro con la massima precisione possibile. Rispetto ad altri prodotti simili, MetaForecast può generare risultati più accurati analizzando le tendenze di mercato. Parametri di input Past size (Dimensione passata) Specifica il numero di barre che MetaForecast utilizza per creare
KT Alpha Hunter Arrows MT5
KEENBASE SOFTWARE SOLUTIONS
La maggior parte degli indicatori a frecce ti dà un segnale e poi ti lascia capire da solo tutto il resto. KT Alpha Hunter Arrows ti offre un piano di trading completo. Ogni freccia di segnale appare con un piano completo già disegnato: linea di ingresso, stop loss, quattro livelli di take profit e un verdetto live sull’edge, che ti indica se quel simbolo e quel timeframe meritano davvero di essere tradati in quel momento. Il Trade Manager EA incluso gestisce l’esecuzione dopo il tuo ingresso, c
Rilevatore intelligente multistrato di breakout e pullback per MetaTrader 5 "Intelligente. Semplice. Veloce!" Sei stanco di perdere entrate su breakout ad alta probabilità? Passi ore a scansionare più grafici, cercando di allineare i breakout con la direzione del trend e il momentum delle valute — solo per perdere il movimento? Break Pullback risolve tutto questo con un solo indicatore. Cos'è Break Pullback? Break Pullback è un indicatore MetaTrader 5 di livello professionale, progettato speci
ARICoins
Temirlan Kdyrkhan
ARICoin is a powerful trading companion designed to generate high-probability entry signals with dynamic TP/SL/DP levels based on volatility. Built-in performance tracking shows win/loss stats, PP1/PP2 hits, and success rates all updated live. Key Features: Buy/Sell signals with adaptive volatility bands Real-time TP/SL/DP levels based on ATR Built-in MA Filter with optional ATR/StdDev volatility Performance stats panel (Success, Profit/Loss, PP1/PP2) Alerts via popup, sound, push, or email Cust
OmniSync Projection
Antonio-alin Teculescu
5 (1)
Chronos Fractal Engine is an innovative price projection indicator for MetaTrader 5, designed to transform your technical analysis by intelligently identifying and projecting historical price patterns. Built upon an advanced correlation algorithm and the fractal principles of the market, this powerful tool visualizes potential future price movements, giving you a unique edge in your trading decisions. What is Chronos Fractal Engine? At its core, the Chronos Fractal Engine employs a sophisticat
Ziva LSE System
Hassan Abdullah Hassan Al Balushi
ZIVA LSE System A Professional Liquidity & Structure Execution Framework Executive Overview ZIVA LSE System is a professionally engineered analytical framework designed to interpret market behavior through structural logic and liquidity dynamics. It is not positioned as a conventional indicator. Rather, it functions as a structured execution environment that organizes price action into a clear, disciplined decision-making model. The system is built to deliver consistency, clarity, and controlled
AriX
Temirlan Kdyrkhan
1 (4)
AriX Indicator for MT5 A powerful trend-following and signal-evaluation tool AriX is a custom MT5 indicator that combines Moving Averages and ATR-based risk/reward logic to generate clear buy/sell signals. It visualizes dynamic SL/TP levels, evaluates past trade outcomes, and displays win/loss statistics in a clean on-chart panel. Key features include: Buy/Sell signals based on MA crossovers ATR-based SL/TP1/TP2/TP3 levels with visual lines and labels Signal outcome tracking with real-time stat
Gem SIGNAL
Shengzu Zhong
5 (1)
GEM Signal Pro GEM Signal Pro è un indicatore trend-following per MetaTrader 5, progettato per i trader che desiderano segnali più chiari, configurazioni operative più strutturate e una gestione del rischio più pratica direttamente sul grafico. Invece di mostrare solo una semplice freccia, GEM Signal Pro aiuta a presentare l’intera idea di trading in modo più chiaro e leggibile. Quando le condizioni sono confermate, l’indicatore può mostrare sul grafico il prezzo di ingresso, lo stop loss e gli
Presenting one-of-a-kind Gann Indicator for XAUUSD IQ Gold Gann Levels is a non-repainting, precision tool designed exclusively for XAUUSD/Gold intraday trading. It uses W.D. Gann’s square root method to plot real-time support and resistance levels, helping traders spot high-probability entries with confidence and clarity. William Delbert Gann (W.D. Gann) was an exceptional market analyst whose trading technique was based on a complex blend of mathematics, geometry, astrology, and ancient calcul
The Zain GOLD indicator
Haitham Gamal Abdelnaser Mohamed
Specializing in (All brokers supported): Professional Trading Tools Want the same tools used by professional traders? Get them now and start dominating the markets! Join our premium communities for free: Specializing in (All brokers supported): Gold (XAUUSD) - Unmatched accuracy Forex Pairs - Comprehensive global market coverage Binary Options - Highly accurate signals ️ Synthetic Derivatives - Trade pairs using Drive Cryptocurrencies - Professional cryptocurrency trad
CGE Trading Suite
Carl Gustav Johan Ekstrom
5 (2)
Institutional-Grade Analytics for MT5 C GE Trading Suite delivers the analytical edge typically reserved for professional trading desks. The platform integrates a full suite of analytical tools into one seamless workflow: dynamic grid mapping, liquidity behavior analysis, ECM, trend lines, MIDAS, trade cycles, and directional channel projections. Together, these provide a unified view of market structure and momentum. Directional clarity is further enhanced by the capital flow index, which meas
L'indicatore UZFX {SSS} Scalping Smart Signals MT5 è un indicatore di trading ad alte prestazioni che non si aggiorna (non repaint) progettato per scalper, day trader e swing trader che necessitano di segnali accurati e in tempo reale in mercati in rapida evoluzione. Sviluppato da (UZFX-LABS), questo indicatore combina l'analisi dell'andamento dei prezzi, la conferma del trend e un filtraggio intelligente per generare segnali di acquisto e vendita ad alta probabilità su tutte le coppie di valute
The Zone Trading Indicator is a technical analysis tool for MetaTrader 5 that automatically identifies and displays tradable price zones across multiple timeframes to assist with structured market analysis. The indicator plots Monthly, Weekly, Daily, and H4 tradable zones , allowing traders to view higher- and lower-timeframe price areas simultaneously. These zones are designed to support one-candle–based entry approaches by highlighting predefined areas where price interaction may be monitored.
The Propfolio Master Suite is the ultimate all-in-one analytical workstation for professional traders. Combining the power of the Beat The Market Maker (BTMM) methodology, Smart Money Concepts (SND/Liquidity), and Advanced Volume Profile, this suite replaces multiple different indicators with one optimized engine. Monitor up to 14 pairs simultaneously from a single chart, instantly identify market cycles, and seamlessly map institutional footprints with the click of a button. The Command Center
MightyPips Sentiment Pro is a market sentiment indicator for MetaTrader 5 designed to help traders analyze buying and selling pressure in the market. The indicator evaluates market behavior to provide a clearer view of trend direction, momentum strength, and overall sentiment conditions. It helps traders understand whether buyers or sellers are currently dominating the market. Features Buyer vs Seller Analysis Displays the balance between buying and selling pressure using real-time market data.
The AX Forex Indicator MT5 is a sophisticated trading tool designed to provide traders with a comprehensive analysis of multiple currency pairs. This   powerful indicator   simplifies the complex nature of the forex market, making it accessible for both novice and experienced traders. AX Forex Indicator uses   advanced algorithms   to detect trends, patterns and is an essential tool for traders aiming to enhance their forex trading performance. With its robust features, ease of use, and reliabl
QuasarEdge
Yuki Miyake
1 (1)
[Special Limited Price] Release Commemoration Sale! Currently available at a special price to celebrate its release. The price will revert to normal without notice after a certain period or sales volume. Don't miss this chance to get a pro-level trading environment at the lowest price! Quasar Edge & Dual Dashboard ~ Transform the "chaos" of 28 pairs into "confident profits" with the ultimate MT5 market structure system ~ The reason many traders lose isn't due to indicator performance, but
==================================================================== SMC Pro v6.1 APEX AI — XAUUSD Gold Empire MetaTrader 5 Indicator · Smart Money Concepts · Predictive Intelligence Engine ==================================================================== SMC Pro v6.1 APEX AI is a professional Smart Money Concepts indicator system built exclusively for XAUUSD (Gold) on MetaTrader 5. It combines the complete SMC framework — Order Blocks, Liquidity sweeps, Fair Value Gaps, Break of Structure,
Big Player Range
Thalles Nascimento De Carvalho
5 (3)
BigPlayerRange – Il miglior indicatore per MT5 BigPlayerRange è considerato il miglior indicatore per Mini Indice e Mini Dollaro su MetaTrader 5. Questo strumento essenziale evidenzia le zone strategiche di azione dei grandi player, offrendo un’analisi tecnica istituzionale di altissima precisione. Come usare BigPlayerRange: Questo indicatore mostra zone di acquisto (linea verde) e di vendita (linea rossa). Quando il prezzo chiude fuori da queste aree, è probabile un movimento di tendenz
Il livello Premium è un indicatore unico con una precisione superiore all'80% delle previsioni corrette! Questo indicatore è stato testato dai migliori Specialisti di Trading per più di due mesi! L'indicatore dell'autore che non troverai da nessun'altra parte! Dagli screenshot puoi vedere di persona la precisione di questo strumento! 1 è ottimo per il trading di opzioni binarie con un tempo di scadenza di 1 candela. 2 funziona su tutte le coppie di valute, azioni, materie prime, criptovalu
Gold Xausd Hunter
Metin Erkamoglu
5 (1)
MATADOR GOLD XAUUSD M5 Scalp Signals for MT5 MATADOR GOLD is a decision-support indicator for MetaTrader 5, designed for traders who analyze short-term Gold movement on the M5 timeframe. The indicator does not open, close, or manage trades automatically. It provides buy and sell signal guidance so the user can make their own trading decisions according to their risk plan, broker conditions, and trade management rules. Main purpose MATADOR GOLD is built to help traders avoid noisy signal flow and
L'indicatore " Dynamic Scalper System MT5 " è progettato per il metodo di scalping, ovvero per il trading all'interno di onde di trend. Testato sulle principali coppie di valute e sull'oro, è compatibile con altri strumenti di trading. Fornisce segnali per l'apertura di posizioni a breve termine lungo il trend, con ulteriore supporto al movimento dei prezzi. Il principio dell'indicatore. Le frecce grandi determinano la direzione del trend. Un algoritmo per generare segnali per lo scalping sott
Assembler
Darko Licardo
5 (1)
Introducing Assembler:  The best value for money,  Designed for advanced traders and professionals, yet accessible for ambitious beginners ready to elevate their trading game. Great for ICT, SMC, TREND and breakout traders . Combining advanced analytics, a sleek graphical interface, and highly customizable features, Assembler empowers you to trade with precision, clarity, and confidence. Key Features of Assembler 1. Dynamic Graphical User Interface (GUI): A fully draggable, customizable interf
Altri dall’autore
Keltner Enhanced
David Ben Svaiter
Keltner-Enhanced migliora l'accuratezza e la leggibilità dei canali Keltner con molte opzioni di regolazione e cinque calcoli di prezzo in più rispetto al META predefinito. L'indicatore Keltner-E è un indicatore a bande simile alle Bande di Bollinger e agli Inviluppi delle medie mobili. Consiste in un inviluppo superiore al di sopra di una linea mediana e in un inviluppo inferiore al di sotto della linea mediana.  I principali eventi a cui prestare attenzione quando si utilizzano i canali Kel
FREE
Quante volte avete cercato un PIVOT che funzionasse su una candela specifica ogni giorno? Molti trader amano stimare la direzione del trend del giorno in base a un momento specifico, come 30 minuti dopo l'apertura del mercato, o alle 12.00, e così via. Questo indicatore consente di specificare un determinato orario (ora e minuti) e traccia un pivot da quell'ora al giorno successivo alla stessa ora. Mostra cinque linee basate su quella specifica candela/ora: mediana, massimo, minimo, supporto
FREE
Il Jurik Advanced MA (JurMA) è un indicatore tecnico non grafico sviluppato sulla base del JMA originale ideato da Mark Jurik.  È stato progettato per ridurre il ritardo presente nelle medie mobili tradizionali, migliorare la scorrevolezza e ridurre il rumore. JurMA si adatta alla volatilità del mercato e può essere regolato dall'utente per quanto riguarda la sensibilità, rendendolo utile per identificare tendenze e inversioni nei mercati finanziari. Questa adattabilità ed efficienza lo rendono
Trend On Close
David Ben Svaiter
TrendOnClose è un sofisticato indicatore progettato per gli investitori del mercato binario, incentrato sull'analisi statistica delle tendenze e delle controtendenze all'interno di specifici cicli di candele. Ogni ciclo è definito dal prezzo di chiusura della candela, che stabilisce la direzione della tendenza (SU/GIU' - TORO/BORSO) per le successive analisi statistiche fino all'inizio del ciclo successivo. L'analisi statistica opera con due configurazioni: ⦁ Obiettivo statistico come CANDELA
HAshi-E è un modo migliorato di analizzare i segnali Heiken-Ashi. Briefing: L'Heiken-Ashi è particolarmente apprezzato per la sua capacità di filtrare la volatilità a breve termine, che lo rende uno strumento privilegiato per identificare e seguire le tendenze, aiuta a prendere decisioni sui punti di entrata e di uscita e aiuta a distinguere tra falsi segnali e vere inversioni di tendenza. A differenza dei tradizionali grafici a candele, le candele Heiken-Ashi sono calcolate utilizzando i val
Designed by Welles Wilder for daily commodity charts, the ADXW is now used in various markets by technical traders to assess the strength of a trend or even a trend for short- or long-term trades. The ADXW uses a positive (DI+) and negative (DI-) directional indicator in addition to its trend line (ADX). According to Wilder, a trend has strength when the ADX signal is above 25; the trend is weak (or the price has no trend) when the ADX is below 20. The absence of a trend does not mean that th
In the realm of technical analysis, ParbMA emerges as a highly intuitive tool for examining the Parabolic SAR trend . This innovative approach leverages a customizable line, distinguished by its versatility in color, shape, and width options. Such flexibility enhances visual analysis and significantly aids in strategizing and decision-making. The ParbMA (Parabolic Moving Average) is a custom technical indicator that combines the concepts of J. Welles Wilder's Parabolic SAR (Stop and Reverse) a
Slow AMA
David Ben Svaiter
Compared to simple or exponential moving averages, slow adaptive trend lines might offer a more nuanced view of the trend by adjusting their sensitivity based on market conditions. However, their slow nature might also mean they are late in signaling reversals when market conditions change rapidly - and that is the difference between them and our SlowAMA . SlowAMA was designed to be a better long-term trend indicator than EMA and other Moving Averages. It uses our JurMA calculations, reducing
HAshi-E è un modo migliorato di analizzare i segnali Heiken-Ashi. Briefing: L'Heiken-Ashi è particolarmente apprezzato per la sua capacità di filtrare la volatilità a breve termine, che lo rende uno strumento privilegiato per identificare e seguire le tendenze, aiuta a prendere decisioni sui punti di entrata e di uscita e aiuta a distinguere tra falsi segnali e vere inversioni di tendenza. A differenza dei tradizionali grafici a candele, le candele Heiken-Ashi sono calcolate utilizzando i val
Quante volte avete cercato un PIVOT che funzionasse ogni giorno su uno specifico timeframe? Molti trader amano stimare la direzione del trend del giorno in base a uno specifico intervallo di tempo giornaliero, ad esempio da 2 ore prima dell'apertura del NYSE a 1 ora dopo, oppure dall'apertura del NYSE a 30 minuti dopo. Questo indicatore consente di specificare un determinato intervallo di tempo (ora e minuto) e traccia un pivot da quell'intervallo al giorno successivo nello stesso intervallo
VIDYA Enhanced
David Ben Svaiter
L'indicatore VIDYA-ENHANCED (Variable Index Dynamic Average) è uno strumento di analisi tecnica utilizzato per identificare tendenze e movimenti laterali. Regola dinamicamente la sua sensibilità in base alla volatilità del mercato, utilizzando il Chande Momentum Oscillator come indice di volatilità. Questa caratteristica permette a VIDYA-ENHANCED di essere più agile durante i periodi di movimenti significativi dei prezzi, rimanendo più stabile durante le fasi di minore volatilità.  Caratteris
Filtro:
Nessuna recensione
Rispondi alla recensione