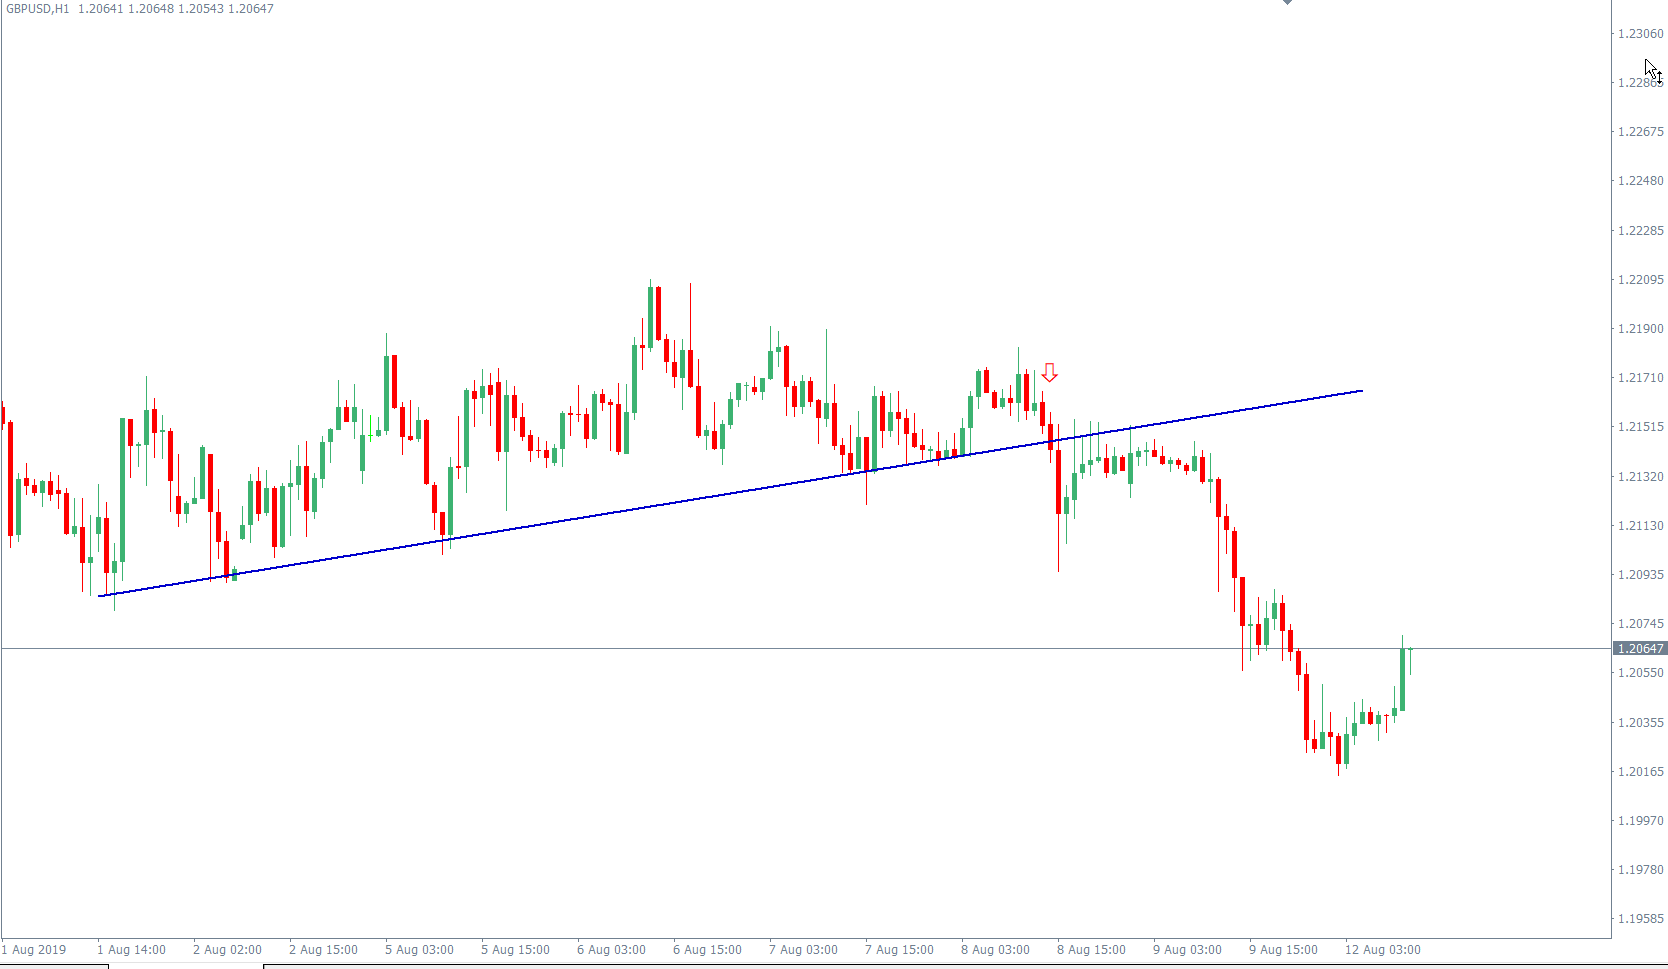
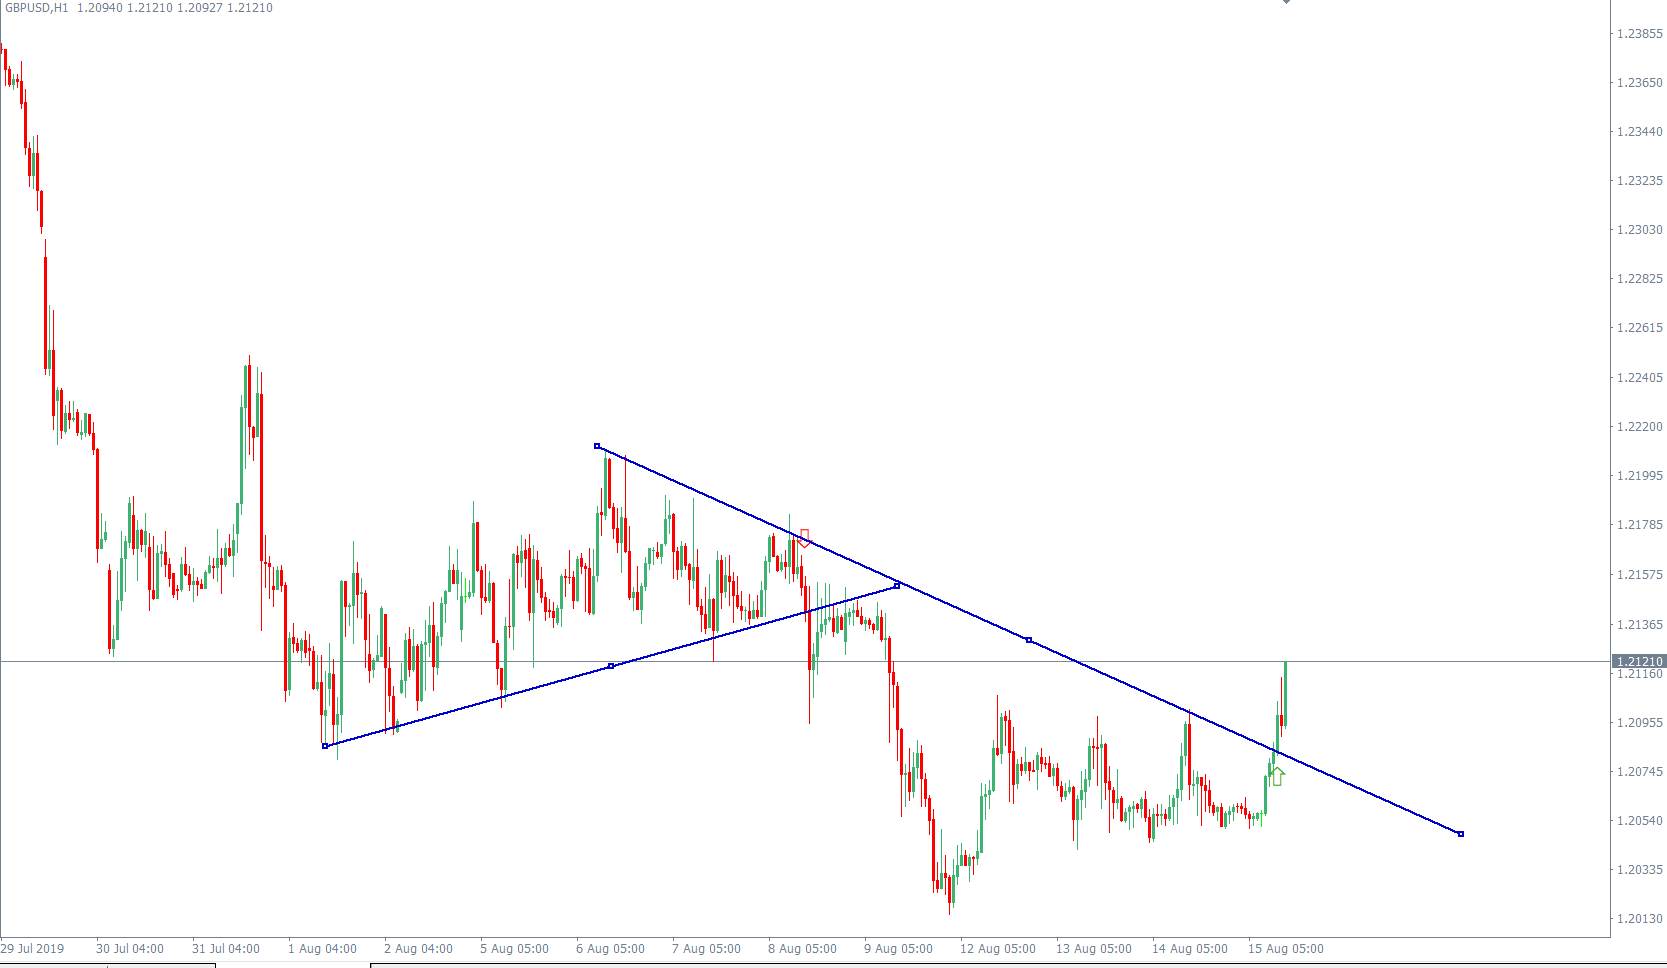
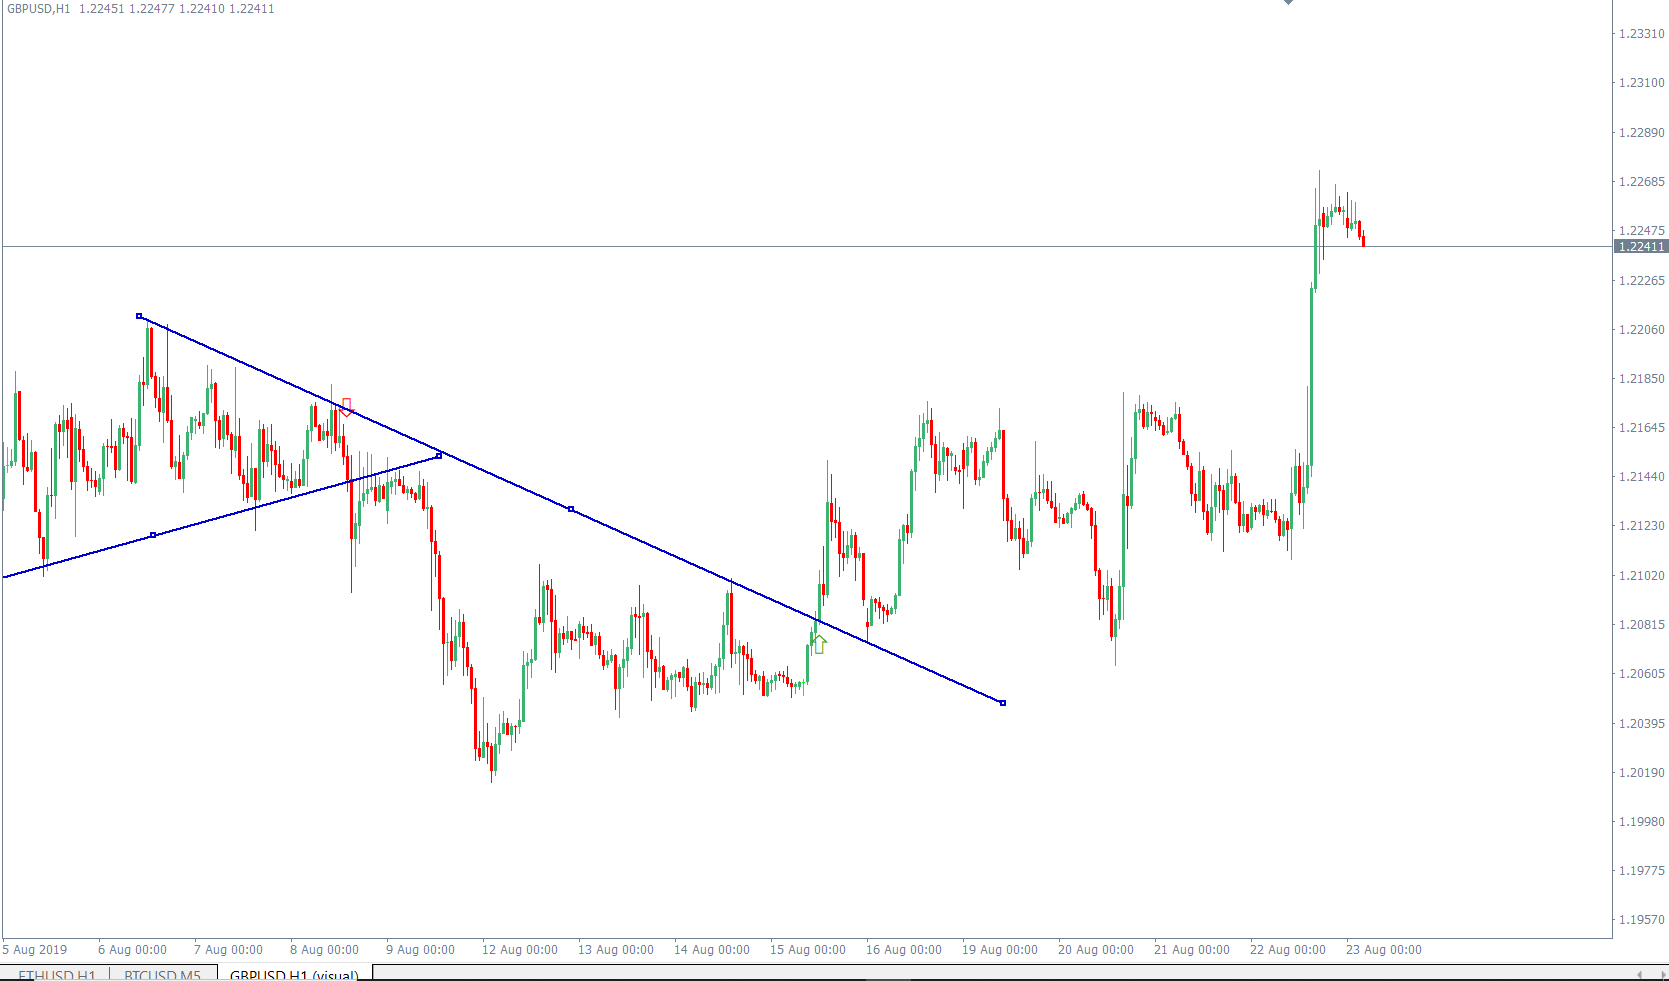
Trend Line Break Signal Alert
- インディケータ
- バージョン: 1.0
- アクティベーション: 10

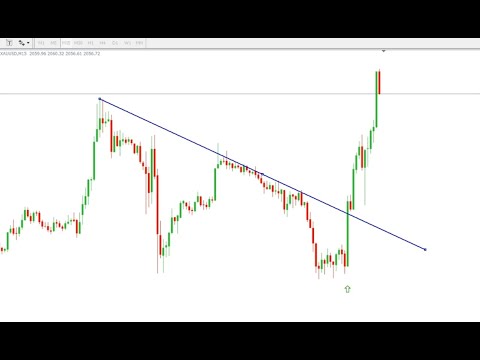
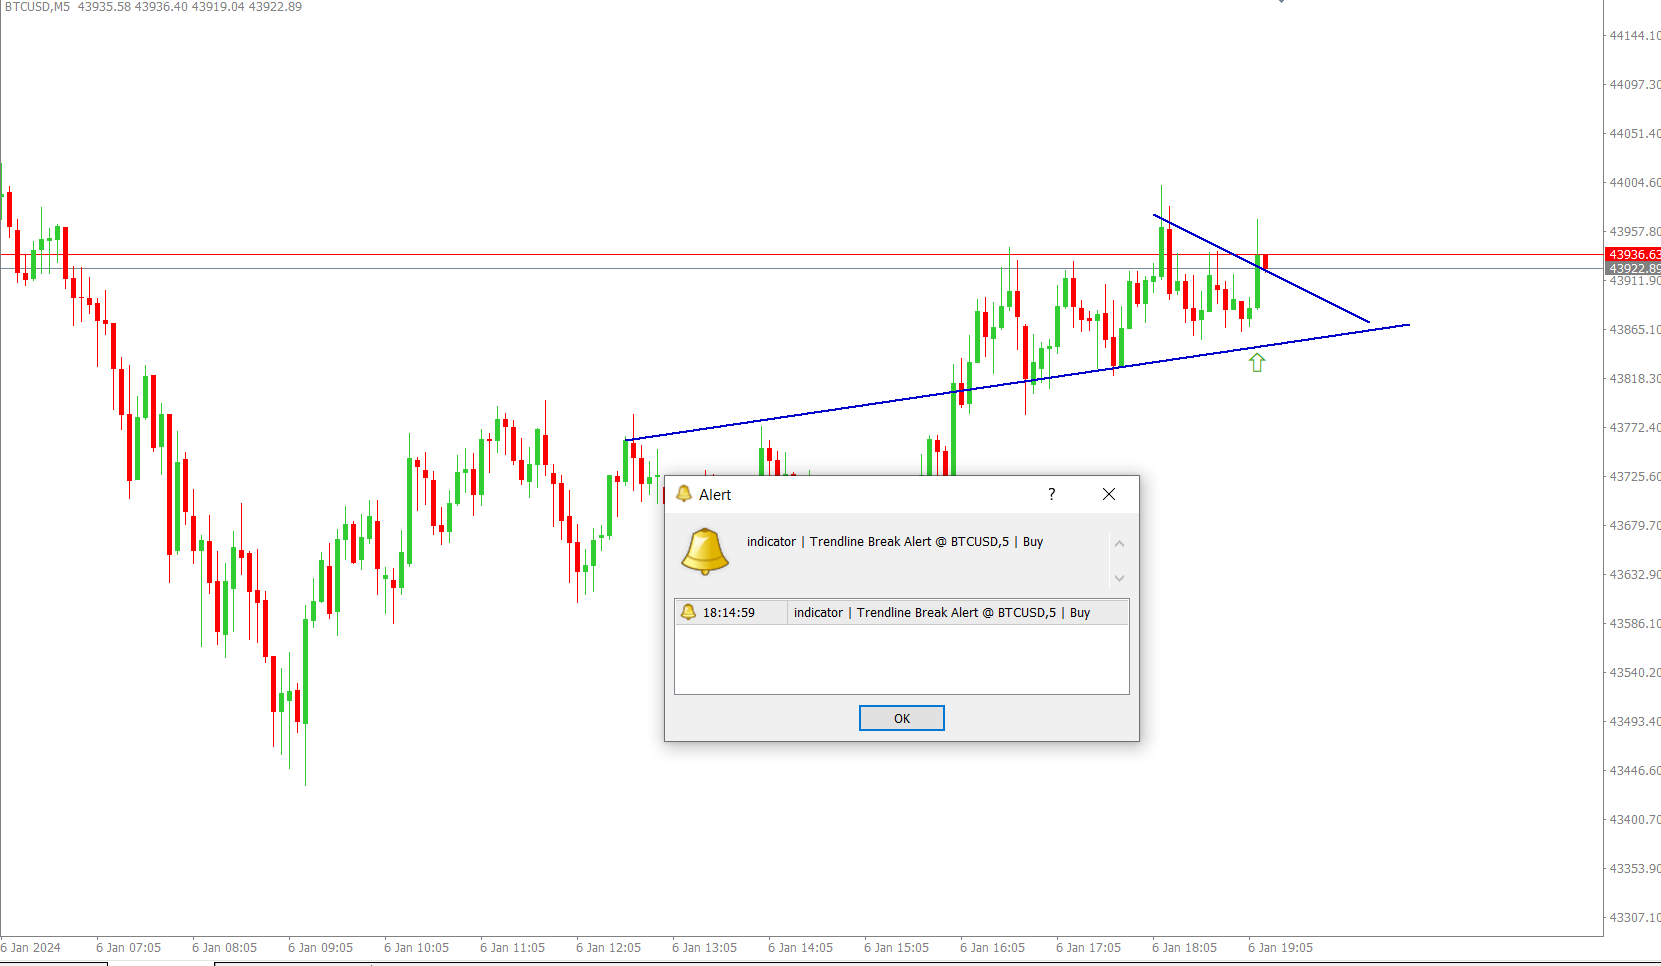
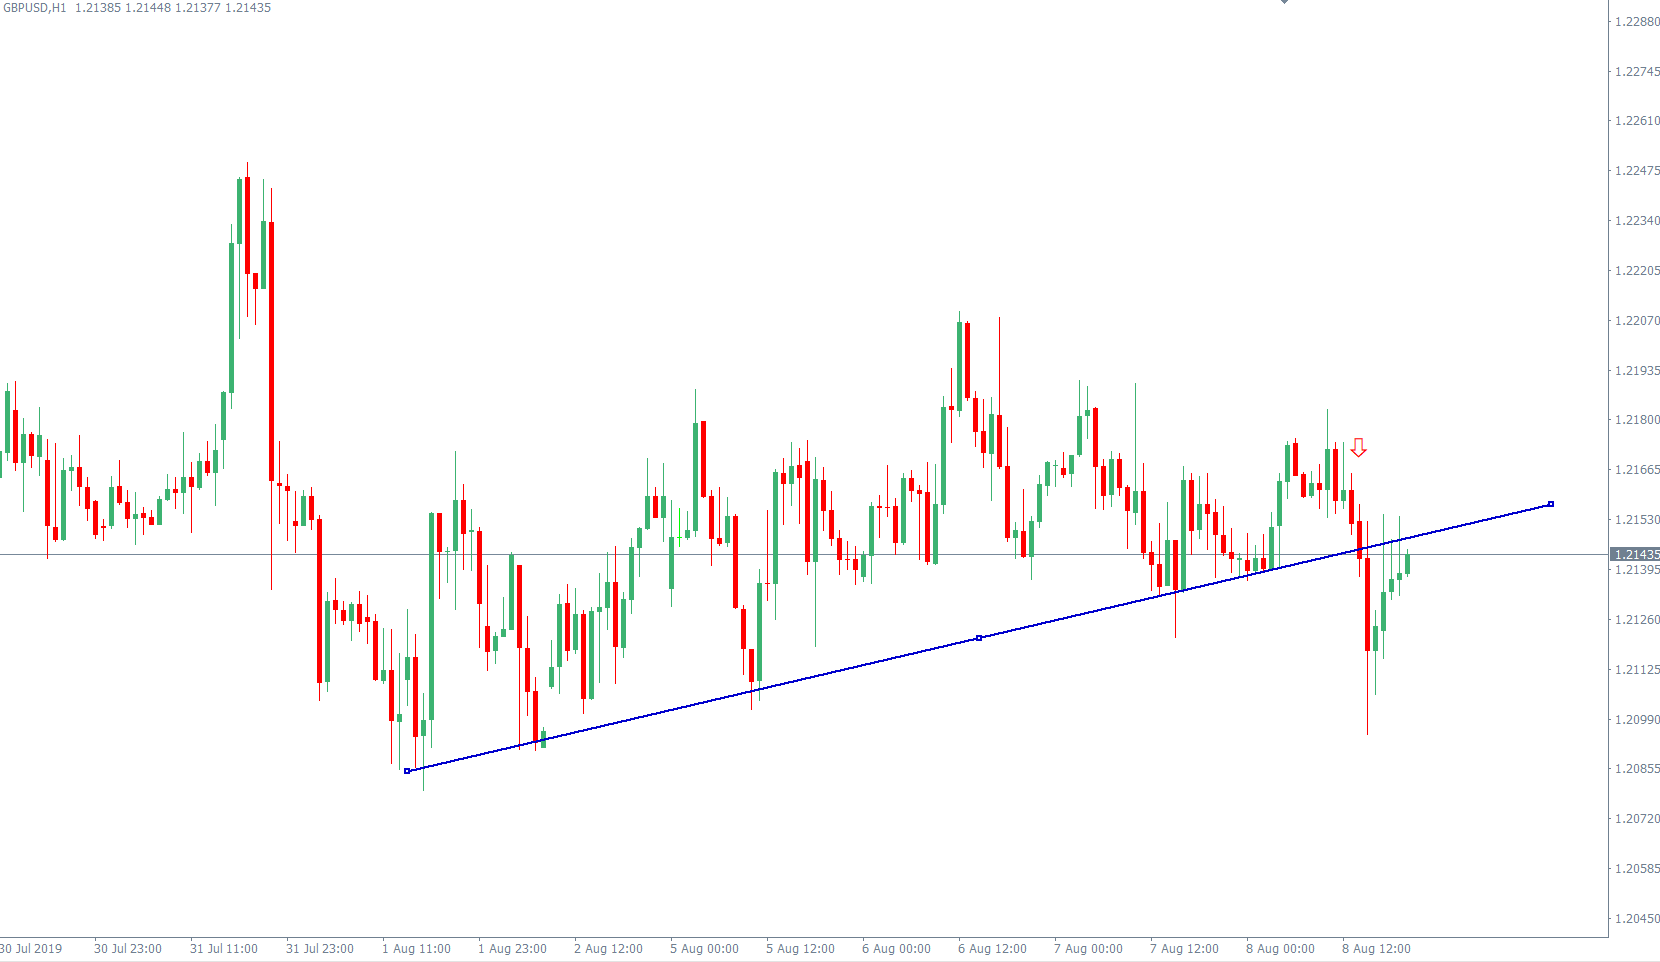
これはトレンドラインのブレイクに関するアラートを提供するシンプルなインジケーターです。
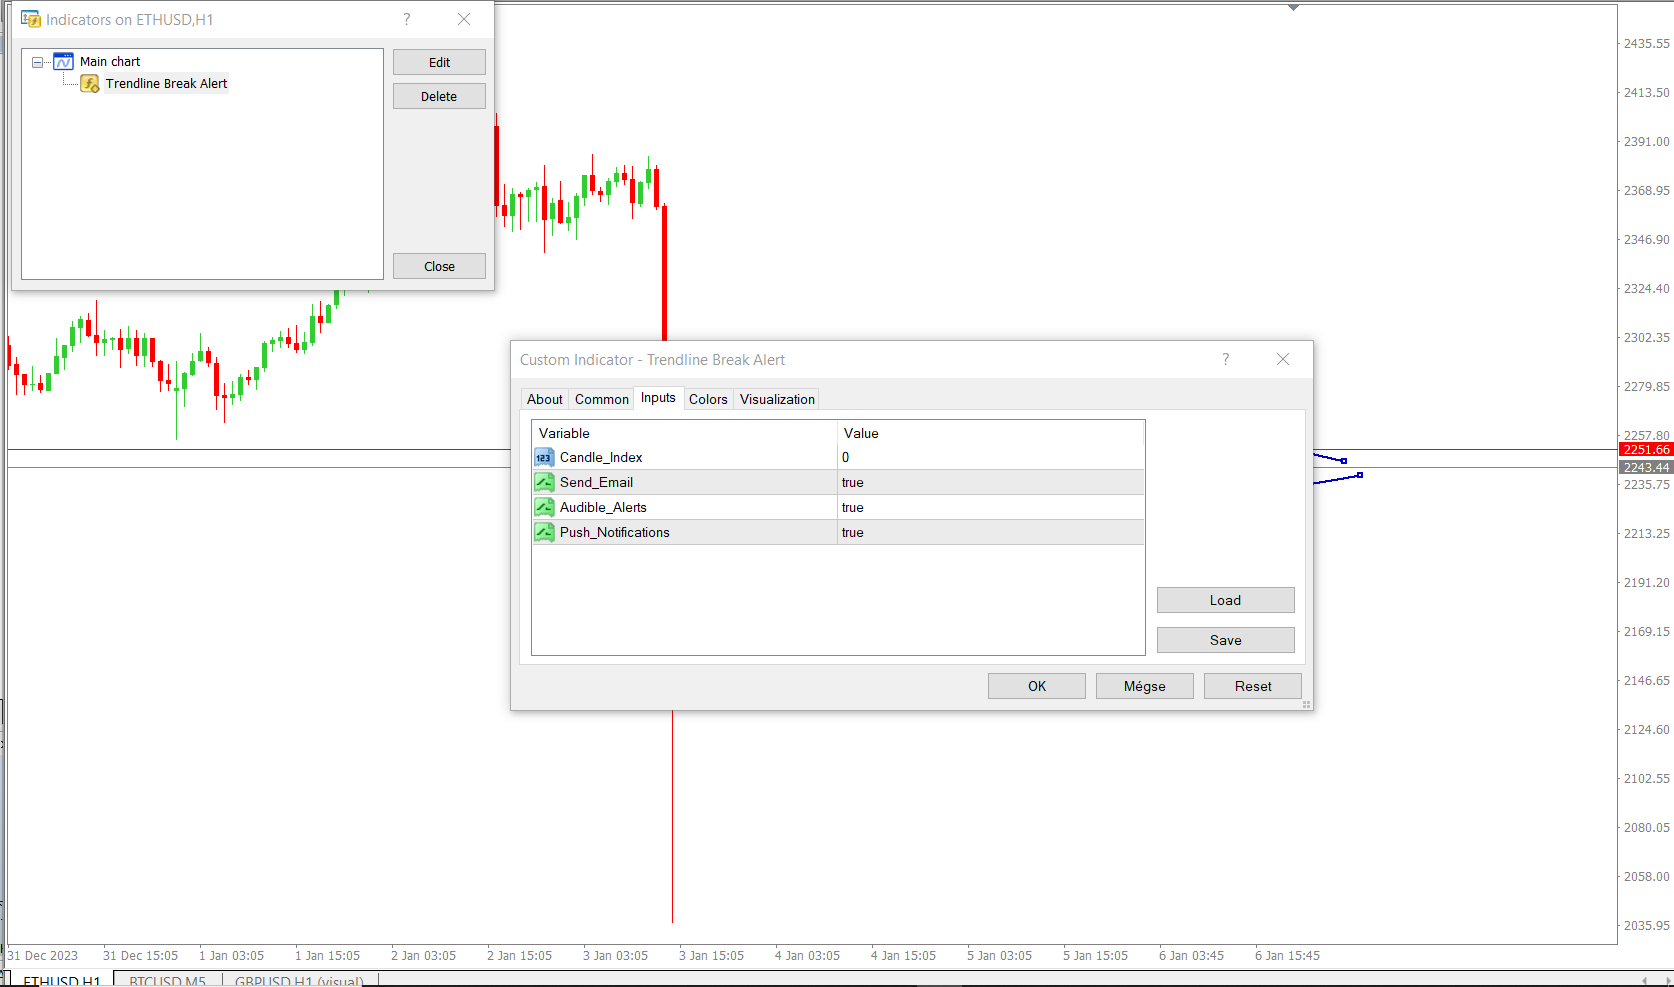
トレードでトレンドラインを使用するのに慣れている場合、役立つことがあります。 調整可能なパラメータには、以下が含まれます:
キャンドル識別子:ブレイク後のどのキャンドルで信号を出すか
そして、3種類のアラート:
Eメールの送信
聞こえる警告
プッシュ通知
テスト目的のため、トレンドラインの描画をサポートしていないため、MetaTrader 5の戦略テスターの代わりにMetaTrader 4を使用することをお勧めします。
MT4バージョン:https://www.mql5.com/en/market/product/111112?source=Site+Market+My+Products+Page
電話で通知アラートを設定する方法を学ぶために、このビデオをご覧ください:
https://www.youtube.com/watch?v=4oO-3fMQ4QA
インストールガイド:
https://www.mql5.com/en/blogs/post/739828
https://www.mql5.com/en/blogs/post/751762
このインジケーターに対するフィードバックやコメントを歓迎します。
成功したトレードを!


Very Good Indicator.. The Developer of the product is also awesome.