Cool iExposure MT5

If you need more information than a few numbers in the iExposure index, this indicator is for you.

Better iExposure indicator is an improvement over the original information, such as:


  • Separate profit column for BUY and SELL
  • Separate SL column for BUY and SELL
  • Separate TP column for BUY and SEL
  • Average Price as Horizontal Line in Chart
  • Pip Value
  • Profit
  • https://www.facebook.com/groups/prop4y

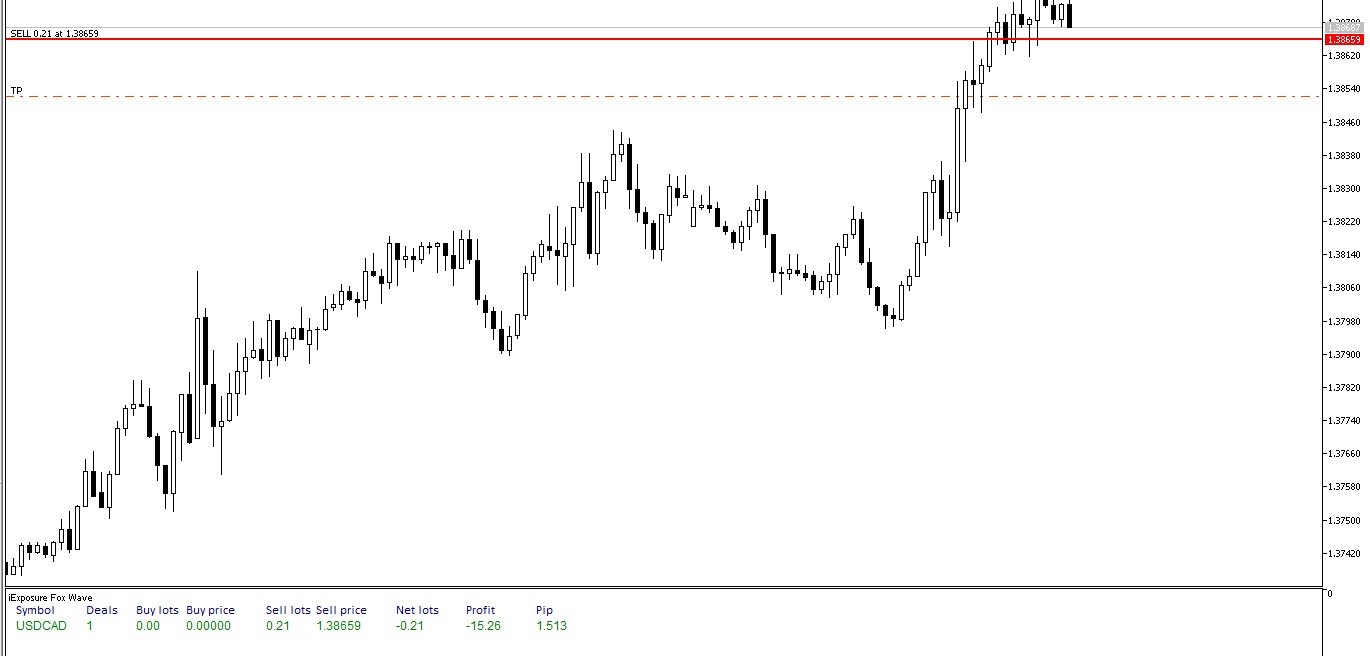
iExposure will show the opening of trading positions in tabular form in the sub-window below the main window.  This allows the trader to see at a glance the positions in the market including the profit value and the amount of risk for each position.

The iExposure indicator is a technical tool that is easy to use and very helpful, especially if a trader opens several trades at once with several different instruments.  Traders can add the iExposure indicator to any price chart if they wish to use it.

By adding the iExposure indicator, traders can also still see tabs of other trading positions for other currencies.  Also note that iExposure can also monitor all trading positions, besides being able to make details by displaying one position for one window.

Why is Monitoring Trading Positions Important?

Any trader will definitely love winning as well as hate such as suffering defeat.  But in the case of forex trading, this kind of emotion can have an unfavorable influence on decision-making actions.  In other words, trading emotions can mess up trading itself.

Because a negative attitude is always associated with losing a trade, there will be a tendency for traders to be emotionally shaken after losing a trade, especially if they lose a lot.  For example, a trading position does not go according to plan, it is easy for traders to turn away and leave the market.

But the bad position can actually be easily anticipated from the start if the trader wants to monitor the position constantly.  Not by monitoring trading positions in front of the computer continuously, but simply leaving it to a technical tool that has this function.

Having technical tools such as the iExposure indicator can keep trading positions in line with the profit targets that have been proclaimed since the beginning of entering the market.  This kind of indicator is not only useful for maintaining trading positions so that it has become a necessity.

For any trader who wants to keep his position in the market under control, the iExposure indicator offers this function, namely managing positions so that they are in accordance with what was planned at the beginning when opening a trade.

The iExposure indicator also provides other technical analysis tools, although its main function remains as a parameter to monitor positions.  For example, you want to see how the iExposure indicator works, the easiest way is to open a position and the related information will be displayed on the screen.

But of course, taking the risk by opening a real trade just to find out how the iExposure indicator works is not a wise move for a trader to take.  That's why opening a demo trading account is a great idea for every trader.

In the risk-free environment that the demo account offers, traders can try the iExposure indicator with different parameters for each scenario.  The environment offered by the demo account is the original environment of the forex market, but the capital used is only virtual money.

Considerations Regarding the iExposure Indicator

The iExposure indicator actually does not have a special effect that can change the trader's perspective on a trade, but it is enough to help traders monitor positions in the market.  iExposure doesn't revolutionize the way trading is advanced, or whatever.

iExposure comes with basic features that are very useful.  It doesn't matter what trading strategy is taken, the results will be effective if the trader has carried out the basics of trading as it has been prepared so that the trading position remains in the plan he made.

In other words, a trader can only make profit from trading if he continues to trade.  To do this, traders must still be in a favorable position in the market.  Moreover, forex is a market full of uncertainty.

Keeping a profitable trading position in the market is not easy, especially if you don't incorporate discipline into the process.  Even then, risk management must still be added in an effort to keep away the potential for defeat that can occur at any time.

The iExposure indicator is intended to keep traders disciplined in maintaining positions in the market, namely by providing the latest information on the latest positions.  Including the possible risks and profits that may be obtained from the position.


おすすめのプロダクト
Alphabet AI MT5
Sergei Pomytkin
3.43 (7)
Alphabet AI は、平均回帰戦略を採用したアドバイザーです。これは、市場が大きな変動をした後、平均値に戻るという自然な性質を利用することを意味します。このアルゴリズムは、資産の現在の価格を常に分析し、計算された平均レベルと比較します。価格が平均値から大きく乖離すると、アドバイザーはこれを行動のシグナルと解釈します。上限を超えた場合は、価格の下落を期待してショートポジションを開き、下限を下回ると、上昇を期待してロングポジションを開きます。当社のアドバイザーの特徴は、チャネルの境界を決定し、誤ったシグナルをフィルタリングする適応型アプローチにあります。これにより、緩やかなトレンドの状況でも効果的に機能します。このアドバイザーは、価格チャネル内で顕著な変動を示す通貨ペアで特に優れたパフォーマンスを発揮します。 アドバイザーは 20 年以上にわたってデータに基づいてテストされており、その間、最も不安定な期間にも耐えることができます。 コンピュータを 24 時間 365 日稼働し続ける機会がない場合は、VPS サーバー サービスを使用することをお勧めします。 このアドバイザーは、ドロー
KP Grid Sentinel Adaptive Risk-Controlled Grid Expert Advisor KP Grid Sentinel is an automated grid trading system for MetaTrader 5 designed with a strong focus on capital protection and exposure control. Unlike classic grid systems, KP Grid Sentinel integrates an internal stress monitoring engine that continuously evaluates the trading system condition and dynamically regulates how much exposure is allowed to exist in the market. The Expert Advisor automatically adjusts its behaviour according
BTC Master Pro
Farzad Saadatinia
4.62 (13)
BTC Master Pro — 規律あるビットコイントレードのための信頼できるパートナー。 最新バージョンでは OpenAI の人工知能 を統合し、高ボラティリティな暗号資産市場において、より高度な執行判断と取引フィルタリングを実現します。 本プロフェッショナル向けエキスパートアドバイザーは、 MetaTrader 5 上での Bitcoin(BTCUSD) 取引専用に設計されており、構造化された執行ロジック、エクスポージャー管理、そして高度なリスクマネジメントに重点を置いています。 価格: $499  →  次段階: $699  →  最終価格: $999 LIVE SIGNAL HERE OpenAI搭載・執行フィルター 最新バージョンでは OpenAI 技術を活用し、リアルタイムで市場環境を分析し、質の低いエントリーや不利なセットアップをフィルタリングします。 AIセーフティレイヤー: AIモジュールは取引実行前の第二承認レイヤーとして機能します。これは予測ツールではなく、あくまで執行フィルターとして設計されています。すべての取引は構造化ロジックとインテリジェントな検証プ
Breadwinner EMA Pro
Isidro Jr Rosalada Dadula
リスク管理に焦点を当てた自動化された外国為替取引 これはAIによって生成された翻訳です。一部のエラーが含まれている可能性があることに注意してください。 (DFX MQL5コミュニティの更新された設定ファイル/設定、以下のリンクを参照) 収益性への規律あるアプローチによるEMAクロスオーバーの力を解き放つ DFXのEMA Pro は、あなたの取引戦略を自動化するために設計された強力で使いやすい外国為替エキスパートアドバイザー(EA)です。これは、堅牢なリスク管理機能とカスタマイズ可能な設定を備えた、実績のあるEMA(指数移動平均)クロスオーバー戦略に基づいて構築されています。 EMA Proが他と異なる点: 戦略的EMAクロスオーバー: シンプルで効果的: EAは2つのEMA、速いEMAと遅いEMAを使用します。速いEMAが遅いEMAを上回ると買いシグナルが生成され、速いEMAが遅いEMAを下回ると売りシグナルが生成されます。このクロスオーバー戦略は、潜在的なトレンドの変化を特定し、その機会を活かすことを目的としています。 タイムフレームのカスタマイズ: EMAクロスオーバー分析のための
Caicai L&S Yield Histogram Important Notice: This indicator is an integral tool of the automated EA Caicai Long and Short Pair Trading . This indicator visually displays the percentage deviation (Yield %) of a pair's current spread relative to its own historical mean. It is an excellent tool for quickly visualizing the gross financial potential of a market distortion in Long & Short operations. Main Features: Percentage Visualization: Understand the size of the distortion in palpable percentage
SMC Venom Model BPR インジケーターは、スマート マネー (SMC) コンセプトで取引するトレーダー向けのプロフェッショナル ツールです。価格チャート上の 2 つの主要なパターンを自動的に識別します。 FVG   (フェアバリューギャップ) は、3 本のローソク足の組み合わせで、最初のローソク足と 3 番目のローソク足の間にギャップがあります。ボリュームサポートのないレベル間のゾーンを形成し、価格修正につながることがよくあります。 BPR   (バランス価格範囲) は、2 つの FVG パターンの組み合わせで、「ブリッジ」を形成します。これは、価格がボリュームアクティビティの少ない動きで動くときに、ブレイクアウトしてレベルに戻るゾーンで、ローソク足の間にギャップを作成します。 これらのパターンは、大規模な市場プレーヤーと一般参加者の相互作用が発生するチャート上のボリュームと価格動向の分析に基づいて、トレーダーが主要なサポート/レジスタンス レベル、ブレイクアウト ゾーン、エントリ ポイントを識別するのに役立ちます。 インジケーターは、長方形と矢印の形でパターンを視覚
Crystal FVG Touch Detector – スマートマネーコンセプト対応高機能インジケーター Crystal FVG Touch Detector は、Smart Money Concepts (SMC) と ICT 手法を使用するトレーダー向けに設計されたプロ仕様の指標です。 あらゆる時間足で Fair Value Gap (FVG) を自動検出し、タッチをリアルタイムに認識して表示します。 リペイントしないアルゴリズムにより、機関トレーダーの不均衡ゾーンを正確に把握します。 主な特徴 FVG(強気・弱気)を自動で検出。 タッチ時に即時更新。 全時間足対応。 カラー自動調整。 高速・安定動作。 カスタマイズ可能な設定。 キーワード: FVG, Fair Value Gap, Smart Money Concepts, SMC, ICT, Order Block, Imbalance, 流動性, サプライ・デマンド, Non Repaint, Volume Spread Analysis, Market Structure, CHoCH, BOS, Liquidity
FREE
BREAK RETEST NON-REPAINT. WORKS BEST AT M15 AND ABOVE.  Benefits Fewer false breakouts . Combining close confirmation + retest + previous-close filter greatly reduces noise vs. raw high/low breaks. Tighter execution plans . The drawn level line gives an objective spot for entries, stop placement (just beyond the level), and partial-take-profit structure. Non-repainting confidence . Signals are placed on current bar. Flexible across markets . Works on FX, indices, metals, crypto; scalping on M15
SPECIAL LAUNCH OFFER: $30 (1-Month Rent) Limited time offer to build our community and gather feedback! AmbM GOLD Institutional Scalper A high-precision M5 algorithm for XAUUSD (Gold) , engineered to trade exclusively at Institutional Liquidity Levels ($5/$10 psychological marks). PERFORMANCE DATA (BUY ONLY) • Win Rate: 87.09%. • Safe Growth: +$4,113 profit on $10k (13.75% Max Drawdown). • Extreme Stress Test: Successfully generated +$22,997 in a 5-year stress test (2020-2026), proving
Market Cycle and Trading Sessions Indicator Introducing our Market Cycle and Trading Sessions Indicator, a tool designed to provide you with a comprehensive view of the financial market like never before. Observe the market's pulse with our exclusive indicator. Gain a deep understanding of market phases, from accumulation to distribution, to make informed, strategic decisions with a high probability. What makes our indicator? 1. Date Range for Calculations: Customize the start and end dates
FREE
Tragos
David Chokumanyara
TRAGOS Indicator – The GOAT of All Trading Indicators TRAGOS (Greek for “male goat”) isn’t just a name — it’s the GOAT: Greatest of All Time in trading indicators. Designed for Forex, Indices, Gold, Crypto, and Deriv Synthetic Indices (Boom & Crash, Volatility 75, Step, Jump, etc.), it gives you non-repainting buy, sell, and exit signals with unmatched clarity. Why TRAGOS? Non-Repainting Signals – 100% reliable. Audible, Email & Push Alerts – Never miss a trade. Trend Following – Rid
Rsi Cloud PullBack
Sylvestre Setufa Djagbavi
Do you want trading robots? Read this: Before investing in a trading robot, take a moment to understand what it entails. Trading is a game of probabilities. No one can guarantee a profit on every trade or every month. What truly matters is long-term profitability.  If you can't accept that, there's no point in buying my robot. Go find another job.  Don’t buy a robot based solely on its price or popularity on a platform. An expensive bot isn’t necessarily profitable.  Even with a profitable robot
The  Smart FVG Statistics Indicator  is a powerful MetaTrader 5 tool designed to automatically identify, track, and analyze Fair Value Gaps (FVGs) on your charts. Love it? Hate it? Let me know in a review! Feature requests and ideas for new tools are highly appreciated. :) Try "The AUDCAD Trader": https://www.mql5.com/en/market/product/151841 Key Features Advanced  Fair Value Gap  Detection Automatic Identification : Automatically scans for both bullish and bearish FVGs across specified histo
FREE
Daily HiLo
Nicanor Jr Cagape Layco
DailyHiLo Indicator Master the daily range like a pro. This indicator automatically plots the previous day’s high and low levels —a core element in the (Beat The Market Maker) trading approach—directly on your chart. These levels act as natural boundaries for intraday price action, helping traders identify potential reversal zones, breakout points, and liquidity targets. Key Features Accurate plotting of yesterday’s high and low for any symbol and timeframe. Works seamlessly with BTMM-inspired
FREE
track record of myfxbook : RAWスプレッド口座でバックテストを行えば、驚くべき結果が見られます。 エキスパートアドバイザー(EA)の概要: このEAは、**XAUUSD(金/米ドル)**の取引に特化して最適化されており、**1時間足(H1)**で最高のパフォーマンスを発揮します。**4時間足(H4)**も優れた代替オプションです。 金市場特有のボラティリティと価格構造に合わせて、性能が緻密に調整されています。 私たちは「すぐに金持ちになれる夢」を売っているわけではありません。 提供するのは、 真に効果的で強力なトレーディングツール です —— 本物のトレーディングを理解している人向けに設計されています。 このEAは、価格構造の中で もっとも精度の高いブレイクアウトゾーン を検出する 高度なアルゴリズム で構築されており、 資金を守るリスク管理フレームワーク の中でプロフェッショナルに取引を行います。 市場構造を動的に分析し、重要なレベルの検出とトレンドフィルタリングを組み合わせて、偽シグナルを避けます。 このEAのパフォーマンスは単なるバ
Multi Pivot Indicator - Professional Trading Tool MULTI PIVOT PRO INDICATOR Professional Multi Pivot Indicator for MT4 5-in-1 Pivot Indicator Professional Trading Tool for MetaTrader 4 ENGLISH TÜRKÇE Multi Pivot Indicator PRO Classic Fibonacci Camarilla Woodie DM What is Multi Pivot Indicator? Multi Pivot Indicator is a professional trading tool that displays 5 different pivot calculation methods on your MetaTrader 4 charts. Pivot points are critical support and resistance
ST Adaptive Flow: Triple Confluence & KAMA Intelligence ST Adaptive Flow is a next-generation indicator designed for traders who demand surgical precision in identifying institutional flow. It is not just a moving average; it is a decision algorithm that combines KAMA (Kaufman Adaptive Moving Average) with momentum filters (RSI) and macro trend (SMA 200). The Core of the Algorithm: Dynamic Adaptive Line: Uses Kaufman’s logic to adjust to market speed. It flattens in sideways markets and slopes a
FREE
概要 このインジケーターは、クラシックな ドンチャンチャネル を強化したバージョンで、実践的なトレード機能を追加しています。 標準の3本線(上限、下限、中央線)に加え、 ブレイクアウト を検出し、チャート上に矢印で視覚的に表示します。また、チャートを見やすくするために、 現在のトレンド方向と逆側のラインのみを表示 します。 インジケーターの機能: 視覚的シグナル :ブレイクアウト時にカラフルな矢印を表示 自動通知 :ポップアップ、プッシュ通知、Eメール RSIフィルター :市場の相対的な強弱に基づいてシグナルを検証 カスタマイズ可能 :色、ラインの太さ、矢印コード、RSI閾値など 動作原理 ドンチャンチャネルは次のように計算します: 上限線 :直近N本のクローズ済みローソク足の最高値 下限線 :直近N本のクローズ済みローソク足の最安値 中央線 :最高値と最安値の平均値 上方ブレイクアウト は終値が上限線を超えたときに発生し、 下方ブレイクアウト は終値が下限線を下回ったときに発生します。 インジケーターは以下を行います: 3本のドンチャンラインを描画 方向転換後の最初のブレイクアウト
FREE
General Idea of the Strategy The Ichimoku Cloud Breaker robot harnesses the power of the famous Ichimoku Kinko Hyo indicator but with a unique multi–timeframe approach. The goal of the robot is to identify true trend breakouts while filtering out false signals. The robot continuously monitors the Ichimoku clouds across multiple timeframes and only opens a position when the signals are perfectly aligned between the smaller and higher timeframes. Result: precise, powerful, and high–potential entri
Logiciel MQL5 – TIME BOX PRO v2.0 概要 TIME BOX PRO v2.0 , MetaTrader 5 Liste des prix ​ Description du produit :  Y EAR(年)、SEMESTRE(半期)、QUARTER(四半期)、MONT H, SEMAINE, JOUR, jour ( HB 90 %, 50 %, 10 %) Logiciel MQL5化されており、全ての重要期間を迅速かつ効率的に確認できます。 主な機能 マルチタイムフレーム : ANNÉE, SEMESTRE, TRIMESTRE, MOIS, SEMAINE, JOUR ️ タイムフレームごとのカラーボックス で価格レンジを視覚化 カスタマイズ可能な HBレベル (90%, 50%, 10%) ️ 動的ラベル により期間を表示 (ANNÉE, S1, Q1, M1, SEMAINE, JOUR) Processeur CPU  : タイムフレームごとの表示/非表示 を入力設定で切替可能 表示期間の制限 で最
FX Clock
Abderrahmane Benali
FXClock – Professional Clock Indicator for Traders Please leave a 5 star rating if you like this free tool! Thank you so much :) The FXClock indicator is a practical and simple tool that displays time directly on your trading platform, allowing you to track multiple key pieces of information at the same time. It is specially designed to help traders synchronize their trading with market hours and global sessions. Key Features: Displays the broker server time with precision. Displays your local c
FREE
BullBea Display
Everton Fernando Da Silva Messias
1. 基本情報 インジケーター名:   BullBear Display バージョン:   1.00 開発者:   [あなたの名前] 会社:   MT5TOOLSLAB 種類:   チャートインジケーター 市場:   外国為替、株式、先物、暗号通貨 2. 説明 BullBear Display   は以下をリアルタイムで表示する視覚的インジケーターです: ブル(買い手)の強さ ベア(売り手)の強さ 市場支配権(価格をコントロールしている側) このインジケーターはチャートの左上隅に情報を表示し、市場センチメントの迅速な分析を可能にします。 3. インストール BullBear_Display.mq5   を保存:   \MQL5\Indicators\ MetaTrader 5を再起動 「ナビゲータ」ウィンドウで「カスタムインジケーター」を探す 目的のチャートにドラッグ&ドロップ 4. 入力パラメータ PeriodBuySell   (デフォルト: 13): EMA参照計算の期間。低い値はより敏感なシグナルを、高い値はより滑らかなシグナルを生成します。 5. シグナル解釈 支配: ブル
Golden Opportunity FX
Michael Prescott Burney
1 (1)
Golden Opportunity FX: The Ultimate Gold Trading System Introducing Golden Opportunity FX, a revolutionary trading system featuring 264 gold strategies forged in profit. This system stands out from my other gold systems due to its unparalleled ability to compound returns at an exceptional rate, significantly faster than typical systems. Key Highlights: Unmatched Performance: Over the last 365 days, Golden Opportunity FX has achieved a near-perfect win rate, transforming $3,000 into $800,000 in o
Ignition
Dansie Software Limited
Strategy Overview The Ignition EA tries to take advantage of sudden momentum when the Ignition pattern is detected. The final bar in the ignition pattern has a small opening wick, a very little or no closing wick, is large in comparison to recent bars and must start from the lower end of the current range (for a bullish ignition) Quick Testing Use Symbol EURUSD, Timeframe M2, and remove the GBPUSD symbol from the "Symbols" input (stratergy 1 and stratergy 2) Settings The below settings appe
MACD Signal Pro – マルチタイムフレームスキャナー MACD Signal Proは、複数のタイムフレームにおいて、明確でフィルタリングされた、確度の高いシグナルを求めるトレーダー向けに設計された高度なインジケーターです。 従来のMACDのパワーと、最新のビジュアルパネルに表示されるインテリジェントなマルチタイムフレームスキャナーを組み合わせ、誤ったシグナルを回避し、エントリー精度を向上させます。 FX、指数、暗号通貨、貴金属に最適です。 主な機能 正確な買い/売りシグナル MACD/シグナルのクロスオーバーに基づく チャート上に視覚的な矢印を表示 マルチタイムフレームスキャナー搭載 M1 → MN1 各タイムフレームで瞬時にトレンドを視覚化 強気または弱気のアライメントを迅速に検出 プロフェッショナルで直感的なパネル タイムフレームごとの買い/売りシグナル シグナル強度インジケーター(%) 全体概要:強気 / 弱気 / 混合 包括的なアラートシステム 音声アラート プッシュ通知 メール ローソ
FREE
"Blow It Up!" – The Trading Indicator That Questions Your Life Choices Tired of boring indicators? Meet your new market companion that delivers:   "YOLO BUY!" arrows   when you should probably panic   Explosive rectangle confetti   (because why not?)   200+ soul-crushing quotes   like   "Your stop loss is imaginary"   and   "This isn’t trading, it’s donating to whales"   Random alerts that roast your strategy This Indicator is like Therapy   – Because daytrading shouldn’t feel
デュアルラインシグナル、マルチタイムフレームサポート、カスタマイズ可能なビジュアルシグナル、設定可能なアラートシステムを備えたトリプル指数移動平均(TRIX)インジケーター。 フリーランスプログラミングサービス、アップデート、その他のTrueTL製品は私の MQL5プロフィール でご利用いただけます。 フィードバックとレビューをお待ちしております! TRIXとは? TRIXは、三重指数平滑移動平均の変化率を表示するモメンタムオシレーターです。インジケーターは、価格に3つの連続したExponential Moving Average(EMA)を適用し、バー間の変化率を測定することで計算されます。 TRIXは軽微な価格変動を軽減し、トレンドの識別を助けます。オシレーターはゼロラインを中心に変動します。正の値は強気モメンタム、負の値は弱気モメンタムを示します。FastとSlow TRIXラインのクロスオーバーおよびゼロラインのクロスオーバーは、一般的にトレードシグナルとして使用されます。 機能: デュアルラインTRIXインジケーター:Fast TRIXとSlow TRIX 矢印と垂直ラ
FREE
Ksm: Smart Solution for Automated Forex Trading Ksm is a tool designed for automating Forex trading, using modern methods of time-series data analysis to work with multiple currency pairs across different timeframes. Key Features and Benefits Multi-currency support : Ksm enables trading across multiple currency pairs, helping traders adapt their strategies to various market conditions. New currency pairs can be easily added. Time-series data analysis : Utilizing advanced algorithms, Ksm analyzes
ORB Displacement London Sweep Bias · NY Displacement · Order Block & FVG Zone Entry Signal "The market tells you its direction every single morning. Asian range. London sweep. NY displacement. You just need to know how to read it." What Is ORB Displacement? Every trading day follows the same institutional rhythm. The Asian session builds a quiet range. London opens and sweeps one side of it — taking out retail stops and building the liquidity needed for the real move. Then New York opens, displ
The Tree
Mr Navee Koonlert
This is EA optimizer for EURUSD Currency at M30 timeframe. The EA use Simple MA & Paraboric SAR for find Spot to open order. and usd ichimoku kinko hyo & Momentum For Confirm the trend of Price. This EA don't use  martingale method. Recommendations:  Currency pair: EURUSD Timeframe: M30 Minimum deposit : $100 Account type: Any Use low spread forex brokers Input Setting: every 500 USD use 0.2 Lot
このプロダクトを購入した人は以下も購入しています
Entry In The Zone and SMC Multi Timeframe is a real-time 2-in-1 market analysis tool that combines market structure analysis and a No Repaint BUY / SELL signal system into a single indicator, built on Smart Money Concepts (SMC) — a widely adopted framework used by professional traders to understand market structure. This indicator helps you see the market more clearly, make decisions based on structure rather than guesswork, and focus on high-probability zones where price is more likely to react
このインジケーターを購入された方には、以下の特典を 無料 で提供しています: 各トレードを自動で管理し、ストップロスとテイクプロフィットを設定し、戦略ルールに基づいてポジションを決済する補助ツール 「Bomber Utility」 様々な銘柄に合わせたインジケーターの設定ファイル(セットファイル) 「最小リスク」、「バランスリスク」、「待機戦略」 の3つのモードで使用できる Bomber Utility 用の設定ファイル このトレーディング戦略をすぐに導入・設定・開始できる ステップバイステップのビデオマニュアル ご注意: 上記の特典を受け取るには、MQL5のプライベートメッセージシステムを通じて販売者にご連絡ください。 オリジナルのカスタムインジケーター 「Divergence Bomber(ダイバージェンス・ボンバー)」 をご紹介します。これは、MACDのダイバージェンス(乖離)戦略に基づいた 「オールインワン」型のトレーディングシステム です。 このテクニカルインジケーターの主な目的は、価格とMACDインジケーターの間に発生するダイバージェンスを検出 し、将来の価格の動きを示す
Azimuth Pro
Ottaviano De Cicco
5 (6)
Azimuth Pro V2:MT5向けシンセティック・フラクタル構造分析と確認済みエントリー 概要 Azimuth Pro は Merkava Labs によるマルチレベルスイング構造インジケーターです。4つのネストされたスイングレイヤー、スイングアンカーVWAP、ABCパターン検出、3タイムフレーム構造フィルタリング、そして確定バーでの確認済みエントリー — 1つのチャートで、ミクロスイングからマクロサイクルまでを網羅するワークフロー。 これはブラインドシグナル製品ではありません。ロケーション、コンテキスト、タイミングを重視するトレーダーのための構造ファーストワークフローです。 V2発売記念オファー — Azimuth Pro V2をUSD 399で(次の100本)。最終価格:USD 499。 1. V2での変更点 シンセティック・マルチタイムフレームエンジン 上位タイムフレーム分析をMeridian Proと同じ独自のシンセティックアーキテクチャで一から再構築。よりクリーンなHTFコンテキスト、安定したライブ動作、従来のMTF同期問題なし。シンセティックエンジンは 固定比率タ
Quantum TrendPulse を ご紹介します。これは、   SuperTrend   、   RSI   、および Stochastic のパワーを 1 つの包括的なインジケーターに組み合わせて、取引の可能性を最大限に引き出す究極の取引ツールです。精度と効率を求めるトレーダー向けに設計されたこのインジケーターは、市場のトレンド、勢いの変化、最適なエントリー ポイントとエグジット ポイントを自信を持って特定するのに役立ちます。 主な特徴: SuperTrend 統合: 現在の市場動向に簡単に追従し、収益性の波に乗ることができます。 RSI精度: 買われすぎと売られすぎのレベルを検出し、市場の反転のタイミングに最適で、SuperTrendのフィルターとして使用されます。 確率的精度: 確率的振動を活用して、変動の激しい市場で隠れたチャンスを見つけます。SuperTrend のフィルターとして使用されます。 マルチタイムフレーム分析:   M5 から H1 または H4 まで、さまざまなタイムフレームで市場を常に把握します。 カスタマイズ可能なアラート: カスタム取引条件が満たされ
Gann Made Easy   は、ミスター・ギャンの理論を使用した取引の最良の原則に基づいた、プロフェッショナルで使いやすい外国為替取引システムです。 W・D・ガン。このインジケーターは、ストップロスとテイクプロフィットレベルを含む正確な買いと売りのシグナルを提供します。 PUSH通知を利用して外出先でも取引可能です。 ご購入後、取引方法の説明と優れた追加インジケーターを無料で入手するには、私にご連絡ください! おそらく、ギャンの取引手法についてはすでに何度も聞いたことがあるでしょう。通常、ギャンの理論は初心者のトレーダーだけでなく、すでにある程度の取引経験がある人にとっても非常に複雑なものです。なぜなら、ギャンの取引手法は理論的にはそれほど簡単に適用できるものではないからです。私はその知識を磨き、最良の原則を私の外国為替インジケーターに組み込むために数年を費やしました。 このインジケーターは非常に簡単に適用できます。必要なのは、それをチャートに添付し、簡単な取引推奨事項に従うだけです。このインジケーターは常に市場分析の仕事を行い、取引の機会を探します。適切なエントリーポイントを検
このインジケーターを購入すると、プロ仕様のトレードマネージャーを無料で差し上げます。 まず第一に、このトレーディングシステムがノンリペイント、ノンリドロー、ノンラグのインジケーターであることを強調する価値がある。これにより、手動取引とロボット取引の両方に理想的なものになっています。 オンラインコース、マニュアル、プリセットのダウンロード。 「スマートトレンドトレーディングシステム MT5」は、新規および経験豊富なトレーダー向けにカスタマイズされた包括的なトレーディングソリューションです。10以上のプレミアムインジケーターを組み合わせ、7つ以上の堅実なトレーディング戦略を備えており、多様な市場状況に対応する多目的な選択肢となっています。 トレンドフォロー戦略:トレンドを効果的に乗り越えるための正確なエントリーとストップロス管理を提供します。 リバーサル戦略:潜在的なトレンドの反転を特定し、トレーダーがレンジ相場を活用できるようにします。 スキャルピング戦略:高速で正確なデイトレードおよび短期取引のために設計されています。 安定性:すべてのインジケーターはノンリペイント、ノンリドロー、ノ
FX Trend NG:次世代マルチマーケット・トレンドインテリジェンス 概要 FX Trend NG は、複数の時間足に対応したプロフェッショナル向けトレンド分析およびマーケット監視ツールです。 市場全体の構造を数秒で把握することができます。 複数のチャートを切り替える必要はありません。どの銘柄がトレンド中なのか、どこでモメンタムが弱まっているのか、そしてどの時間足で強い整合性があるのかを瞬時に確認できます。 ローンチ特別オファー – FX Trend NG を $30(6ヶ月) または $80 永久ライセンス でご利用いただけます。 すでに Stein Investments のユーザーですか? -> メッセージを送信 して、プライベートグループへアクセスしてください。 セットアップや詳細情報が必要ですか? -> Stein Investments 公式ページ をご覧ください。 1. FX Trend NG が他と異なる理由 3ステート・トレンドロジック ― Buy と Sell だけではない • 多くのインジケーターは Buy または Sell の2状態のみを表示します。
OmniSync Projection
Antonio-alin Teculescu
5 (1)
Chronos Fractal Engine is an innovative price projection indicator for MetaTrader 5, designed to transform your technical analysis by intelligently identifying and projecting historical price patterns. Built upon an advanced correlation algorithm and the fractal principles of the market, this powerful tool visualizes potential future price movements, giving you a unique edge in your trading decisions. What is Chronos Fractal Engine? At its core, the Chronos Fractal Engine employs a sophisticat
ご紹介     Quantum Breakout PRO は 、ブレイクアウト ゾーンの取引方法を変革する画期的な MQL5 インジケーターです。 13年以上の取引経験を持つ経験豊富なトレーダーのチームによって開発されました。     クォンタム ブレイクアウト プロ   は、革新的でダイナミックなブレイクアウト ゾーン戦略により、あなたのトレーディングの旅を新たな高みに押し上げるように設計されています。 クォンタム ブレイクアウト インジケーターは、5 つの利益ターゲット ゾーンを備えたブレイクアウト ゾーン上のシグナル矢印と、ブレイクアウト ボックスに基づいたストップロスの提案を提供します。 初心者トレーダーにもプロのトレーダーにも適しています。 量子EAチャネル:       ここをクリック 重要!購入後、インストールマニュアルを受け取るためにプライベートメッセージを送ってください。 推奨事項: 時間枠: M15 通貨ペア: GBPJPY、EURJPY、USDJPY、NZDUSD、XAUUSD アカウントの種類: ECN、Raw、またはスプレッドが非常に低い R
CGE Trading Suite
Carl Gustav Johan Ekstrom
5 (2)
Institutional-Grade Analytics for MT5 C GE Trading Suite delivers the analytical edge typically reserved for professional trading desks. The platform integrates a full suite of analytical tools into one seamless workflow: dynamic grid mapping, liquidity behavior analysis, ECM, trend lines, MIDAS, trade cycles, and directional channel projections. Together, these provide a unified view of market structure and momentum. Directional clarity is further enhanced by the capital flow index, which meas
あなたのシンボルでどの戦略が実際に機能するか確認しましょう - リアルマネーをリスクにさらす前に。 Power Barは、あらゆるシンボルとあらゆるタイムフレームで 極端な価格バー を検出し、3つの異なるトレード戦略を即座にバックテストします。勝率、プロフィットファクター、損益を並べて比較できます。すべてが1つのインタラクティブなパネルに集約されています。 推測なし。カーブフィッティングなし。データだけです。 Power Barが特別な理由 ほとんどのインジケーターはシグナルを出すだけで、それが機能するかどうかは推測に任されます。Power Barはさらに先を行きます - すべてのシグナルを 3つの戦略 に対してテストし、統計を表示します。FlipFlop、Momentum、Reversalをワンクリックで切り替え、数値が即座に変化するのを確認できます。 FlipFlop - 常にポジションを保有。シグナルでエントリーし、反対シグナルでイグジット。当社のリサーチでは、US30、US500、DAXなどのトレンドのあるインデックスで最も効果的です。 Momentum - シグナルの方向に
Meridian Pro
Ottaviano De Cicco
5 (1)
Meridian Pro:MT5用プロフェッショナル・マルチタイムフレーム・トレンドマトリックス 概要 Meridian Pro は Merkava Labs が開発したマルチタイムフレーム・トレンドマトリックスで、方向性の状態、強度、モメンタムの状況、マトリックスの合意をひとつのコンパクトなパネルに集約します。ひとつのアダプティブエンジンがM1からW1まで一貫して適用されます。シンボルごとの調整は不要。インジケーターの積み重ねも不要。すべてのアセットとすべてのタイムフレームをカバーするひとつの構造化された読み取りです。 発売キャンペーン — Meridian Proを USD 99 (導入価格)で入手。通常価格:USD 149 。 1. Meridian Proが他と異なる理由 ひとつのエンジン、バラバラなインジケーターのダッシュボードではない 多くのMTFダッシュボードは、タイムフレームごとに生のインジケーター値を繰り返すだけです。Meridian Proはマトリックス全体でひとつのアダプティブ・トレンドエンジンを使用するため、パネルの各行が同じ構造化フレームワークから導出されます
優れたテクニカルインジケーター「Grabber」をご紹介します。これは、すぐに使える「オールインワン」トレーディング戦略として機能します。 ひとつのコードに、市場のテクニカル分析ツール、取引シグナル(矢印)、アラート機能、プッシュ通知が強力に統合されています。 このインジケーターを購入された方には、以下の特典を無料で提供します: Grabberユーティリティ:オープンポジションを自動で管理するツール ステップバイステップのビデオマニュアル:インジケーターのインストール、設定、取引方法を解説 カスタムセットファイル:インジケーターをすばやく自動設定し、最大限の成果を出すための設定ファイル 他の戦略はもう忘れてください!Grabberだけが、あなたを新たなトレードの高みへと導いてくれるのです。 Grabber戦略の主な特徴: 推奨タイムフレーム:M5〜H4 対応通貨ペア・資産:どれでも使用可能ですが、私が実際に検証した以下を推奨します(GBPUSD、GBPCAD、GBPCHF、AUDCAD、AUDUSD、AUDSGD、AUDCHF、NZDUSD、NZDCAD、EURCAD、EURUSD、E
トレンド スクリーナー インジケーターでトレンド取引の力を解き放ちます。ファジー ロジックと複数通貨システムを活用した究極のトレンド取引ソリューションです。 ファジー ロジックを活用した革新的なトレンド インジケーターである Trend Screener を使用して、トレンド取引を向上させます。 これは、13 を超えるプレミアム ツールと機能、および 3 つの取引戦略を組み合わせた強力なトレンド追跡インジケーターであり、Metatrader をトレンド アナライザーにする多用途の選択肢となります。 期間限定オファー : トレンド スクリーナー インジケーターは、わずか 100 ドルで生涯ご利用いただけます。 (元の価格 50$ ) (オファー延長) Trend Screener の 100% 非再描画精度の揺るぎない精度を体験して、取引の決定が過去の価格変動の影響を受けないようにしてください。 マルチタイムフレームおよびマルチ通貨機能の多用途性を解放し、比類のない自信を持って外国為替、商品、暗号通貨、インデックスの世界を取引できるようにします。 Trend Screener の包括的な
BTMM State Engine Pro is a MetaTrader 5 indicator for traders who use the Beat The Market Maker approach: Asian session context, kill zone timing, level progression, peak formation detection, and a multi-pair scanner from a single chart. It combines cycle state logic with a built-in scanner dashboard so you do not need the same tool on many charts at once. What it does Draws the Asian session range; session times can follow broker server offset or be set in inputs. Tracks level progression (L
まず第一に、この取引インジケーターは再描画されず、再描画されず、遅延しないことを強調する価値があります。これにより、手動取引とロボット取引の両方に理想的なものになります。 ユーザーマニュアル:設定、入力、戦略。 アトミックアナリストは、価格の強さとモメンタムを利用して市場でより良いエッジを見つけるためのPA価格アクションインジケーターです。ノイズや誤ったシグナルを除去し、取引ポテンシャルを高めるための高度なフィルターを備えています。複雑なインジケーターの複数のレイヤーを使用して、アトミックアナリストはチャートをスキャンし、複雑な数学的計算をシンプルなシグナルと色に変換します。これにより、どのような初心者トレーダーでも理解して使用し、一貫した取引の決定を行うことができます。 「アトミックアナリスト」は、新規および経験豊富なトレーダー向けにカスタマイズされた包括的な取引ソリューションです。プレミアムインジケーターとトップノッチの機能を1つの取引戦略に組み合わせ、すべてのタイプのトレーダーにとって汎用性のある選択肢にします。 デイリートレーディングとスキャルピング戦略:高速で正確なデイ
FX Power: 通貨の強弱を分析して、より賢い取引を実現 概要 FX Power は主要通貨と金の実際の強弱をあらゆる市場状況で理解するための必須ツールです。強い通貨を買い、弱い通貨を売ることで、 FX Power は取引の意思決定を簡素化し、高い確率の取引機会を見出します。トレンドを追従する場合でも、極端なデルタ値を使用して反転を予測する場合でも、このツールはあなたの取引スタイルに完全に適応します。ただ取引するだけではなく、 FX Power で賢く取引をしましょう。 1. なぜ FX Power がトレーダーにとって非常に有益なのか 通貨と金のリアルタイム強弱分析 • FX Power は主要通貨と金の相対的な強弱を計算し、マーケットダイナミクスに関する明確な洞察を提供します。 • どの資産がリードしているか、または後れを取っているかを監視して、取引するペアを賢く選びましょう。 マルチタイムフレームの包括的なビュー • 短期、中期、長期のタイムフレームで通貨と金の強弱を追跡し、マーケットトレンドに基づいて取引戦略を調整できます。 • スキャルピングからスイングトレード
Auto Optimized Parabolic RSI: 高度な3Dモメンタムエンジン ほとんどのリテール向けインジケーターは、市場のボラティリティが変化した瞬間に破綻する静的な入力値に依存しているため、失敗に終わります。Auto Optimized Parabolic RSIは、自らの数学的優位性を継続的に再計算することで「インジケーターの陳腐化」問題を解決し、機関投資家レベルの定量的適応力をMT5ターミナルに直接もたらします。 最大の強み: カスタムインメモリ3D最適化 標準的な自動最適化ツールは、インジケーターの呼び出しで端末に過負荷をかけるため、頻繁にMT5プラットフォームをフリーズさせます。本ツールは、このボトルネックを完全に回避しています。RAMベースのカスタムネイティブ計算機を内蔵した内部エンジンは、チャートを読み込んだりタイムフレームを変更したりするたびに、超高速の3Dグリッド探索を実行します。RSI期間(頻度)、SARステップ(加速度)、SAR最大値(制限速度)を同時にスイープし、プラットフォームを遅延させることなく、数万通りものパラメーターの組み合わせを絶対的なミ
RelicusRoad Pro: 定量的市場オペレーティングシステム 【期間限定】無制限アクセス 70% OFF - 2,000人超のトレーダーと共に なぜ多くのトレーダーは「完璧な」インジケーターを使っても失敗するのでしょうか? それは、文脈を無視して 単一の概念 だけでトレードしているからです。文脈のないシグナルは単なるギャンブルです。勝ち続けるには、 根拠の重なり(コンフルエンス) が必要です。 RelicusRoad Proは単なる矢印インジケーターではありません。完全な 定量的市場エコシステム です。独自のボラティリティモデリングを用いて、価格が推移する「適正価値の道(Fair Value Road)」をマッピングし、ノイズと真の構造的ブレイクを判別します。 推測はやめましょう。機関投資家レベルの「ロード・ロジック」でトレードを。 コアエンジン:「Road」アルゴリズム システムの中心となる Road Algo は、市場環境にリアルタイムで適応するダイナミックなボラティリティチャネルです。 安全ライン(平衡点) と、価格が数学的に反転しやすい 拡張レベル を投影します。 Si
ARICoin is a powerful trading companion designed to generate high-probability entry signals with dynamic TP/SL/DP levels based on volatility. Built-in performance tracking shows win/loss stats, PP1/PP2 hits, and success rates all updated live. Key Features: Buy/Sell signals with adaptive volatility bands Real-time TP/SL/DP levels based on ATR Built-in MA Filter with optional ATR/StdDev volatility Performance stats panel (Success, Profit/Loss, PP1/PP2) Alerts via popup, sound, push, or email Cust
ARIPoint is a powerful trading companion designed to generate high-probability entry signals with dynamic TP/SL/DP levels based on volatility. Built-in performance tracking shows win/loss stats, PP1/PP2 hits, and success rates all updated live. Key Features: Buy/Sell signals with adaptive volatility bands Real-time TP/SL/DP levels based on ATR Built-in MA Filter with optional ATR/StdDev volatility Performance stats panel (Success, Profit/Loss, PP1/PP2) Alerts via popup, sound, push, or email Cu
MERAVITH SCANNERは、MetaTrader 5用のプロフェッショナルな金融市場インジケーターで、複数の分析ツールを一つの統合システムにまとめています。独自の出来高加重平均価格(VWAP)手法を使用してすべての計算を自動で行い、主観的な解釈を完全に排除します。 このインジケーターは、すべての資産クラス(FX、株式、指数、商品、暗号通貨)およびM1から月足までのすべての時間軸で動作します。基本原理は「価格は出来高に従う」というものです。MERAVITHは機関投資家の出来高が集中するポイントを特定し、その集中から数学的に正確な価格レベルを導き出します。予測や投機は行わず、計算のみを行います。 MERAVITH SCANNERを使用すると、28の主要FX通貨ペアをすべての時間軸でわずか2~3分でスキャンできます。また、任意の市場をスキャンすることも可能です。例えば、約100銘柄の株式を約10分でスキャンできます。 インジケーターは、消耗レベル、均衡線、偏差、統計レベル、およびターゲット予測を算出します。 チャート要素 Origin Point :すべての計算が始まる起点です。イン
Was: $299  Now: $99  Supply Demand uses previous price action to identify potential imbalances between buyers and sellers. The key is to identify the better odds zones, not just the untouched ones. Blahtech Supply Demand indicator delivers functionality previously unavailable on any trading platform. This 4-in-1 indicator not only highlights the higher probability zones using a multi-criteria strength engine, but also combines it with multi-timeframe trend analysis, previously confirmed swings a
Master Editionは、ボリュームとマネーフローの視点を通じて市場構造を可視化するために設計されたプロフェッショナルグレードの分析ツールです。標準のボリュームインジケーターとは異なり、このツールはチャート上に日足ボリュームプロファイルを直接表示し、価格発見がどこで行われたか、そして「スマートマネー」がどこに位置しているかを正確に確認できます。 このMaster Editionは、明確さとスピードを考慮して設計されており、ロード時にチャートレイアウトを即座に美化するユニークな自動テーマ同期システムを備えています。 主な機能: 真のマネーフロー計算: 標準のティックボリュームを超えます。「Use Money Flow」を有効にすると、ボリュームは価格によって重み付けされ、特定の価格レベルでの実際の資本コミットメントが明らかになります。 バリューエリア (VA) の可視化: バリューエリア(デフォルトではボリュームの70%)を自動的に計算します。 VA Fill: コントロールゾーンを即座に識別するために、バリューエリアの背景をシェーディングします。 主要レベル: コントロールポイン
Candle Smart Range
Gianny Alexander Lugo Sanchez
5 (1)
MetaTrader 5用 Candle Smart Range (CSR) Candle Smart Rangeは、複数のタイムフレームで価格レンジを自動的に識別するためのテクニカル指標です。このツールは、ローソク足の形成と、以前の高値・安値との相互作用に基づいて市場構造を分析します。 主な機能: レンジ検出: 勢いのある動きの前のコンソリデーション(保ち合い)ゾーンを特定します。 だまし(フェイクアウト)の識別: 価格が以前の水準を超えたものの、ローソク足の終値基準でレンジ内に戻った場合をマークします。 マルチタイムフレーム分析: カスタム期間を含む最大19のタイムフレームのデータを1つのチャートに表示します。 内部可視化(ズーム): チャートを切り替えずに、上位足のローソク足内部の値動きを確認できます。 時間フィルター: 主要な市場セッションなど、特定の時間帯で動作するように設定可能です。 履歴確認モード: 過去のデータをステップバイステップで確認し、分析できます。 アラート機能: ローソク足の確定や新しいレンジの検出を通知します。 インターフェース: 視覚的な負荷を管理する画面
まず第一に、この取引ツールはノンリペイント、ノンリドロー、ノンラグの指標であり、プロの取引に理想的ですことを強調する価値があります。 オンラインコース、ユーザーマニュアル、デモ。 スマートプライスアクションコンセプトインジケーターは、新米から経験豊富なトレーダーまで、非常 に強力なツールです。Inner Circle Trader AnalysisやSmart Money Concepts Trading Strategiesなど、20以上の有用な指標を1つに組み合わせています。このインジケーターはスマートマネーコンセプトに焦点を当て、大手機関の取引方法を提供し、彼らの動きを予測するのに役立ちます。 特に、流動性分析に優れており、機関がどのように取引しているかを理解しやすくしています。市場のトレンドを予測し、価格の動きを慎重に分析するのに優れています。機関の戦略とトレードを合わせることで、市場の動向についてより正確な予測ができます。このインジケーターは多目的であり、市場構造を分析し、重要な注文ブロックを特定し、さまざまなパターンを認識するのに優れています。 このインジケーター
Gartley Hunter Multi - An indicator for searching for harmonic patterns simultaneously on dozens of trading instruments and on all possible timeframes. Manual (Be sure to read before purchasing) | Version for MT4 Advantages 1. Patterns: Gartley, Butterfly, Shark, Crab. Bat, Alternate Bat, Deep Crab, Cypher 2. Simultaneous search for patterns on dozens of trading instruments and on all possible timeframes 3. Search for patterns of all possible sizes. From the smallest to the largest 4. All fou
Bill Williams Advanced is designed for automatic chart analysis using Bill Williams' "Profitunity" system. The indicator analyzes four timeframes at once. Manual (Be sure to read before purchasing) Advantages 1. Analyzes the chart using Bill Williams' "Profitunity" system. Signals are displayed in a table in the corner of the screen and on the price chart. 2. Finds all known AO and AC signals, as well as zone signals. Equipped with a trend filter based on the Alligator. 3. Finds "Divergence Bar
TPA True Price Action indicator reveals the true price action of the market makers through 100% non-repainting signals strictly at the close of a candle! TPA shows entries and re-entries, every time the bulls are definitely stronger than the bears and vice versa. Not to confuse with red/green candles. The shift of power gets confirmed at the earliest stage and is ONE exit strategy of several. There are available now two free parts of the TPA User Guide for our customers. The first "The Basics"
トレンドラインは、外国為替取引におけるテクニカル分析の最も重要なツールです。残念ながら、ほとんどのトレーダーはそれらを正しく描画していません。自動トレンドラインインジケーターは、市場のトレンドの動きを視覚化するのに役立つ本格的なトレーダー向けのプロフェッショナルツールです。 トレンドラインには、強気トレンドラインと弱気トレンドラインの2種類があります。 上昇トレンドでは、外国為替トレンドラインは価格変動の最低スイングポイントを介して描画されます。 少なくとも2つの「最低安値」を接続すると、トレンドラインが作成されます。 下降トレンドでは、トレンドラインは価格変動の最も高いスイングポイントを介して描画されます。 少なくとも2つの「最高値」を接続すると、トレンドラインが作成されます。 トレンドラインが壊れたとき? 弱気のろうそくが強気のトレンドラインの下で閉じ、ろうそくの高さがトレンドラインの上にあるとき、強気のトレンドラインは壊れます。 強気のろうそくが弱気のトレンドラインの上で閉じ、ろうそくの安値がトレンドラインの下にあるとき、弱気のトレンドラインは壊れます。 トレ
作者のその他のプロダクト
If you need more information than a few numbers in the iExposure index, this indicator is for you. Better iExposure indicator is an improvement over the original information, such as: Separate profit column for BUY and SELL Separate SL column for BUY and SELL Separate TP column for BUY and SEL Average Price as Horizontal Line in Chart Pip Value www.foxwave.eu
Basic tool Showing annual candle, range for Day, range for Week, range for Month, range for Year. Showing fibonacci for Day fibonacci for Week, fibonacci for Month, fibonacci for Year. Showing percent change for Day, percent change for Week, percent change for Month, percent change for Year. Showing distance of the current value the previous close for Day, Week, Month, Year.
What are Fibonacci Numbers and Lines? Fibonacci numbers are used to create technical indicators using a mathematical sequence developed by the Italian mathematician, commonly referred to as "Fibonacci," in the 13th century. The sequence of numbers, starting with zero and one, is created by adding the previous two numbers. For example, the early part of the sequence is 0, 1, 1, 2, 3, 5, 8, 13, 21, 34, 55, 89,144, 233, 377, and so on. The Fibonacci sequence is significant because of the so-calle
This is a simple and very effective utility for closing in profir or in loss. Constant overview of daily Draw Down, Current profit and Daily profit This utility will save your deposit in case of a sharp market change. Just add it to any free chart and use it for your daily trading. Thanks to the minimal set of parameters, you can easily set up the utility for any symbol in MT4
Easy EA for closing positions with profit or loss. All positions of chart's symbol are counted separately. Settings: TPforSymbol — set profit amount to indicate when to close every positions for the symbol of the chart. Swap and commission are decreasing your profit. SLforSymbol — set SL amount to indicate SL for every positions for the symbol of the chart. Swap and commission are increasing your loss. SLforSyblol is always below/equal zero.
This multi-currency annual dashboard analyzes the nearest high and low to the current price for a chosen number of recent years. It displays how many pips away the price is from the nearest high or low. You can set a pip threshold, and the alert will notify you when the price gets close to the specified levels. In real-time, the dashboard also provides an overview of the closest high or low values for each specific year, helping you make informed trading decisions.
Key level analysis : The indicator tracks the nearest annual high and low to the current price over a chosen number of years. Proximity alerts : It triggers an alert when the price reaches a specified number of pips from the nearest high or low. Customizable notification intervals : You can set how often alerts repeat, for example, every 30 minutes. Historical perspective : Enables long-term tracking of market levels and effective planning of trading strategies. Multi-currency support : This ind
iExposure Fox Wave – Comprehensive Position Monitoring Indicator iExposure Fox Wave is an advanced MetaTrader indicator designed to provide detailed monitoring of all open trading positions in a clear, tabular format. This tool is perfect for traders who want all essential trade information in one place. Key Features: Symbol: Displays the instruments (currency pairs or other symbols) with open positions. Deals: Number of open trades (transactions) for each symbol. Buy lots & Buy price: Total vol
RangeDashboard – Multi-symbol Daily, Weekly, and Monthly Range Overview with Alerts RangeDashboard is a powerful and user-friendly indicator that displays the current range (high-low) of selected currency pairs or instruments over a chosen timeframe (D1, W1, MN1) directly on the chart. It allows you to input a customizable list of symbols, add suffixes if needed, and select the timeframe from which the ranges are calculated. Key Features: Dynamic calculation of ranges for any number of symbols o
Fox Wave PSAR – PSAR Dashboard for Multiple Symbols and Timeframes Description: Fox Wave PSAR is a powerful indicator for MetaTrader 5 that allows you to monitor the Parabolic SAR (PSAR) across multiple symbols and timeframes directly in a clear and convenient dashboard. It is ideal for scalping, intraday, and long-term trading strategies. Key Features: Clear dashboard with a list of symbols and their current PSAR status. Supports any number of symbols and customizable suffixes (e.g., ".m"). Di
New High / Low Dashboard Scanner is not a common indicator. It is a market-structure control system designed to monitor, in real time, the creation of new Highs and Lows across Daily, Weekly, Monthly, and Yearly time horizons — while simultaneously measuring the exact distance of price from these critical levels in pips. This tool is built for traders who do not want to react late, but instead want to stand at the origin of market movement . What the system does The dashboard continuously scan
Short Description Fox Wave Account Nexus is a professional dashboard for real-time monitoring of multiple MetaTrader 5 accounts across different terminals from a single chart. Full Description  Fox Wave Account Nexus Professional Multi-Account Monitoring Dashboard for MetaTrader 5 Fox Wave Account Nexus is a powerful visual dashboard designed for traders who operate multiple MT5 accounts simultaneously and need instant, centralized control . The indicator collects live data from all con
Fox Wave Pro Copier - Professional Multi-Master Trade Copier Copy trades from multiple Master accounts simultaneously with advanced risk management Key Features Multi-Master Architecture Copy from unlimited master accounts simultaneously Automatic master account detection or manual configuration Real-time trade synchronization via file system Independent risk management for each master Advanced Risk Management Individual risk settings per master account Automatic lot size calculation based
TREND SCANNER PRO - Multi-Timeframe Trend Analysis Dashboard Professional real-time trend scanner that monitors up to 15 currency pairs across 8 timeframes simultaneously. Get instant market overview with epic visual dashboard, smart alerts, and zero lag performance. KEY FEATURES
Professional Averaging Calculator - Essential Risk Management Tool for Every Trader Whether you're a beginner learning position averaging or a professional managing complex grid strategies, this calculator is your must-have tool. Beginners instantly see how averaging works, understand maximum loss scenarios, and learn proper risk management before entering trades - no more "I didn't know I could lose that much" surprises. Professionals save time and eliminate calculation errors with instant simu
フィルタ:
レビューなし
レビューに返信