Cool iExposure
- インディケータ
- バージョン: 1.1
- アップデート済み: 29 10月 2019
- アクティベーション: 5

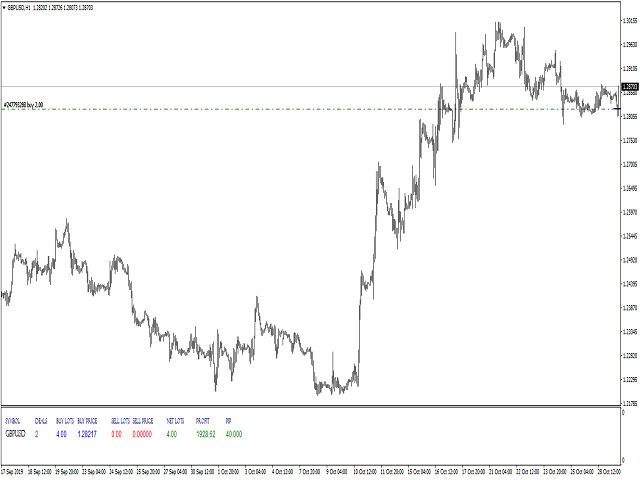
If you need more information than a few numbers in the iExposure index, this indicator is for you.
Better iExposure
indicator is an improvement over the original information, such as:
- Separate profit column for BUY and SELL
- Separate SL column for BUY and SELL
- Separate TP column for BUY and SEL
- Average Price as Horizontal Line in Chart
- Pip Value
- www.foxwave.eu

Wonderfull!!