Visual Return Calculator Simple
- インディケータ
- バージョン: 1.0

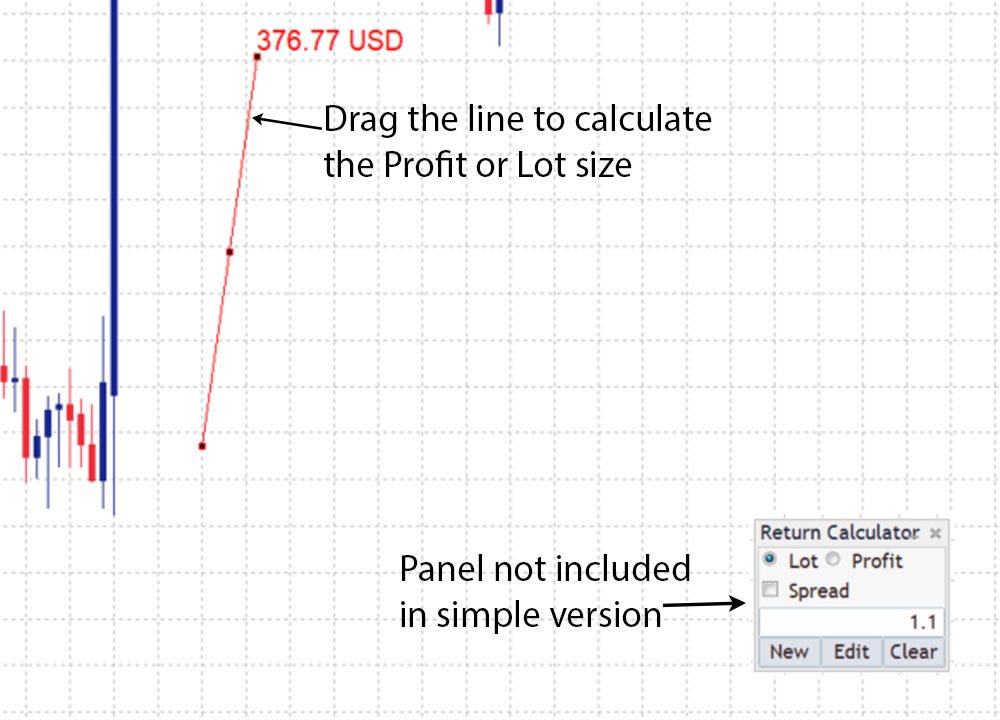
The Visual Result Calculator Indicator is a powerful tool designed to enhance your trading experience on the MetaTrader platform. This intuitive and user-friendly indicator allows you to visualize potential profits or losses on a trading chart, helping you make better-informed decisions and manage your trades with precision. The Indicator displays a dynamic line on the trading chart, representing the potential profit or loss of a trade based on the start and end of the line. Simply click and drag to adjust the positions, and the indicator will instantly update to show the corresponding profit or loss potential. With the Indicator, you can easily determine the appropriate lot size required to achieve a predefined profit target. By inputting your desired profit value, the indicator automatically calculates the lot size.
input parameters:
ValueType - define what will be in the value, if Lot is selected, on graph will be calculated potential Profit for a trade opened at start of the line and closed on end of the line with defined Lot size in value parameter
Value - size of Profit or Lot depending on valueType parameter
Full version available on market https://www.mql5.com/en/market/product/103332 In full version you have panel available where you can:
- include spread into calculation
- have multiple lines on chart
- easily edit properties of the line
MT5 version https://www.mql5.com/en/market/product/103423