Symbol Name Drawer

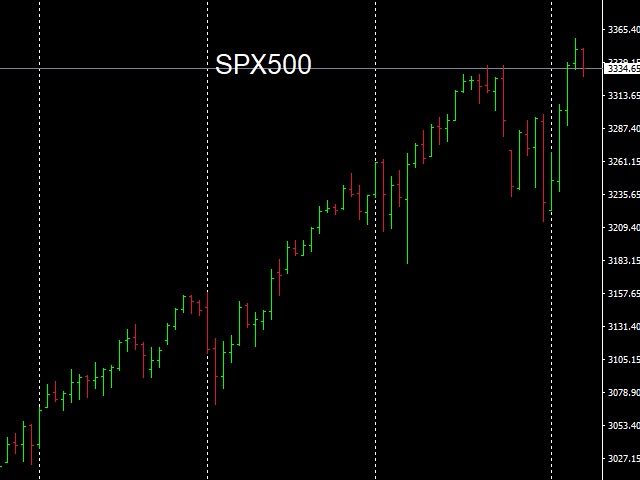
Add indicator "Symbol Name Drawer " on chart. Indicator creates text object with name of current symbol.


You can change symbols on chart and indicator automatically changes text.


Free to use. Simple tool.


If you have any suggestion you can write me about it in comments. I try to improve this tool in future versions. Thanks for using my indicator.

If you want to order something special in mql4 or mql5 message.

おすすめのプロダクト
Check out other great products from  https://www.mql5.com/en/users/augustinekamatu/seller   This indicator is the best so far at determining the currency strength of each pair. It provides stable values and is highly adaptive to market changes. It is a great tool to add to your arsenal to make sure you are on the right side of the trend at all times. No inputs required, it is simple plug and play. A Winning Trading Strategy This article describes the components and logic needed to develop a tra
FREE
Screener Breakout Congestion
CARLO FINANCIAL SOFTWARE TECHNOLOGY LLC
5 (2)
Screener Breakout Congestion: Have you ever missed a trading opportunity because you were not looking at the chart of that market in that specific time frame? Here is this screener to help you identify congestion breakouts in the markets you want to follow in the different time frames required. Once you have identified the markets (forex, indices, CDF) and the different time frames (1M, 5M, 15M, 30M, 1H, 4H, Daily), the screener is represented by several buttons that change colour when the conge
FREE
通貨強度マルチメーターインジケーターは、以下の各通貨の強度、方向、ランクを示します。 AUD CAD CHF EUR GBP JPY NZD USD さらに、次の各通貨ペアの強さ、方向、ランクも表示されます。 AUDCAD AUDCHF AUDJPY AUDNZD AUDUSD CADCHF CADJPY CHFJPY EURAUD EURCAD EURCHF EURGBP EURJPY EURNZD EURUSD GBPAUD GBPCAD GBPCHF GBPJPY GBPNZD GBPUSD NZDCAD NZDCHF NZDJPY NZDUSD USDCAD USDCHF USDJPY インジケーターは、任意のチャートおよび任意の時間枠で機能します。各通貨と通貨ペアの強さ、方向、ランクデータは、インジケーターバッファーを通じてアクセスできます。チャートにインジケーターをドロップしてすべての情報を表示するか、インジケーターを設定して、それが表示されている特定のチャートの通貨と通貨ペアのみを表示することができます。 データは、通貨と通貨ペアの横棒グラフとして表示されます。また、
FREE
Have you ever wondered which currency is the strongest at any particular time? Or which currency pair is trending the most. Well, the currency strength meter helps with just that.  It compares  USD ,  EUR ,  AUD ,  CHF ,  GBP ,  CAD  and  NZD  depending on the timeline you have chosen in settings, and ranks them on the number of pips each has moved compared to the rest. N/B:   All currency charts of the above pairs must have loaded. You can do this by highlighting all major and minor currencies
FREE
This indicator is designed for calculating the value of points for the specified lot sizes. The MT5 version is here  https://www.mql5.com/en/market/product/29230 Description by lines Line 1 - deposit currency. Line 2 - lot size (10 input parameters) . All further values are calculated into columns below each lot size. Line 3 - calculation of value for one point. Line 4 - calculation of value for spread. All subsequent lines - calculation of value for points (20 input parameters) . All you need t
FREE
The Indicator show Daily Pivot Points. It is possible to specify the number of days to display. For forex it doesn't consider the sunday session data. It is possibile to modify the color, style and  width for every level.It is better to use this indicator with timeframe not higher than Н1. 4 Levels of support and resistance with also Intermediate Levels that is possible to hide.
FREE
The purpose of this new version of the MT4 standard indicator provided in your platform is to display in a sub-window multiple timeframes of the same indicator. See the example shown in the picture below. But the display isn’t like a simple MTF indicator. This is the real display of the indicator on its timeframe. Here's the options available in the FFx indicator: Select the timeframes to be displayed (M1 to Monthly) Define the width (number of bars) for each timeframe box Alert pop up/sound/ema
FREE
PZ Penta O MT4
PZ TRADING SLU
2.33 (3)
The Penta-O is a 6-point retracement harmonacci pattern which usually precedes big market movements. Penta-O patterns can expand and repaint quite a bit. To make things easier this indicator implements a twist: it waits for a donchian breakout in the right direction before signaling the trade. The end result is an otherwise repainting indicator with a very reliable trading signal. The donchian breakout period is entered as an input. [ Installation Guide | Update Guide | Troubleshooting | FAQ | A
FREE
ULTIMATE PRO PANEL WITH TRADE THE RANGE SYSTEM (MT4) インジケーター説明 ULTIMATE PRO PANEL WITH TRADE THE RANGE SYSTEM は、MetaTrader 4 用の高度な意思決定支援インジケーターで、複雑な市場分析をシンプルで視覚的なトレードフレームワークに変換します。 このインジケーターは、市場行動の定量モデルを使用してリアルタイムの市場状況を評価し、高確率のトレードチャンスと価格レンジを特定するのに役立ちます。 システムは確率分析とレンジロジックを組み合わせ、トレーダーが市場が拡張期、トレンド期、または価格制御レンジ内にあるかを判断できるようにします。 主な分析パラメータ システムは、以下の3つの機関レベルのパラメータを使用します: 1. 市場スコア(モメンタム強度) 方向性の圧力を測定: 相対モメンタムの不均衡 通貨強度の偏差 価格の挙動 スコアが高いほど、強い方向性の意図を示します。 2. ADR残量(日中拡張可能性) 平均日次レンジ(ADR)内で価格がどれだけ動けるかを表示。 ADRが低
FREE
Basic Renko MT4
Mehran Sepah Mansoor
3.86 (7)
基本的なRenkoインディケータは、明確で簡潔な相場観を求めるトレーダーにとって強力なツールです。当社のインディケータは、トレンドの視覚化を簡素化するだけでなく、反転の正確なアラートを提供し、あなたの取引に戦略的な優位性を提供します /  MT5無料版 特徴 フルカスタマイズ可能: 高度なカスタマイズオプションにより、インジケーターをお好みに合わせてカスタマイズできます。色からボックスサイズ設定まで、チャート上の情報表示方法を完全にコントロールできます。 反転アラート: 反転アラートで、市場の方向性が変化する可能性をいち早く知ることができます。これにより、利益を最大化し、損失を最小化するために、情報に基づいたタイムリーな意思決定を行うことができます。 入力項目 Size of the boxes:   ボックスサイズ(ポイントベース) Bullish box colour:   強気ボックスの色 Bearish box colour:   弱気ボックスの色 Box opacity:   不透明度(0から100の間)。不透明度が低くなるにつれて透明度が高くなる Text col
FREE
FFx Force Index
Eric Venturi-Bloxs
5 (1)
The purpose of this new version of the MT4 standard indicator provided in your platform is to display in a sub-window multiple timeframes of the same indicator. See the example shown in the picture below. But the display isn’t like a simple MTF indicator. This is the real display of the indicator on its timeframe. Here's the options available in the FFx indicator: Select the timeframes to be displayed (M1 to Monthly) Define the width (number of bars) for each timeframe box Alert pop up/sound/ema
FREE
Lines Profit Loss
Taras Slobodyanik
4.65 (17)
インジケーターは現在のシンボルの利益(損失)を表示します。 線を自由にドラッグ&ドロップして現在の損益を表示できます。 You can find my products   here パラメーター Calculation in money or in points — 損益をポイントまたは金額で計算します。 Add pending orders to calculate — 計算では未決注文を考慮します。 Magic Number (0 - all orders on symbol) — 特定の注文を評価する必要がある場合のマジック ナンバー。 Offset for first drawing (points from the average price) — 最初の開始時の平均価格からのラインのオフセット。 Decimal places for calculating the Sum — 合計を表示するための小数点以下の桁数。 Decimal places for calculating the Percentage — パーセンテージを表示するための小数点以下の桁数。
FREE
Discover the power of precision and efficiency in your trading with the " Super Auto Fibonacci " MT4 indicator. This cutting-edge tool is meticulously designed to enhance your technical analysis, providing you with invaluable insights to make informed trading decisions. Key Features: Automated Fibonacci Analysis: Say goodbye to the hassle of manual Fibonacci retracement and extension drawing. "Super Auto Fibonacci" instantly identifies and plots Fibonacci levels on your MT4 chart, saving you tim
FREE
製品名 Smart Stochastic (MT4) – SmartView シリーズ 短い説明 MetaTrader プラットフォームで独特なユーザー体験を提供する Stochastic インジケーター。以前は利用できなかった高度な機能を提供し、ダブルクリックで設定を開く、削除せずにインジケーターを非表示/表示する、インジケーターウィンドウをチャート全体のサイズで表示するなどの機能を備えています。SmartView Indicators シリーズの残りの部分とシームレスに連携するように設計されています。 概要 SmartView シリーズは、革新的な機能を通じて MetaTrader プラットフォーム上のインジケーターに独特で特徴的なユーザー体験を提供し、インジケーター管理をより速く、より簡単にします。各インジケーターには、チャート上のスマートコントロールパネルが装備されており、基本情報を表示し、すべての重要な機能への迅速なアクセスを提供します。 以前は利用できなかった独自の機能 SmartView シリーズは、インジケーターでの作業をより簡単で迅速にする高度な機能を提供します: ダ
FREE
価格波形パターン MT4へようこそ --(ABCD パターン)--     ABCD パターンは、テクニカル分析の世界で強力で広く使用されている取引パターンです。 これは、トレーダーが市場での潜在的な売買機会を特定するために使用する調和的な価格パターンです。 ABCD パターンを使用すると、トレーダーは潜在的な価格変動を予測し、いつ取引を開始および終了するかについて十分な情報に基づいた決定を下すことができます。 EA バージョン :   Price Wave EA MT4 MT5バージョン: Price Wave Pattern  MT5 特徴 :  ABCDパターンの自動検出。 強気パターンと弱気パターン。  任意のシンボルと任意の時間枠で機能します。 主要なレベルと価格目標。 カスタマイズ可能な設定と繊維レベルの調整。 アラートと通知。 今後さらに多くの機能が追加される予定です。 
FREE
Volatility Limit Trend Indicator (VLT), an original indicator by this developer,  is a trend indicator based on setting a fixed volatility limit as a percentage of price. Volatile price is allowed to wander between two channel lines defining the fixed volatility about a central line. The price crossing one of the channel lines defines an exceeding of the allowed volatility, and ushering in one of two situation : either a continuation or a reversal of trend. The first buffer of the indicator (not
FREE
Highlights trading sessions on the chart The demo version only works on the AUDNZD chart!!! The full version of the product is available at: (*** to be added ***) Trading Session Indicator displays the starts and ends of four trading sessions: Pacific, Asian, European and American. the ability to customize the start/end of sessions; the ability to display only selected sessions; works on M1-H2 timeframes; The following parameters can be configured in the indicator: TIME_CORRECTION = Correct
FREE
YOU CAN NOW DOWNLOAD FREE VERSIONS OF OUR PAID INDICATORS . IT'S OUR WAY OF GIVING BACK TO THE COMMUNITY ! >>>    GO HERE TO DOWNLOAD Camarilla Pivots Historical plots the historical data of the camarilla pivot point levels on the chart. The Camarilla Pivot levels was originated in 1989 by Nick Scott. The levels are used as primary support and resistance levels by Intraday traders. The levels are calculated with the following formula: R4 = C + RANGE * 1.1/2 R3 = C + RANGE * 1.1/4 R2 = C + RANG
FREE
IceFX SpreadMonitor is a special spread logging indicator which displays the current, minimum/maximum and average spread values. These values are set to be visible even after a reboot. Also, SpreadMonitor could save all the desired spread values to .csv files for later analysis of the results. Indicator parameters: SpreadLowLevel - low level of spread (show value in green color) SpreadHighLevel - high level of spread (show value in red color) BGColor - background of panel SpreadNormalColor - co
FREE
How To Trade Execute your trades in 3 Easy Steps! Step 1: Trade Setup Entry Buy = If daily open market Above Line PIVOT or can Price has touched and closed the candle above Resistance1. Entry Sell = If daily open market Under Line PIVOT or can Price has touched and closed the candle above Support1. Step 2: Set Stop Loss Stop loss BUY ----> You can set stop loss on Line Pivot or Support1.  Stop loss SELL ----> You can set stop loss on Line Pivot or Resistance1.  Step 3: Set Take Profit Take profi
FREE
Show Pips
Roman Podpora
4.26 (58)
この情報インジケーターは、アカウントの現在の状況を常に把握したい人にとって役立ちます。このインジケーターには、ポイント、パーセンテージ、通貨での利益、現在のペアのスプレッド、現在の時間枠でバーが閉じるまでの時間などのデータが表示されます。 バージョンMT5 -   より便利なインジケーター チャート上に情報線を配置するには、いくつかのオプションがあります。 価格の右側 (価格の後ろにあります); コメントとして (グラフの左上隅に); 画面の選択した隅。 情報区切り記号を選択することもできます。 | / 。 \ # インジケーターにはホットキーが組み込まれています。 キー 1 - 情報表示の種類に戻ります (価格、コメント、コーナーの右側) キー 2 - 情報表示の種類を 1 つ進みます。 キー 3 - 情報ライン表示の位置を変更します。 ホットキーは設定で再割り当てできます。 このインジケーターは使いやすく、非常に有益です。設定で不要な情報項目を無効にすることも可能です。 設定 表示された情報を置き換えるホット キー (戻る)   - 情報表示の種類に戻ります。 表示情報を切り替
FREE
マルチタイムフレーム対応、カスタマイズ可能なビジュアルシグナル、設定可能なアラートシステムを備えたBalance of Power(BOP)インジケーター。 フリーランスプログラミングサービス、アップデート、その他のTrueTL製品は私の MQL5プロフィール からご利用いただけます。 フィードバックとレビューを大歓迎します! BOPとは? Balance of Power(BOP)は、価格の変化をバーの値幅と比較することで、買い手と売り手の強さを測定するオシレーターです。インジケーターは(終値 - 始値)/(高値 - 安値)として計算され、その後Simple Moving Average(SMA)で平滑化されます。 BOP値は-1から+1の間で変動します。正の値は買い手が強いことを示し(終値が始値より高い)、負の値は売り手が強いことを示します(終値が始値より低い)。値の大きさは動きの強さを示します。BOPは買い圧力と売り圧力のバランスを示すことで、市場の強さと潜在的な反転を識別するのに役立ちます。 特徴: 矢印と垂直線によるビジュアルシグナルマーカー 設定可能なトリガーを持つ3
FREE
True Points PRO
Evgenii Aksenov
4.53 (15)
True Points PRO   indicator analyzes the dynamics of price changes and determines the true pivot points. The indicator calculates and displays the total profit and the probability of achieving it.  The indicator has built-in Take Profit levels: TP1 captures profit at a given level; TP2 is considered automatically (regulated by the Low Level parameter).  Information about the profit and the current signal is displayed in the moving information panel. The Result parameter calculates all profits a
FREE
This indicator alerts you when/before new 1 or 5 minute bar candle formed. In other words,this indicator alerts you every 1/5 minutes. This indicator is especially useful for traders who trade when new bars formed. *This indicator don't work propery in strategy tester.Use this in live trading to check functionality. There is more powerful Pro version .In Pro version,you can choose more timeframe and so on. Input Parameters Alert_Or_Sound =Sound ----- Choose alert or sound or both to notify y
FREE
The Sessions Partition Indicator draws clear, accurate session separators for the Sydney, Tokyo, London, and New York trading sessions. It automatically adapts to your broker’s server time and allows full GMT customization. Designed especially for IC Markets (Winter – GMT+2) , this indicator gives traders a clean visual structure of the market’s intraday phases – making session-based strategies MUCH easier to follow. Key Features 4 Major Forex Sessions Marked Sydney Session Tokyo Session Lon
FREE
Symbol Cycler is a lightweight on-chart utility that lets you quickly switch between symbols in your Market Watch list using two simple arrow buttons (). With a single click, you can scroll forward or backward through your predefined symbols without leaving the chart. Key Features: One-click symbol switching from the chart Works with your Market Watch list order Buttons can be placed in any chart corner or even the center Timeframe remains locked while switching symbols Clean, responsive UI
FREE
Risk Profit tool
Aleksandr Krokhalev
4.55 (33)
This indicator allows you to manage your exposure and see how the lot changes. You can choose the optimal lot value for your deposit without opening real positions. And also evaluate new trading instruments. If you trade manually, then risk management will help you avoid unexpected losses. The indicator includes the ability to receive a sound signal when a specified level is reached, as well as send push notifications and a message to the mail.
FREE
Are you tired of drawing trendlines every time you're analyzing charts? Or perhaps you would like more consistency in your technical analysis. Then this is for you. This indicator will draw trend lines automatically when dropped on a chart. How it works Works similar to standard deviation channel found on mt4 and mt5. It has 2 parameters: 1. Starting Bar 2. Number of bars for calculation The   starting bar   is the bar which drawing of the trend lines will begin, while the   number of bars for c
FREE
For Multi Time Frame version, please click here. BASE TRADING SYSTEM is a useful tool to trade with simple strategy. It draws automatically base up for long trade and base down for short trade. Clear trade when base is going opposite direction. User can trade by instant market entry or by pending order entry. It depends on user best strategy. input: Base Box Color- UP base box , DOWN base box, UP base shadow, Down base shadow.
FREE
外国為替マーケットプロファイル(略してFMP) これは何ではありません: FMPは、従来の文字コード化されたTPO表示ではなく、チャートデータプロファイルの計算全体を表示しません。また、チャートを期間に分割して計算しません。 それが何をするか: 最も重要なことは、FMPインジケーターは、ユーザー定義のスペクトルの左端とユーザー定義のスペクトルの右端の間にあるデータを処理することです。 ユーザーは、インジケーターの両端をマウスで引くだけでスペクトルを定義できます。 インジケーターの右端がライブバーに引き寄せられ、さらに(将来に)引っ張られると、インジケーターは「ライブ」と見なされます(新しいバーで更新されます) インジケーターは、アタッチされているチャートに「アンカー」オブジェクトをドロップし、その後、そのアンカーをハードドライブ上のファイルに関連付けます。 これにより、チャート(またはインジケーター)が閉じられるまで、再起動しても設定が維持された状態で、チャート上で継続的なFMPを実行できます。 FMPインジケーターは、1つのチャート上でそれ自体の多くのインスタンスを実行でき、
FREE
このプロダクトを購入した人は以下も購入しています
An exclusive indicator that utilizes an innovative algorithm to swiftly and accurately determine the market trend. The indicator automatically calculates opening, closing, and profit levels, providing detailed trading statistics. With these features, you can choose the most appropriate trading instrument for the current market conditions. Additionally, you can easily integrate your own arrow indicators into Scalper Inside Pro to quickly evaluate their statistics and profitability. Scalper Inside
Gann Made Easy は、ミスター・ギャンの理論を使用した取引の最良の原則に基づいた、プロフェッショナルで使いやすい外国為替取引システムです。 W・D・ガン。このインジケーターは、ストップロスとテイクプロフィットレベルを含む正確な買いと売りのシグナルを提供します。 PUSH通知を利用して外出先でも取引可能です。 ご購入後、取引方法の説明と優れた追加インジケーターを無料で入手するには、私にご連絡ください! おそらく、ギャンの取引手法についてはすでに何度も聞いたことがあるでしょう。通常、ギャンの理論は初心者のトレーダーだけでなく、すでにある程度の取引経験がある人にとっても非常に複雑なものです。なぜなら、ギャンの取引手法は理論的にはそれほど簡単に適用できるものではないからです。私はその知識を磨き、最良の原則を私の外国為替インジケーターに組み込むために数年を費やしました。 このインジケーターは非常に簡単に適用できます。必要なのは、それをチャートに添付し、簡単な取引推奨事項に従うだけです。このインジケーターは常に市場分析の仕事を行い、取引の機会を探します。適切なエントリーポイントを検出す
M1 SNIPER は使いやすいトレーディングインジケーターシステムです。M1時間足向けに設計された矢印インジケーターです。M1時間足でのスキャルピングのためのスタンドアロンシステムとして、また既存のトレーディングシステムの一部としても使用できます。このトレーディングシステムはM1時間足での取引に特化して設計されていますが、他の時間足でも使用できます。元々、この手法はXAUUSDとBTCUSDの取引用に設計しましたが、他の市場においても役立つと考えています。 インジケーターのシグナルは、トレンドの方向と逆方向に取引できます。インジケーターのシグナルを利用して両方向に取引するのに役立つ特別な取引テクニックをご紹介します。この手法は、特別な動的なサポートとレジスタンスの価格帯を利用することに基づいています。 ご購入後、M1 SNIPER矢印インジケーターをすぐにダウンロードできます。さらに、M1 SNIPERツールのすべてのユーザーに、以下のスクリーンショットに表示されているApollo Dynamic SRインジケーターを無料で提供しています。この2つのインジケーターを組み合わせることで
まず第一に、この取引インジケーターは再描画されず、再描画されず、遅延しないことを強調する価値があります。これにより、手動取引とロボット取引の両方に理想的なものになります。 ユーザーマニュアル:設定、入力、戦略。 アトミックアナリストは、価格の強さとモメンタムを利用して市場でより良いエッジを見つけるためのPA価格アクションインジケーターです。ノイズや誤ったシグナルを除去し、取引ポテンシャルを高めるための高度なフィルターを備えています。複雑なインジケーターの複数のレイヤーを使用して、アトミックアナリストはチャートをスキャンし、複雑な数学的計算をシンプルなシグナルと色に変換します。これにより、どのような初心者トレーダーでも理解して使用し、一貫した取引の決定を行うことができます。 「アトミックアナリスト」は、新規および経験豊富なトレーダー向けにカスタマイズされた包括的な取引ソリューションです。プレミアムインジケーターとトップノッチの機能を1つの取引戦略に組み合わせ、すべてのタイプのトレーダーにとって汎用性のある選択肢にします。 デイリートレーディングとスキャルピング戦略:高速で正確な
Linear Trend Predictor ー - エントリ ポイントと方向サポート ラインを組み合わせたトレンド インジケーター。高値/安値チャネルを突破するという原理に基づいて機能します。 インジケーターのアルゴリズムは市場のノイズをフィルタリングし、ボラティリティと市場の動向を考慮します。 インジケーターの機能  平滑化手法を使用して、市場のトレンドと、買い注文または売り注文を開くためのエントリー ポイントを表示します。  任意の時間枠のチャートを分析して、短期および長期の市場の動きを判断するのに適しています。  あらゆる市場や時間枠に適応可能な入力パラメータにより、トレーダーはインジケーターを独自にカスタマイズできます。  設定されたインジケーター信号は消えず、再描画もされません。ローソク足の終値で決定されます。  いくつかの種類の通知が矢印と組み合わされています。  このインジケーターは、独立した取引システムとして使用することも、他の取引システムへの追加として使用することもできます。  あらゆるレベルの経験を持つトレーダーが使用できます。 主なパラメータ Vol
「 Dynamic Scalper System 」インジケーターは、トレンド波の中でスキャルピング取引を行う手法のために設計されています。 主要通貨ペアと金でテスト済みで、他の取引商品との互換性があります。 トレンドに沿った短期的なポジションオープンのシグナルを提供し、追加の価格変動サポートも提供します。 インジケーターの原理 大きな矢印はトレンドの方向を決定します。 トレンド波の中では、小さな矢印の形でスキャルピングシグナルを生成するアルゴリズムが機能します。 赤い矢印は強気方向、青い矢印は弱気方向です。 トレンドの方向には敏感な価格変動ラインが描かれ、小さな矢印のシグナルと連動します。 シグナルは次のように機能します。適切なタイミングでラインが現れるとエントリーシグナルが形成され、ラインが開いている間はポジションが保持され、完了すると取引が終了します。 推奨される動作時間枠はM1~H4です。 矢印は現在のローソク足に形成され、次のローソク足が開いている場合は、前のローソク足の矢印は再描画されません。 入力パラメータ Trend Wave Period - トレンド方向
Trend Screener
STE S.S.COMPANY
4.79 (95)
トレンドインジケーター、1つのツールに組み込まれたすべての重要なトレンド機能を備えたトレンドトレーディングとフィルタリングのための画期的なユニークなソリューション! これは、すべてのシンボル/商品(外国為替、商品、暗号通貨、インデックス、株式)で使用できる100%再描画されていないマルチタイムフレームおよびマルチ通貨インジケーターです。 期間限定オファー: サポートおよびレジスタンス スクリーナー インジケーターは、たった 50 ドルで永久的にご利用いただけます。(元の価格 250 ドル) (オファー延長) トレンドスクリーナーは、チャート内のドットで矢印トレンドシグナルを提供するインジケーターに続く効率的なインジケーターです。 トレンド分析インジケーターで使用できる機能: 1.トレンドスキャナー。 2.最大利益分析を備えたトレンドライン。 3.トレンド通貨強度メーター。 4.アラート付きのトレンド反転ドット。 5.アラート付きの強いトレンドドット。 6.トレンド矢印 毎日の分析例、毎日のシグナルパフォーマンス...など、トレンドスクリーナーインジケーターを使用して、ここで見つけること
トレンドラインプロ   市場の真の方向転換点を理解するのに役立ちます。この指標は、真のトレンド反転と主要プレーヤーが再び参入するポイントを示します。 分かりますか     BOSライン   複雑な設定や不要なノイズなしに、より長い時間足でのトレンドの変化と重要なレベルを把握できます。シグナルは再描画されず、バーが閉じた後もチャート上に残ります。 VERSION MT 5     -     RFI LEVELS PRO インジケーター と組み合わせることで、その潜在能力を最大限に発揮します。 インジケーターが示す内容: 本当の変化   トレンド(BOSライン) 一度シグナルが現れたら、それは有効です!これは、リペイント機能を持つインジケーターとの重要な違いです。リペイント機能を持つインジケーターは、シグナルを発した後、それを変更し、資金の損失につながる可能性があります。これにより、より高い確率と精度で市場に参入できます。また、矢印が現れた後、目標値(利益確定)に達するか、反転シグナルが現れるまで、ローソク足の色を変更する機能もあります。 繰り返しエントリ       主要プレーヤーの
NAM Order Blocks
NAM TECH GROUP, CORP.
3.67 (3)
MT4マルチタイムフレームオーダーブロック検出インジケーター。 特徴 -チャートコントロールパネルで完全にカスタマイズ可能で、完全な相互作用を提供します。 -必要な場所でコントロールパネルを表示および非表示にします。 -複数の時間枠でOBを検出します。 -表示するOBの数量を選択します。 -さまざまなOBユーザーインターフェイス。 -OBのさまざまなフィルター。 -OB近接アラート。 -ADRの高線と低線。 -通知サービス(画面アラート|プッシュ通知)。 概要 注文ブロックは、金融機関や銀行からの注文収集を示す市場行動です。著名な金融機関と中央銀行が外国為替市場を牽引しています。したがって、トレーダーは市場で何をしているのかを知る必要があります。市場が注文ブロックを構築するとき、それは投資決定のほとんどが行われる範囲のように動きます。 注文の構築が完了すると、市場は上向きと下向きの両方に向かって急激に動きます。注文ブロック取引戦略の重要な用語は、機関投資家が行っていることを含むことです。それらは主要な価格ドライバーであるため、機関投資家の取引を含むあらゆる戦
GOLD Impulse with Alert
Bernhard Schweigert
4.67 (12)
このインディケータは、当社の2つの製品 Advanced Currency IMPULSE with ALERT  +   Currency Strength Exotics . のスーパーコンビネーションです。 このインジケーターは全ての時間枠で作動し、8つの主要通貨と1つのシンボルの強弱のインパルスをグラフで表示します。 このインジケータは、金、エキゾチックペア、商品、インデックス、先物など、あらゆるシンボルの通貨強度の加速度を表示することに特化されています。金、銀、原油、DAX、US30、MXN、TRY、CNHなどの通貨強度の加速度(インパルスまたは速度)を表示するために、任意のシンボルを9行目に追加できる、この種の最初のものです。 新しいアルゴリズムに基づいて構築され、潜在的な取引の特定と確認がさらに容易になりました。これは、通貨の強さや弱さが加速しているかどうかをグラフィカルに表示し、その加速の速度を測定するためです。加速すると物事は明らかに速く進みますが、これはFX市場でも同じです。つまり、反対方向に加速している通貨をペアリングすれば、潜在的に利益を生む取引を特定
MTF Supply Demand Zones
Georgios Kalomoiropoulos
4.82 (22)
次世代の自動化された需要と供給のゾーン。どのチャートでも機能する新しい革新的なアルゴリズム。すべてのゾーンは、市場の価格行動に従って動的に作成されています。 2種類のアラート --> 1) 価格がゾーンに達したとき 2) 新しいゾーンが形成されたとき もう 1 つの役に立たない指標はありません。実績のある完全な取引戦略を手に入れることができます。     新機能:     価格が需給ゾーンに達したときにアラートを出す     新しい需給ゾーンが作成されたときにアラートを発します     プッシュ通知アラート     ピップ単位のゾーン幅ラベル     MTF のもう 1 つのタイムフレーム。したがって、現在より 2 時間足高いのではなく、現在より 3 時間足し上に見えるようになります。     アラート/ゾーン/MTF 機能を有効/無効にするボタン あなたが得る利点:     取引から感情を取り除きます。     取引エントリをオブジェクト化します。     確率の高いセットアップで利益を上げましょう。     描画ゾーンから時間を節約します。
MetaForecast M4
Vahidreza Heidar Gholami
5 (2)
MetaForecastは、価格データのハーモニクスに基づいて、どんな市場の未来を予測し視覚化します。市場が常に予測可能ではありませんが、価格にパターンがある場合、MetaForecastは可能な限り正確な未来を予測できます。他の類似製品と比較して、MetaForecastは市場のトレンドを分析することでより正確な結果を生成することができます。 入力パラメータ Past size (過去のサイズ) MetaForecastが将来の予測を生成するために使用するバーの数を指定します。モデルは選択したバー上に描かれた黄色の線で表されます。 Future size (将来のサイズ) 予測すべき将来のバーの数を指定します。予測された将来は、ピンクの線で表示され、その上に青い回帰線が描かれます。 Degree (程度) この入力は、MetaForecastが市場で行う分析のレベルを決定します。 Degree 説明  0 Degree 0の場合、価格の全てのピークや谷、そして詳細をカバーするために、「Past size」の入力に大きな値を使用することが推奨されています。  1 (推奨) Degre
Introducing the Delta Volume Profile Indicator - Unleash the Power of Institutional Precision!  Technical Indicator: Are you ready to trade like the pros? The Delta Volume Profile Indicator is no ordinary tool. It’s a high-precision, cutting-edge indicator that puts the power of institutional-grade trading in your hands. This unique indicator analyses delta volume distribution in real-time, revealing the market's hidden buy/sell imbalances that the biggest financial institutions rely on to antic
Dynamic Forex28 Navigator - 次世代の Forex 取引ツール。 現在 49% オフ。 Dynamic Forex28 Navigator は、長年人気のインジケーターを進化させたもので、3 つの機能を 1 つにまとめています。 Advanced Currency Strength28 インジケーター (レビュー 695 件)  + Advanced Currency IMPULSE with ALERT (レビュー 520 件) + CS28 コンボ シグナル (ボーナス)。 インジケーターの詳細 https://www.mql5.com/en/blogs/post/758844 次世代の Strength インジケーターが提供するもの  オリジナルで気に入っていたすべての機能が、新機能と精度の向上によって強化されました。 主な機能: 独自の通貨強度計算式。 すべての時間枠でスムーズかつ正確な強度ライン。 トレンドの特定と正確なエントリーに最適です。 ダイナミックマーケットフィボナッチレベル (マーケットフィボナッチ)。 このインジケーターに固有
Advanced Supply Demand
Bernhard Schweigert
4.91 (299)
現在40%オフ 初心者にもエキスパートトレーダーにも最適なソリューション このインジケーターは独自の機能と新しい公式を多数内蔵しており、ユニークで高品質かつ手頃な取引ツールです。このアップデートでは、2つの時間枠ゾーンを表示できるようになります。より長いTFだけでなく、チャートTFとより長いTF(ネストゾーンを表示)の両方を表示できます。すべてのSupply Demandトレーダーの皆さんのお気に召すはずです。:) 重要情報の公開 Advanced Supply Demandの可能性を最大化するには、 https://www.mql5.com/ja/blogs/post/720245 にアクセスしてください。   エントリーまたはターゲットの正確なトリガーポイントを正確に特定できれば取引がどのように改善されるか想像してみてください。新しい基盤となるアルゴリズムに基づいて構築されているため、買い手と売り手の間の潜在的な不均衡をさらに簡単に特定できます。これは、最も強い需要と供給のゾーンと、過去のパフォーマンス(古いゾーンを表示)がグラフィカルに表現されるためです。これらの機能は、最適な
このインジケーターは、反転ポイントと価格戻りゾーンを正確に表示します。     主要プレーヤー 。新たなトレンドが形成される場所を把握し、最大限の精度で意思決定を行い、すべての取引をコントロールします。 TREND LINES PRO インジケーターと組み合わせることで、その潜在能力を最大限に発揮します。 VERSION MT5 インジケーターが示す内容: 新しいトレンドの始まりに活性化する反転構造と反転レベル。 リスクと報酬の比率を最小限に抑えた利益 確定 と 損失停止の レベルの表示     RR 1:2   。 インテリジェントな削減ロジックによるストップロス。 指定されたインジケーターから 2 つのトレンド タイプの反転パターンを表示します。 指標: トレンドを追う   TREND LINES PRO   (世界的なトレンドの変化) TREND PRO   (クイックトレンド変更) シンプルで効果的   スキャナー   リアルタイムトレンド(新機能)。 マルチタイムフレームのインストゥルメント フィルタリング。 画面   利益     LOGIC AI信号の後。 当日プラス方
Adaptive Volatility Range [AVR] is a powerful tool for identifying key trend reversal points. AVR accurately reflects the Average True Range (ATR) of volatility, taking into account the Volume-Weighted Average Price (VWAP). The indicator adapts to any market volatility by calculating the average volatility over a specific period, ensuring a stable rate of profitable trades. You receive not just an indicator but a professional automated trading system , AVR-EA . Advantages: Automated Trading Sys
説明書(ロシア語)  /  説明書 (英語)  /  バージョン MT5 主な機能: 売り手と買い手のアクティブなゾーンを表示します。 このインジケーターは、買いと売りの適切な最初のインパルスレベル/ゾーンをすべて表示します。これらのレベル/ゾーンがアクティブになると、エントリーポイントの探索が始まり、レベルの色が変わり、特定の色で塗りつぶされます。状況をより直感的に把握できるように、矢印も表示されます。 LOGIC AI - テンプレートをアクティブ化するときにエントリポイントを検索するためのゾーン(円)の表示 視認性を向上させるため、人工知能を用いて進入ポイントを探索したゾーンを表示する機能が追加されました。 より高い時間枠からのレベル/ゾーンの表示(MTFモード) より長い時間間隔でレベル/ゾーンを表示する機能を追加しました。また、インジケーターに自動トレンド検出機能(   TPSproTREND PRO   )を実装しました。 取引のための個別の専門的なステップバイステップのアルゴリズム このアルゴリズムは、トレンドの方向と逆方向の両方でデイトレードを行うために設計されていま
Super Reversal Indicator with Alert 概要 Super Reversal Indicator with Alert は、マルチタイムフレーム分析を用いて高確率の相場反転ポイントを特定するためのトレーディングツールです。ストキャスティクスのモメンタム、需給ゾーン、そして価格のリジェクションシグナルを組み合わせて分析を行います。 本インジケーターは、明確な視覚シグナルとリアルタイムアラートにより、トレーダーが市場の転換点を見極めるのをサポートします。 主な機能 マルチタイムフレーム ストキャスティクス分析 上位時間足のストキャスティクスを使用(ユーザー設定可能) モメンタムの変化やクロスシグナルを検出 エントリー精度を高めるための買われ過ぎ・売られ過ぎレベルを表示 反転リジェクションシグナル 重要な価格帯での強いリジェクションローソク足を検出 以下のポイントでの反転を識別 日足高値での売り反転 日足安値での買い反転 視認性を高めるため、チャート上に矢印を表示 需給ゾーン(Supply and Demand) H4およびD1の上位時間足から重要なゾーンを自動
MT5バージョンはこちらからご利用いただけます: https://www.mql5.com/en/market/product/50048 Telegramチャンネル&グループ: https://t.me/bluedigitsfx V.I.Pグループアクセス: 有料商品の購入証明を当方の受信箱へ送信してください 推奨ブローカー: https://bit.ly/BlueDigitsFxStarTrader BlueDigitsFx Easy 123 System — MT4用の強力な反転およびブレイクアウト検出システム 初心者から上級者まで使いやすい、マーケット構造の変化、ブレイクアウト、トレンド反転を視覚的に捉えるオールインワンのノンリペイントインジケーターです。 本インジケーターは「123」パターンに従って動作します: ステップ1: 新しい高値または安値をビッグアローで表示し、エキゾーストポイント(勢いの弱まり)を示します ステップ2: 構造のブレイクを知らせ、トレンド反転の可能性を示唆します ステップ3: リトルアローとサポート/レジスタンスドットでエントリーを確定します
TrendLine PRO MT4
Evgenii Aksenov
4.83 (167)
The Trend Line PRO indicator is an independent trading strategy. It shows the trend change, the entry point to the transaction, as well as automatically calculates three levels of Take Profit and Stop Loss protection. Trend Line PRO is perfect for all Meta Trader symbols: currencies, metals, cryptocurrencies, stocks and indices. The indicator is used in trading on real accounts, which confirms the reliability of the strategy. Robots using   Trend Line PRO   and real Signals can be found here:   
ブレーカートレーダーになり、価格が反転すると市場構造からの利益が変化します。 注文ブロックブレーカーインジケーターは、トレンドまたは価格の動きが枯渇に近づいており、逆転の準備ができていることを識別します。通常、反転または大規模なプルバックが発生しようとしているときに発生する市場構造の変化について警告します。 この指標は、ブレイクアウトと価格の勢いを識別する独自の計算を使用します。使い果たされる可能性のあるポイントの近くで新しい高値が形成されるたびに、インディケーターはその高値の作成を担当する最後の注文ブロックを描きます。次に、移動する価格とともに注文ブロックを追跡します。その後、価格が反対方向にシフトし、その注文ブロックを突破すると、新しい市場構造を作成し、トレンドまたは大きな後退の可能性のある反転の開始を警告します。 注文ブロックは、高値/安値が作成される前の最後の反対色のろうそくであり、価格がこれらの重要な領域を下抜けすると、トレンドの短期的ま​​たは長期的な反転の兆候です。 特徴 重要な枯渇点での市場構造の変化を警告します 価格が使い果たされるレベルに近づくと、自動的に
通貨強さウィザードは、取引を成功させるためのオールインワン ソリューションを提供する非常に強力な指標です。このインジケーターは、複数の時間枠のすべての通貨のデータを使用して、このまたはその外国為替ペアのパワーを計算します。このデータは、使いやすい通貨インデックスと通貨パワーラインの形式で表され、特定の通貨のパワーを確認するために使用できます。 必要なのは、取引したいチャートにインジケーターを接続することだけです。インジケーターは、取引する通貨の実際の強さを示します。このインジケーターは、トレンドに合わせて取引するときに有利に利用できる売買高の圧力の極値も示します。このインジケーターには、フィボナッチに基づく可能なターゲットも表示されます。 このインジケーターは、PUSH 通知を含むあらゆるタイプのアラートを提供します。 購入後ご連絡下さい。私の取引のヒントをあなたと共有し、素晴らしいボーナスインジケーターを無料で提供します! 幸せで有益な取引をお祈りします。
Volatility Trend System - a trading system that gives signals for entries. The volatility system gives linear and point signals in the direction of the trend, as well as signals to exit it, without redrawing and delays. The trend indicator monitors the direction of the medium-term trend, shows the direction and its change. The signal indicator is based on changes in volatility and shows market entries. The indicator is equipped with several types of alerts. Can be applied to various trading ins
FX Power: 通貨の強弱を分析して、より賢い取引を実現 概要 FX Power は主要通貨と金の実際の強弱をあらゆる市場状況で理解するための必須ツールです。強い通貨を買い、弱い通貨を売ることで、 FX Power は取引の意思決定を簡素化し、高い確率の取引機会を見出します。トレンドを追従する場合でも、極端なデルタ値を使用して反転を予測する場合でも、このツールはあなたの取引スタイルに完全に適応します。ただ取引するだけではなく、 FX Power で賢く取引をしましょう。 1. なぜ FX Power がトレーダーにとって非常に有益なのか 通貨と金のリアルタイム強弱分析 • FX Power は主要通貨と金の相対的な強弱を計算し、マーケットダイナミクスに関する明確な洞察を提供します。 • どの資産がリードしているか、または後れを取っているかを監視して、取引するペアを賢く選びましょう。 マルチタイムフレームの包括的なビュー • 短期、中期、長期のタイムフレームで通貨と金の強弱を追跡し、マーケットトレンドに基づいて取引戦略を調整できます。 • スキャルピングからスイングトレード
Matrix Arrow Indicator MT4
Juvenille Emperor Limited
5 (3)
マトリックスアローインジケーターMT4は、すべてのシンボル/商品(外国為替、商品、暗号通貨、インデックス、株式)で使用できる100%再描画されていないマルチタイムフレームインジケーターに続くユニークな10in1トレンドです。マトリックスアローインジケーターMT4は、初期段階で現在のトレンドを判断し、最大10の標準インジケーターから情報とデータを収集します。 平均方向移動指数(ADX) 商品チャネルインデックス(CCI) クラシック平研アシキャンドル 移動平均 移動平均収束発散(MACD) 相対活力指数(RVI) 相対力指数(RSI) 放物線SAR ストキャスティクス ウィリアムズのパーセント範囲 すべてのインジケーターが有効な買いまたは売りシグナルを与えると、対応する矢印がチャートに印刷され、次のろうそく/バーの開始時に強い上昇トレンド/下降トレンドを示します。ユーザーは、使用するインジケーターを選択し、各インジケーターのパラメーターを個別に調整できます。マトリックスアローインジケーターMT4は選択されたインディケーターからのみ情報を収集し、それらのデータのみに基づいてアローを印刷
Scalper Vault は、スキャルピングを成功させるために必要なすべてを提供するプロフェッショナルなスキャルピング システムです。このインジケーターは、外国為替およびバイナリー オプションのトレーダーが使用できる完全な取引システムです。推奨される時間枠は M5 です。 システムは、トレンドの方向に正確な矢印シグナルを提供します。また、トップとボトムのシグナルとギャン マーケット レベルも提供します。 インジケーターは、プッシュ通知を含むすべてのタイプのアラートを提供します。 インジケータの購入後にご連絡ください。私の個人的な取引の推奨事項と素晴らしいボーナス指標を無料で共有します! 幸せで有益な取引をお祈りします!
現在40%OFF! 初心者やエキスパートトレーダーのためのベストソリューション! このダッシュボードソフトウェアは、28の通貨ペアで動作しています。それは私達の主要な指標(高度な通貨の強さ28と高度な通貨インパルス)の2に基づいています。それは全体の外国為替市場の大きい概観を与えます。それは、すべての(9)時間枠で28の外国為替ペアのための高度な通貨の強さの値、通貨の動きの速度と信号を示しています。チャート上で1つのインディケータを使用して市場全体を観察し、トレンドやスキャルピングの機会をピンポイントで見つけることができたら、あなたのトレードがどのように改善されるか想像してみてください。 このインディケータには、強い通貨と弱い通貨の識別、潜在的な取引の識別と確認がより簡単になるような機能が搭載されています。このインディケータは、通貨の強さや弱さが増加しているか減少しているか、また、すべての時間枠でどのように機能しているかをグラフィカルに表示します。 新機能として、現在の市場環境の変化に適応するダイナミックなマーケットフィボナッチレベルが追加され、すでに当社のAdvanced
Order Block Hunter
Noha Mohamed Fathy Younes Badr
5 (10)
Order block hunter indicator is the best indicator for  hunt the order blocks that area where there has been a large concentration of limit orders waiting to be executed Order blocks are identified on a chart by observing previous price action and looking for areas where the price experienced significant movement or sudden changes in direction .This indicator does that for you by using very complicated codes and helps you to take the best areas To buy and sell because it make marks at the best a
Trend indicator AI
Ramil Minniakhmetov
4.49 (84)
Trend Ai indicatorは、トレンドの識別と実用的なエントリポイントと反転アラートを組み合わせることで、トレーダーの市場分析を強化する優れたツールです。 この指標は、ユーザーが自信と正確さで外国為替市場の複雑さをナビゲートすることを可能にします トレンドAiインジケーターは、主要なシグナル以外にも、プルバックやリトレースメント中に発生するセカンダリエントリポイントを識別し、トレーダーが確立されたトレンド内の価格修正を活用できるようにします。 重要な利点: *MT4およびMT5の仕事 *明確な買いまたは売りシグナル *再描画しません ·すべての資産で動作します 私はeaやセットをtelegram it詐欺で販売しないように注意してください。 すべての設定はここでブログで無料です。  重要! 指示とボーナスを得るために購入後すぐに私に連絡してください! 私の他のプロダクトと同様、実質操作の監視はここに見つけることができます: https://www.mql5.com/en/users/mechanic/seller&nbsp ; 設定および入力: すべての
作者のその他のプロダクト
Chart Linker   This tool is indicator for linking charts in Metatrader 4. Thanks to this tool you have to change symbol only in the main window and all other change automatically. Add this tool to all charts that you want to be linked with each other. Set one chart as a  main. Change symbol in the main window and linked windows change automatically to the new symbol. Compare to  https://www.mql5.com/en/market/product/30048  Chart linker can work simultaniously with other indicators and/or exper
This tool for linking charts in Metatrader 4. Thanks to this tool you have to change symbol only in the main window and all other change automatically. Add this tool to all charts that you want to be linked with each other. Set one chart as a main. Change symbol in the main window and linked windows change automatically to the new symbol. Input parameter isMainChart - set true only for the main chart window. Set false for all other linked windows.
SymbolAutoChanger MT4 There is also PRO version for MetaTreader5 There is also PRO version for MetaTreader4 This tool allows you to automatically change the chart symbols in a loop. Example: EUR → GBP → JPY → CHF → CAD → AUD → NZD You need only to set up interval in seconds between auto switch. Also, you can choose whether to switch between all symbols provided by your broker or only between symbols available in the Market Watch window. Demo version is limited to 4 symbols. Full version allows
FREE
SymbolAutoChanger MT4 There is also PRO version for MetaTreader5 There is also PRO version for MetaTreader4 This tool allows you to automatically change the chart symbols in a loop. Example: EUR → GBP → JPY → CHF → CAD → AUD → NZD You need only to set up interval in seconds between auto switch. Also, you can choose whether to switch between all symbols provided by your broker or only between symbols available in the Market Watch window. There is also PRO version  has following featuters: Next b
SymbolAutoChanger PRO   There is also version for MetaTreader5 This tool allows you to automatically change the chart symbols in a row. Example: EUR → GBP → JPY → CHF → CAD → AUD → NZD You need only to set up interval in seconds between auto switch. Also, you can choose whether to switch between all symbols provided by your broker or only between symbols available in the Market Watch window. PRO version  has following featuters: Next button Previous button Pause/Continue botton With this extra
SymbolAutoChanger PRO MT5   There is also version for MetaTreader4 This tool allows you to automatically change the chart symbols in a row. Example: EUR → GBP → JPY → CHF → CAD → AUD → NZD You need only to set up interval in seconds between auto switch. Also, you can choose whether to switch between all symbols provided by your broker or only between symbols available in the Market Watch window. PRO version  has following featuters: Next button Previous button Pause/Continue botton With this ex
フィルタ:
レビューなし
レビューに返信