Candle Scanner Dashboard
- インディケータ
- バージョン: 2.0
- アップデート済み: 1 8月 2023
- アクティベーション: 10

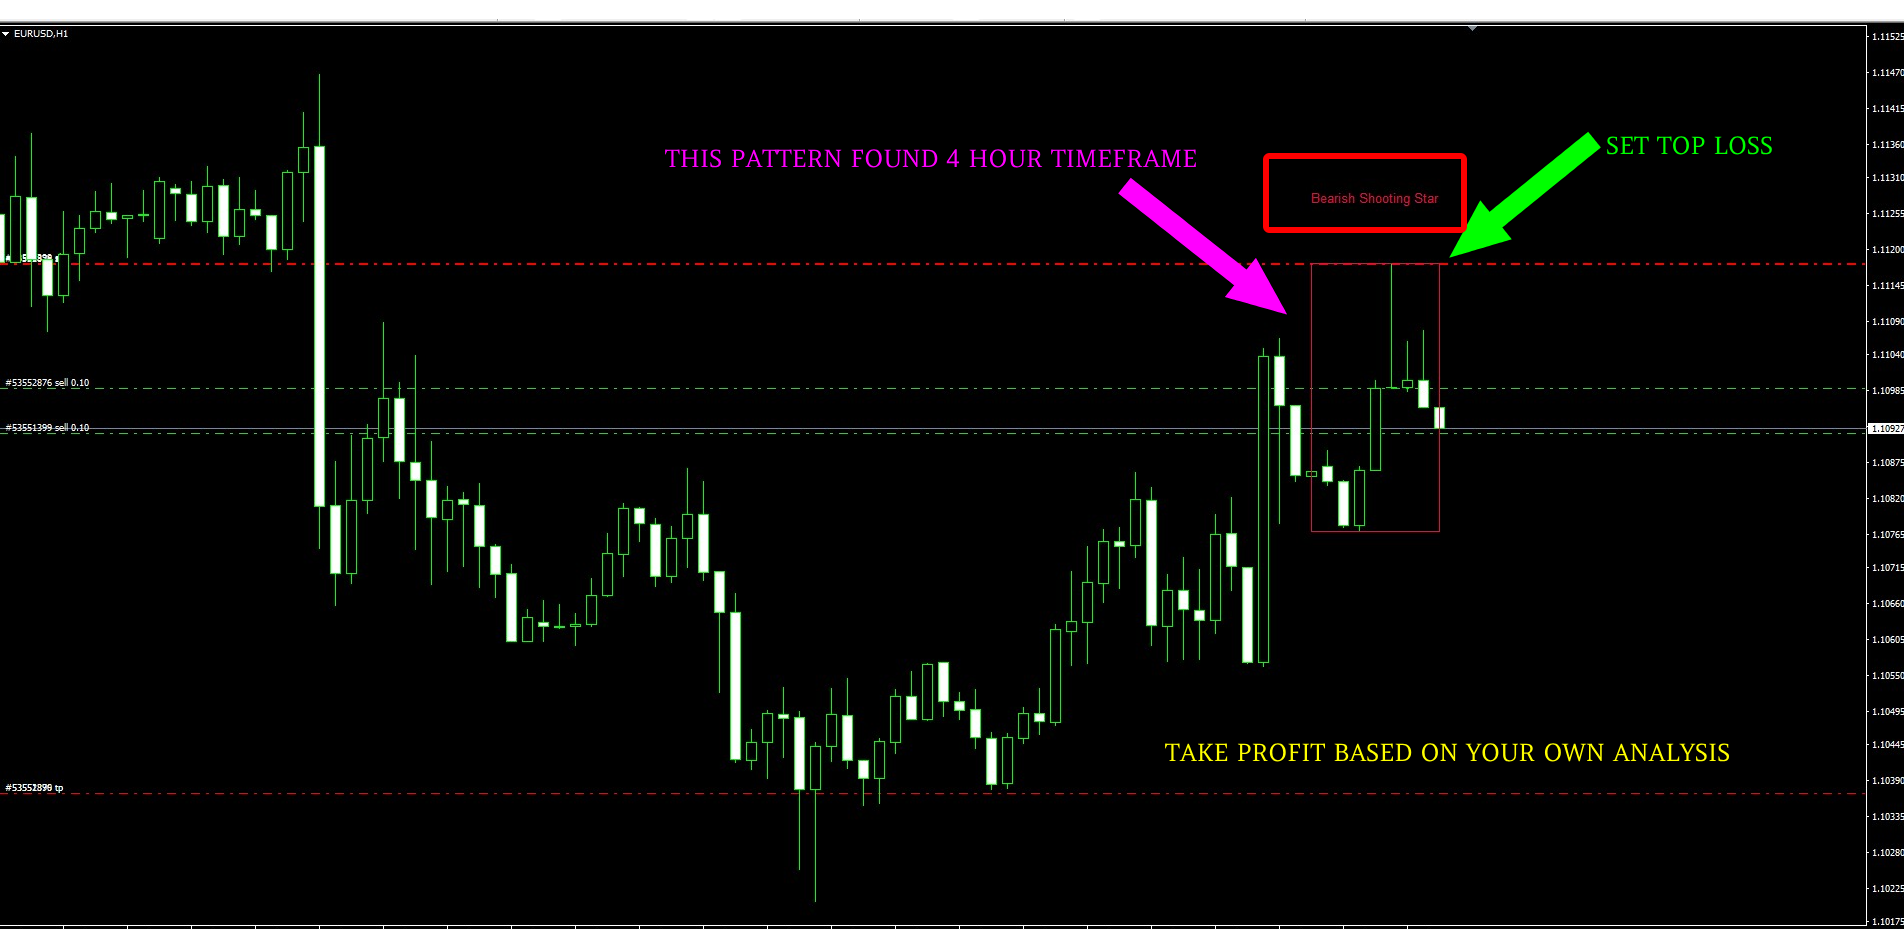
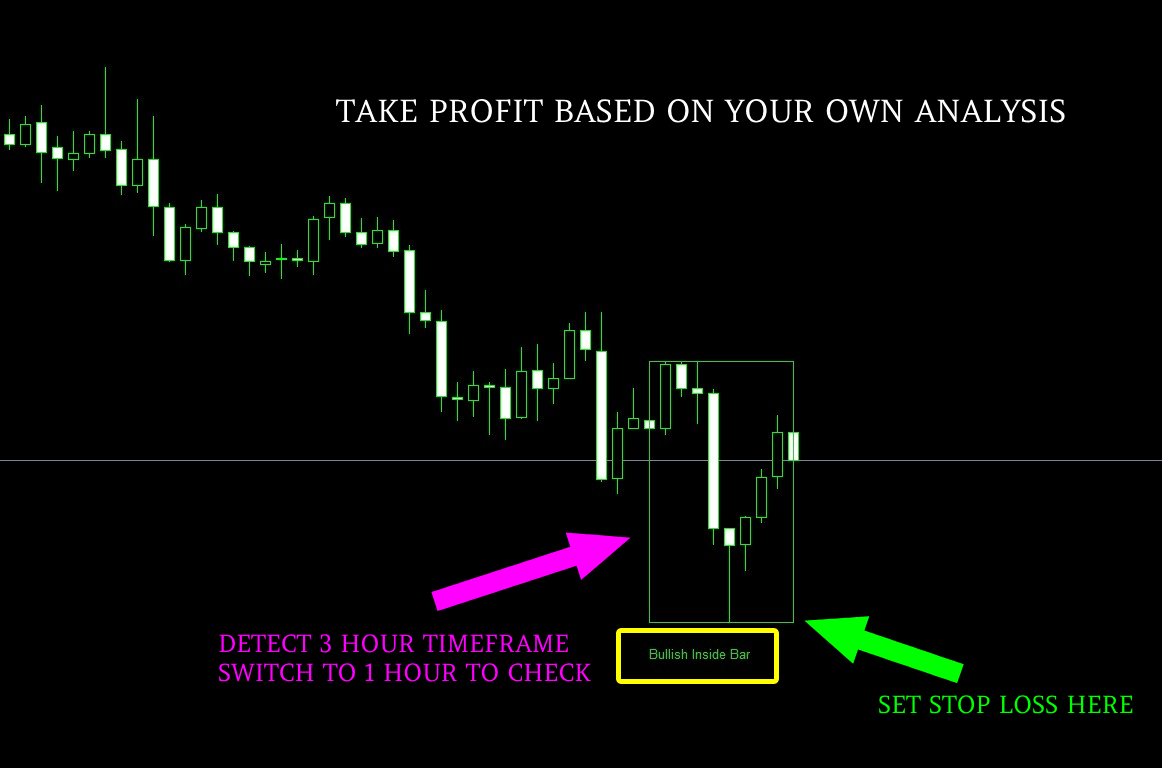
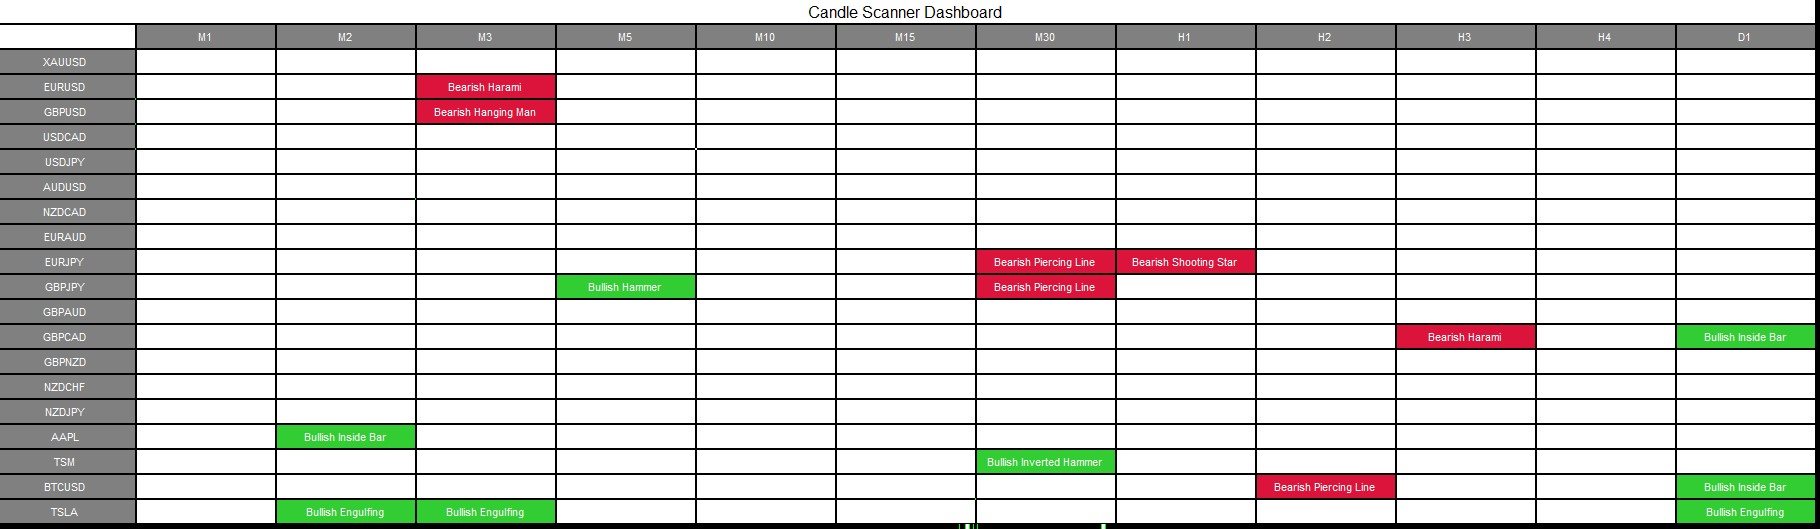
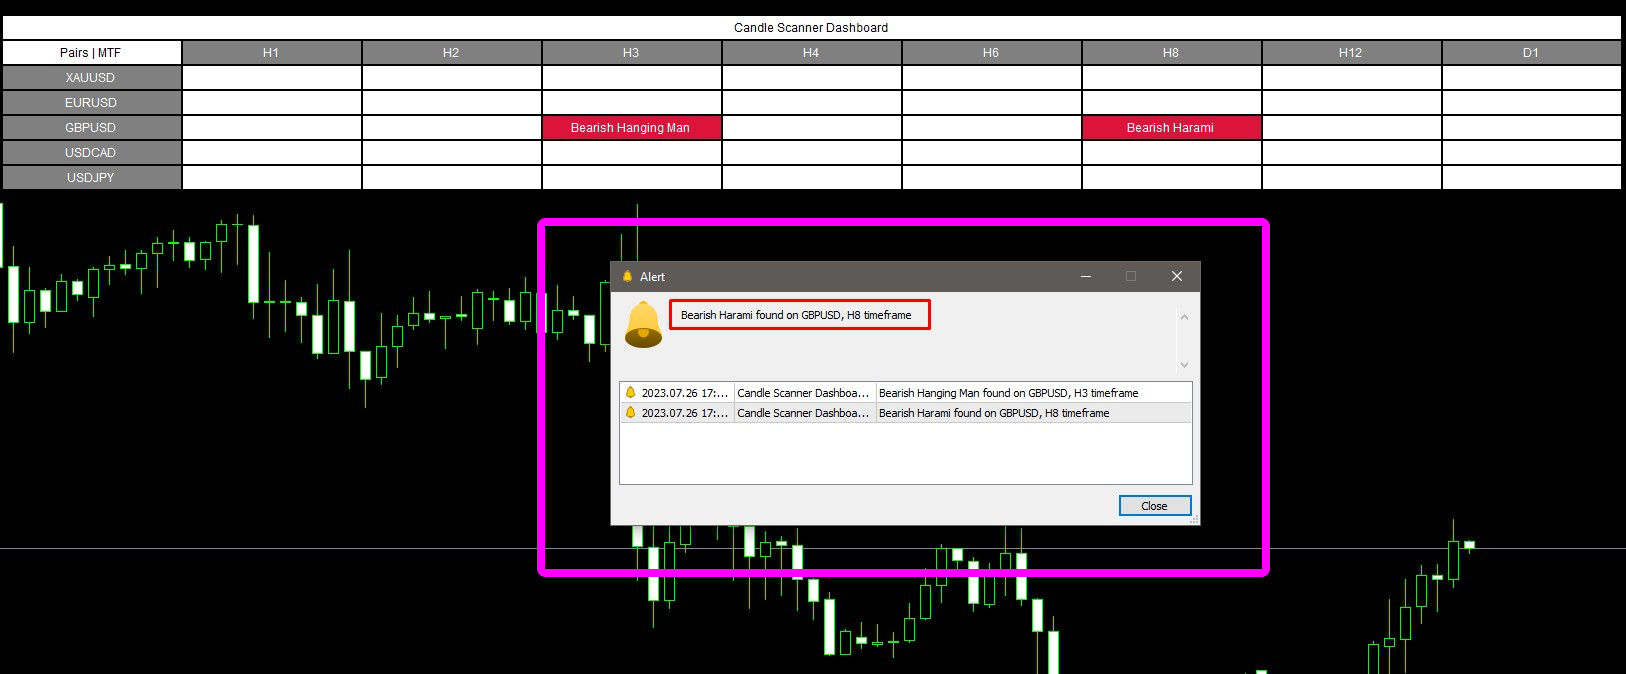
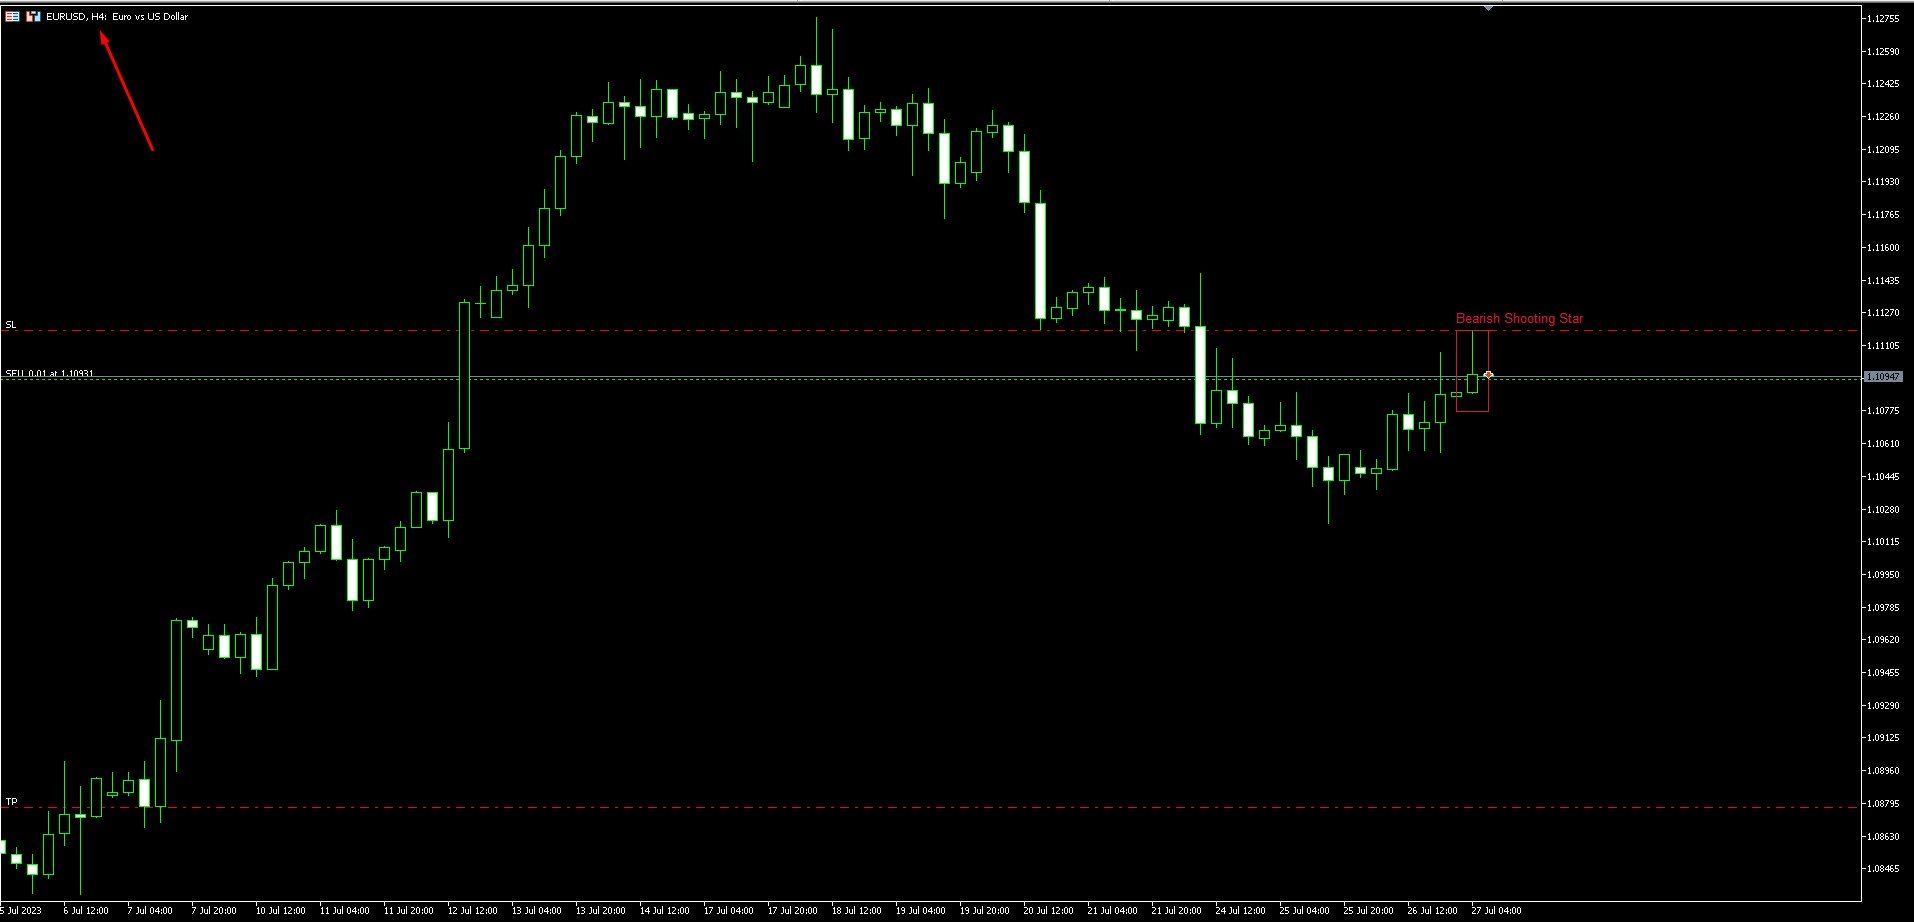
Candle Scanner Dashboard is an incredibly powerful tool in the financial markets. It excels at detecting market reversals, trend changes, and retracements. The dashboard displays patterns as they are identified, and with a simple click on each pattern, you can view them on their dedicated charts to precisely locate their occurrences.
With its capability to detect 11 popular bullish and 11 bearish patterns, you can trust the dashboard to handle pattern identification effortlessly. It provides an impressive 90% accuracy in pattern detection, making it a reliable ally in your trading endeavors.
Moreover, this versatile tool supports Forex, Crypto, Stocks, Bonds, or any types of instruments, giving you the flexibility to trade across various markets with confidence. Furthermore, customizing the dashboard and pattern settings is a breeze, allowing you to tailor it to your specific preferences. Say goodbye to worries as you navigate the markets with confidence using this remarkable Candle Scanner Dashboard.
MT4 VERSION - https://www.mql5.com/en/market/product/102940
Patterns Are : -
| Bullish Patterns | Bearish Patterns |
|---|---|
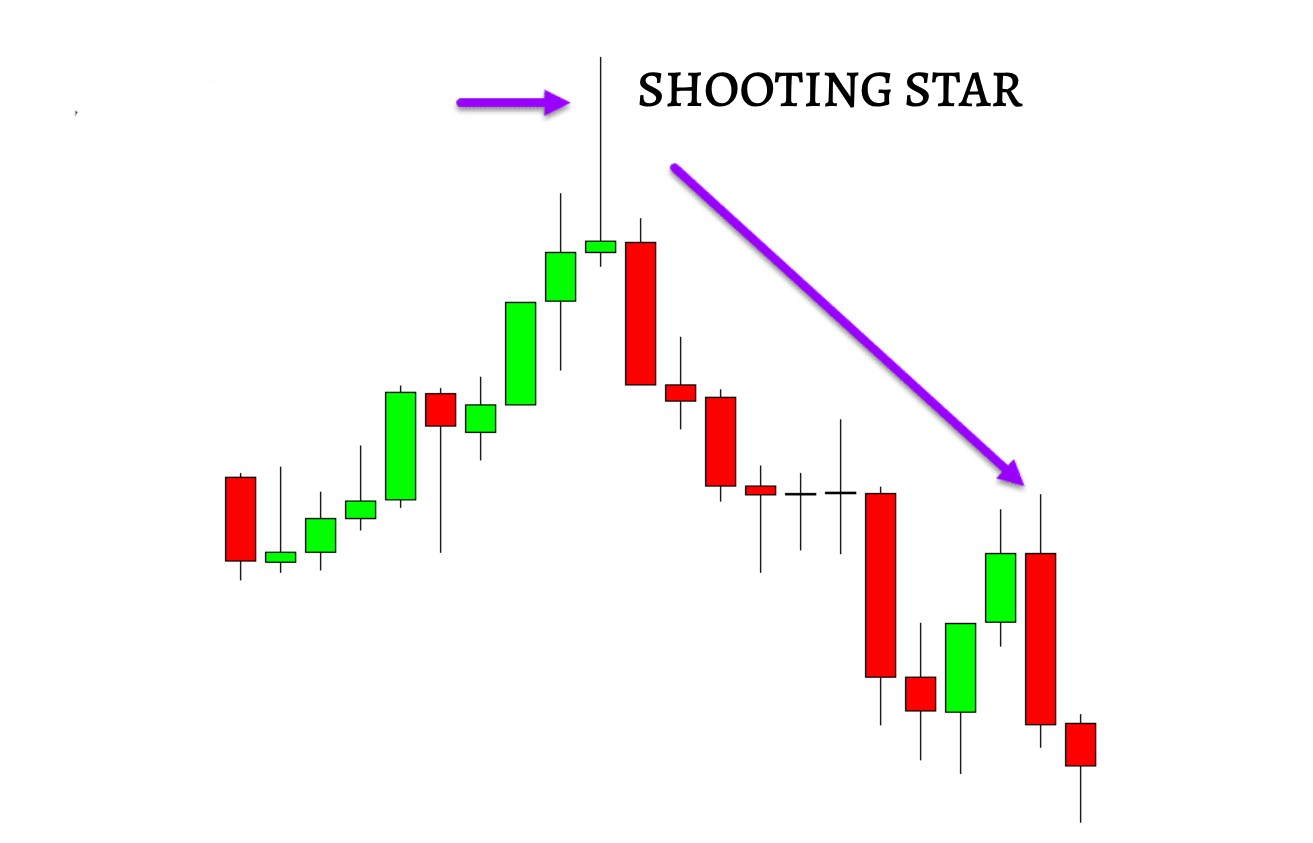
| 1 - Hammer | 1 - Shooting Star |
| 2 - Dragonfly Doji | 2 - Hanging Man |
| 3 - Bullish Engulfing | 3 - Gravestone Doji |
| 4 - Morning Star | 4 - Bearish Engulfing |
| 5 - Morning Doji Star | 5 - Evening Star |
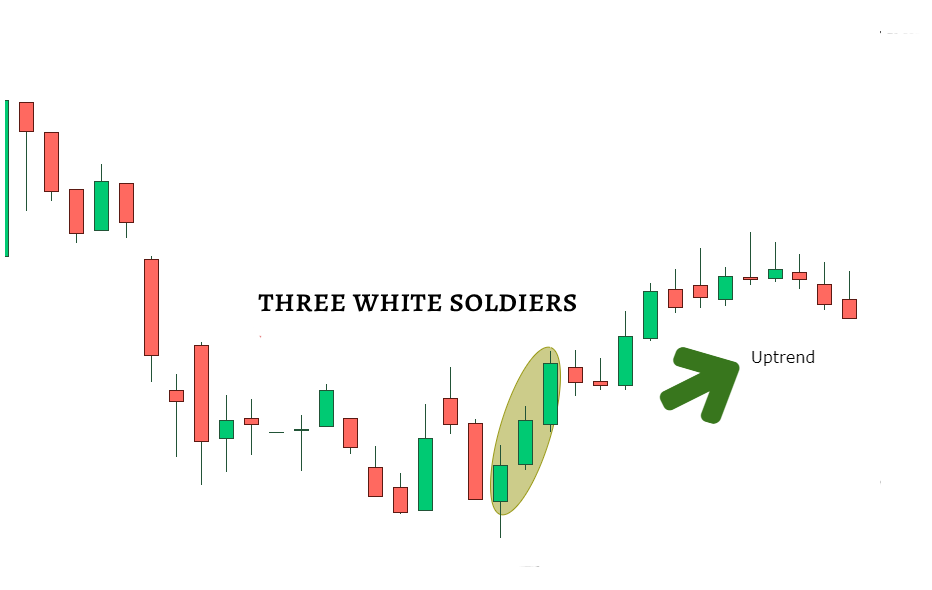
| 6 - Three White Soldiers | 6 - Evening Doji Star |
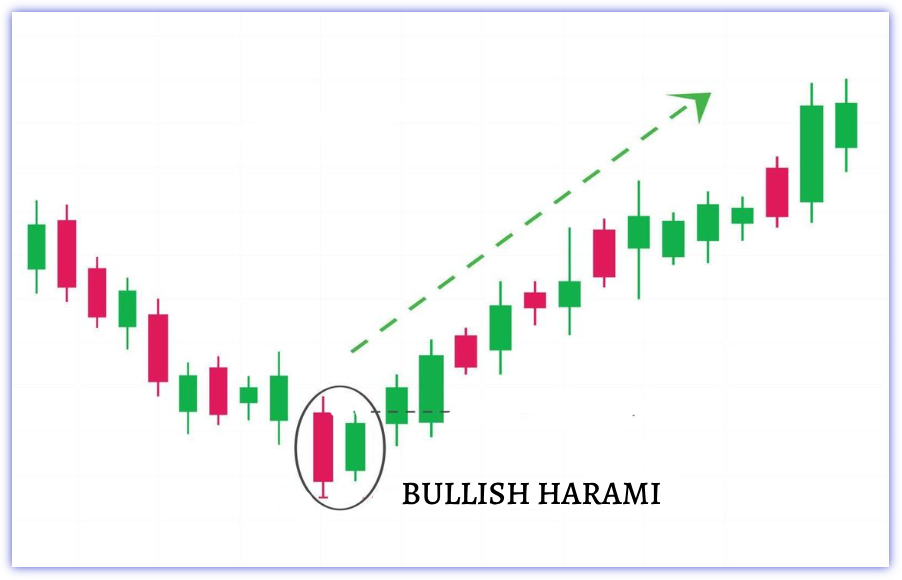
| 7 - Bullish Harami | 7 - Three Black Crows |
| 8 - Inverted Hammer | 8 - Bearish Harami |
| 9 - Bullish Marubozu | 9 - Bearish Marubozu |
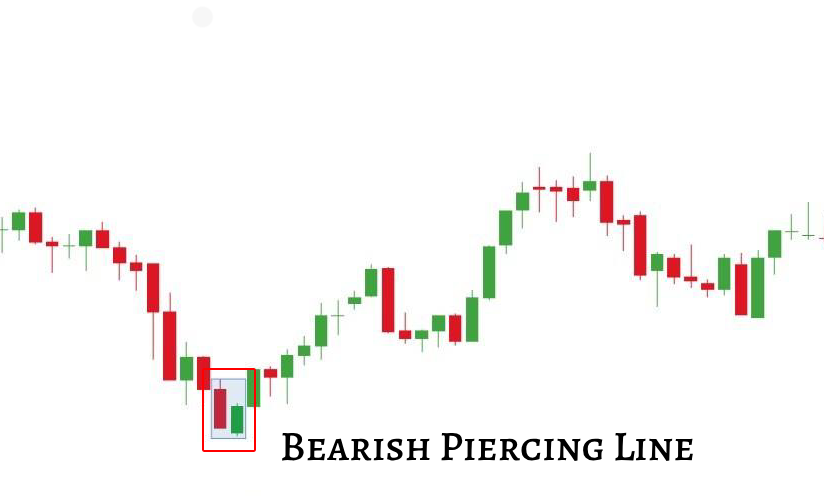
| 10 - Bullish Piercing Line | 10 - Bearish Piercing Line |
| 11 - Bullish Inside Bar | 11 - Bearish Inside Bar |
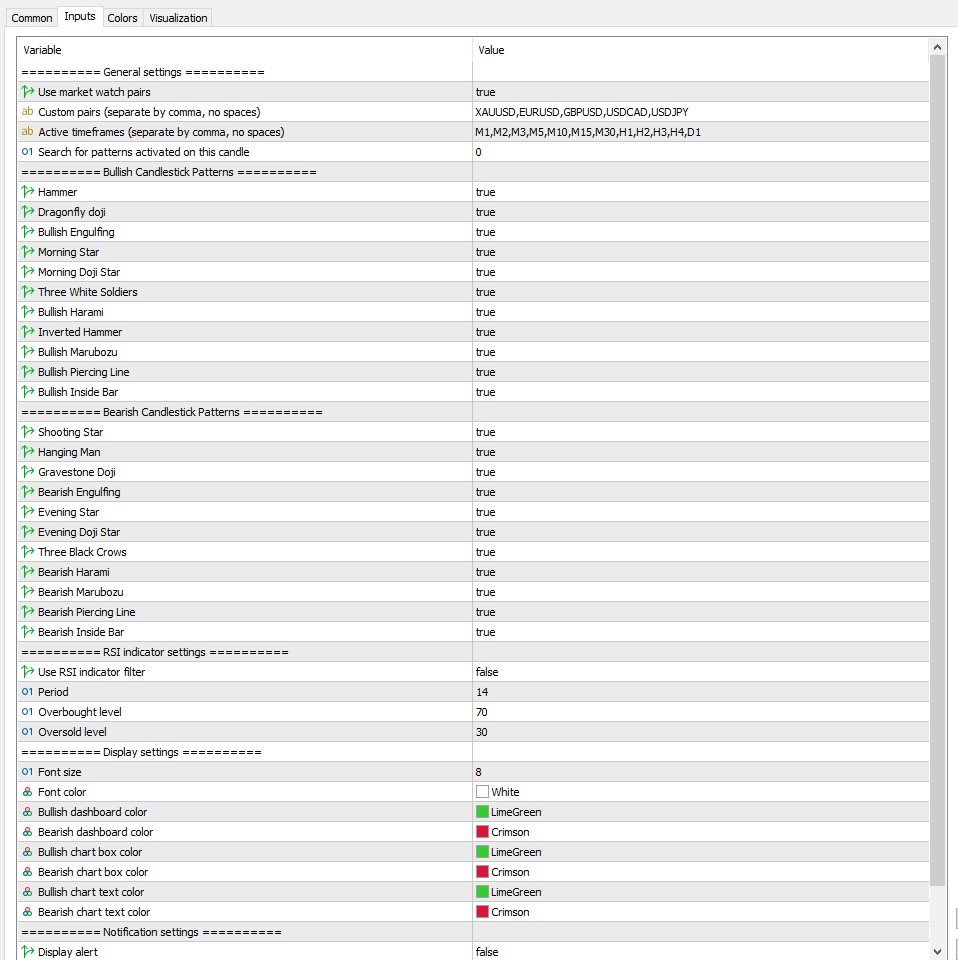
Inputs Are :-
Market Watch
- Market Watch: True/False
- Custom pairs: EURUSD,GBPUSD,USDCAD(Add More)
- Active timeframe: M15,M30,H1,H4,D1(Comma Separated but No Space)
-
Search Patterns
- Recent Candle: Set Search Patterns to 0 to show the most recent candle.
- Previous Candles: Set Search Patterns to 5 or 10 to show the previous 5 or 10 candles, respectively.
Bullish/Bearish Candle Patterns
- Bullish/Bearish candle patterns: True/False
- RSI settings: If RSI true and the price reaches overbought/oversold levels, the dashboard will display any identified patterns at that specific moment.
Font Size and Font Color
- Font size: 12
- Font color: black
Alerts
- Display alerts
- Push notifications
- Send email alerts
NOTE : FEEL FREE CONTACT ME IF YOU FOUND ANY ISSUES. THANK YOU.