Higher Timeframe Chart Overlay MT5
- インディケータ
- バージョン: 1.0
- アクティベーション: 10

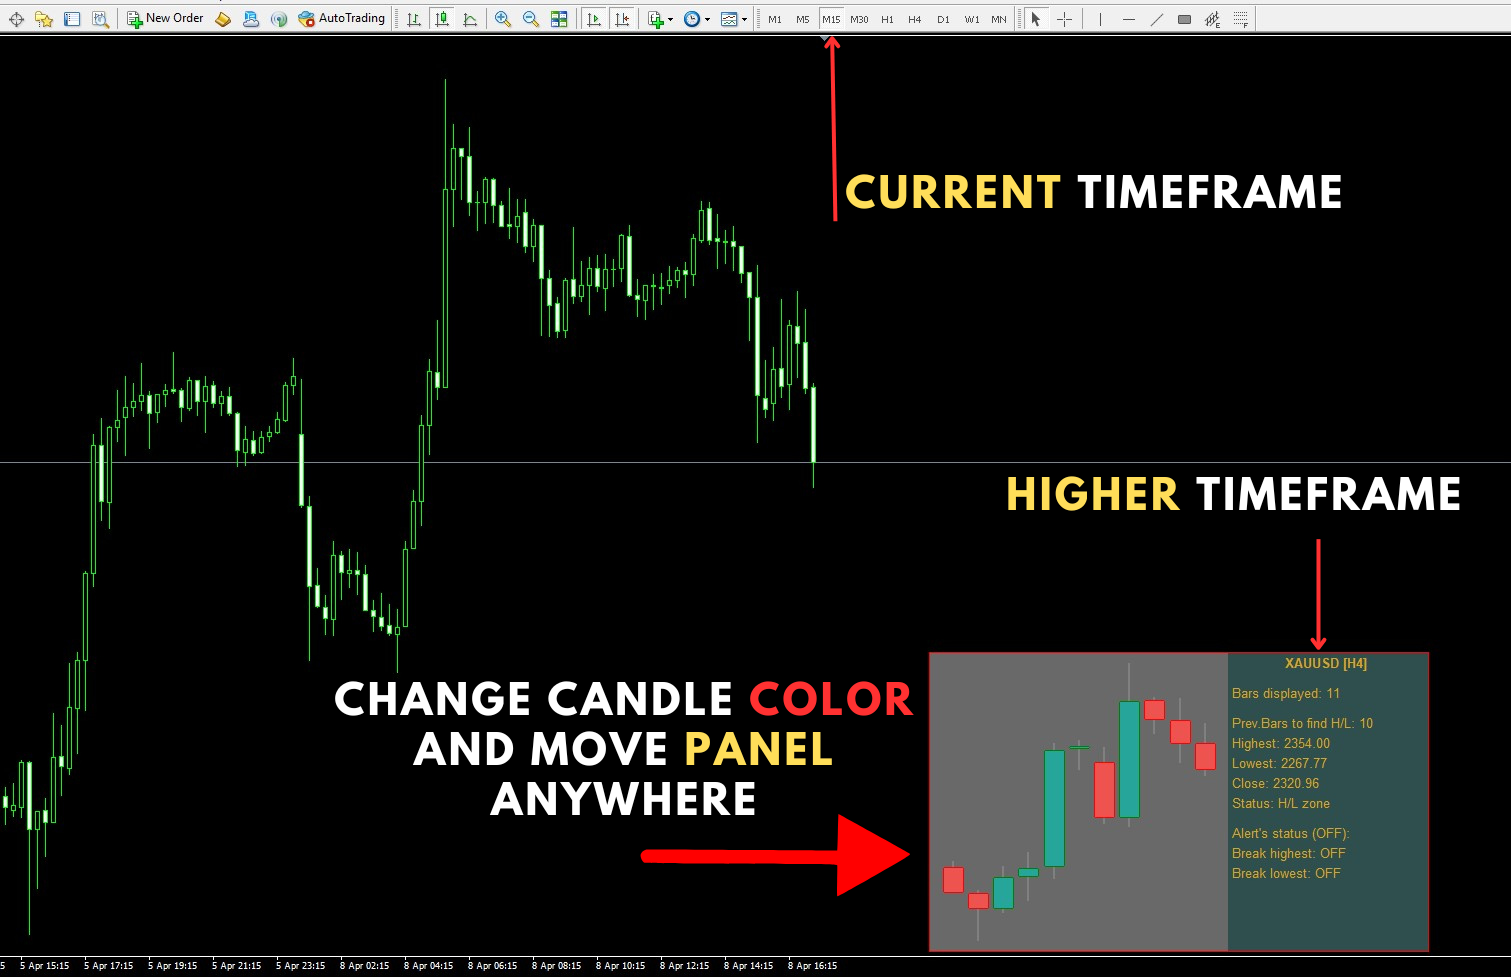
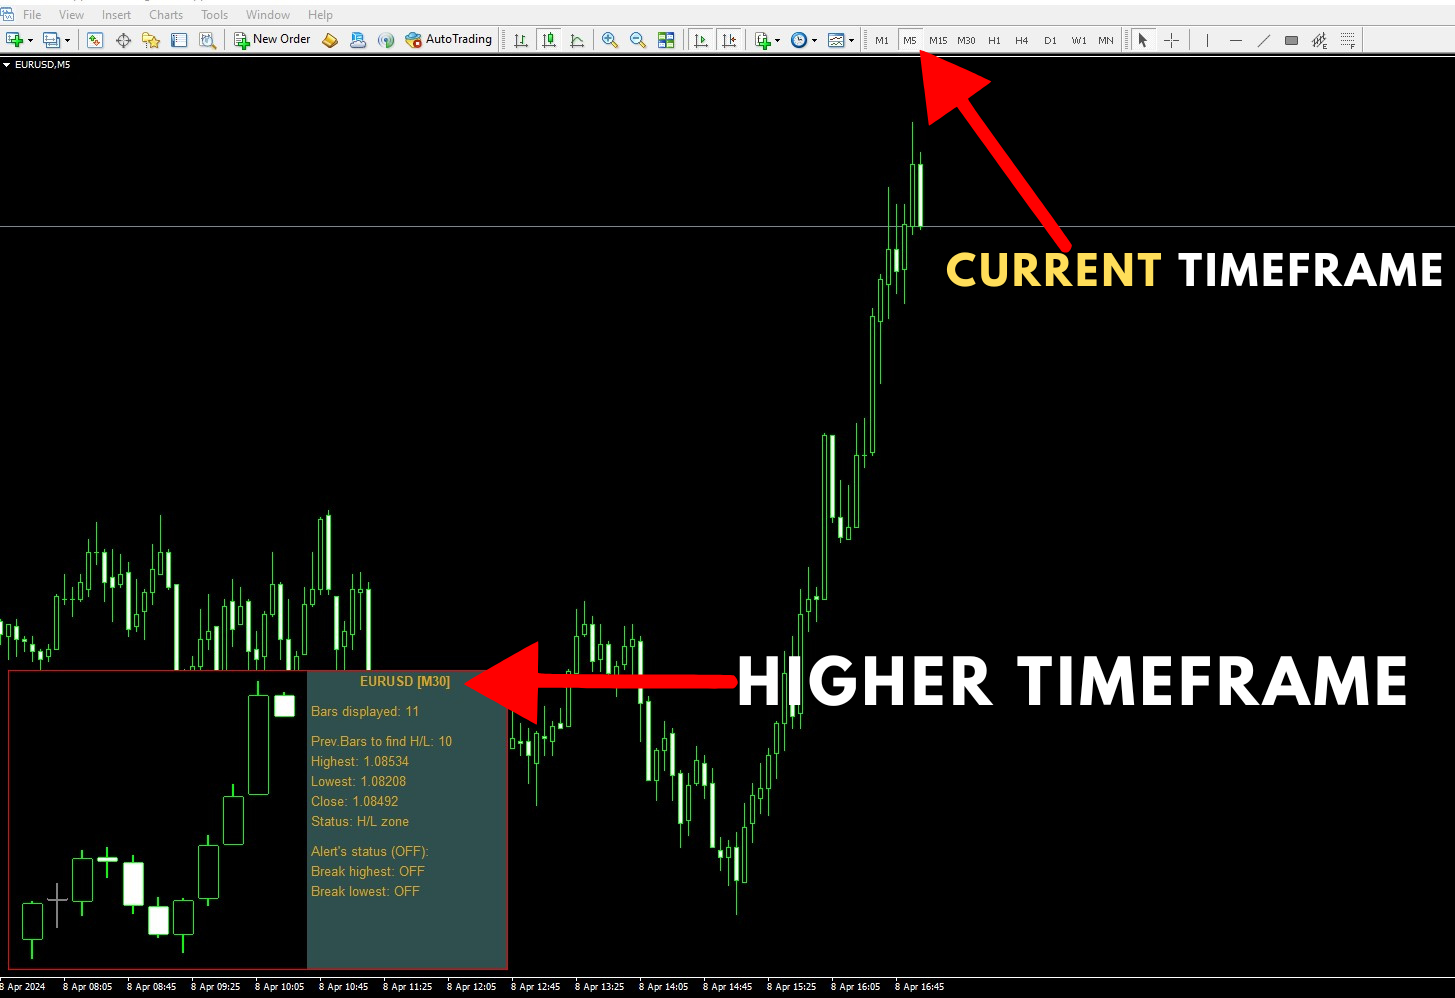
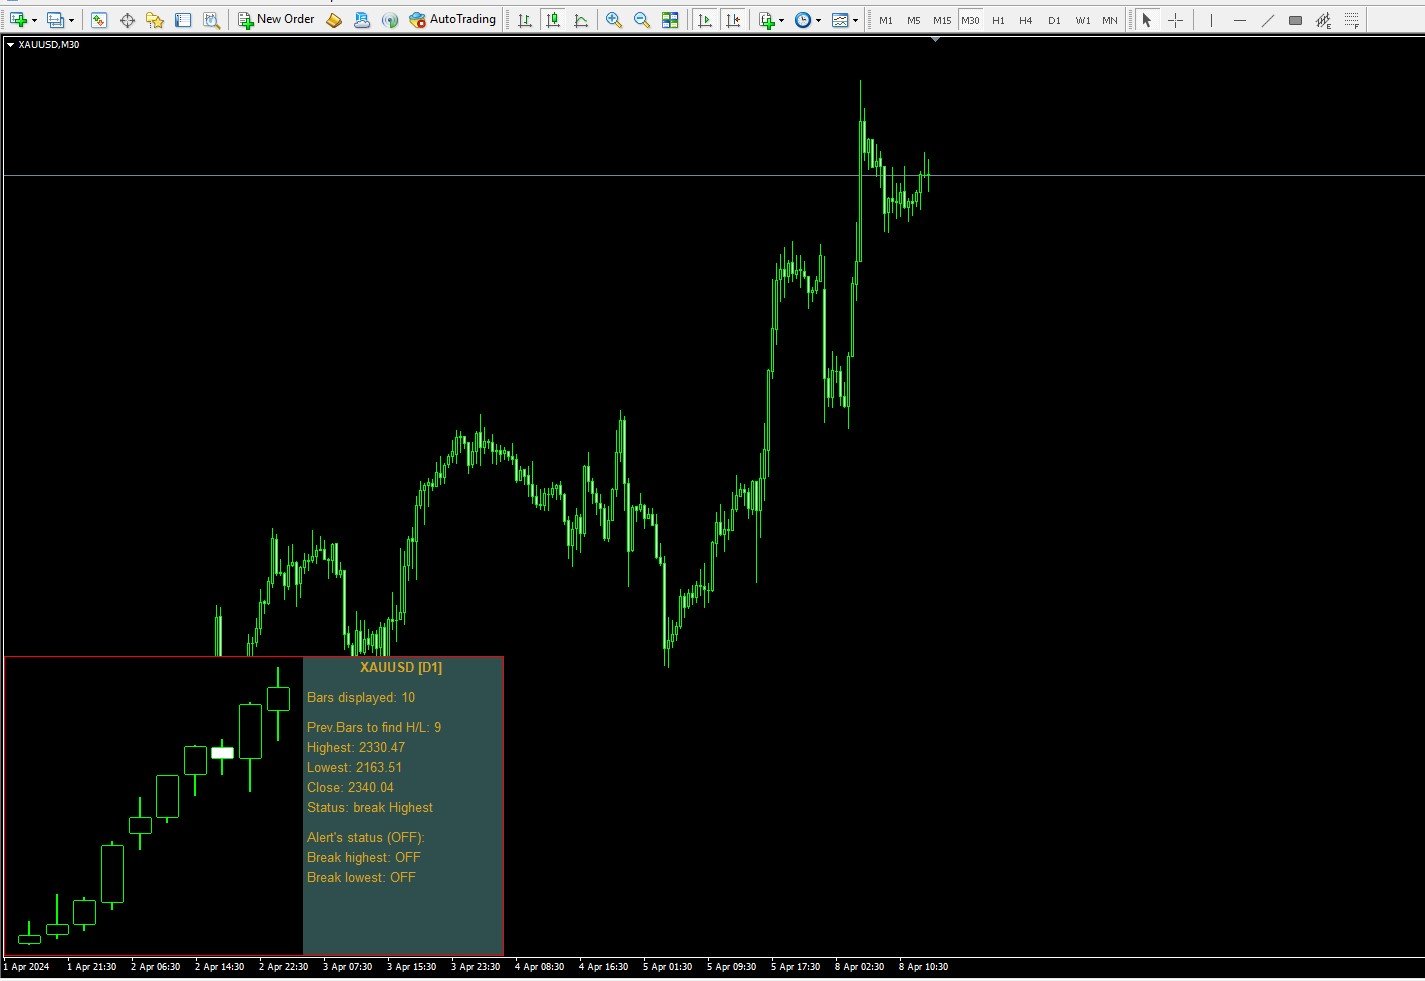
Higher Timeframe Chart Overlay will display higher timeframe candles, including the number of candles high/low you specify.
You no longer need to switch timeframes to check the candles. Everything can be shown in one chart.
MT4 Version : https://www.mql5.com/en/market/product/115680
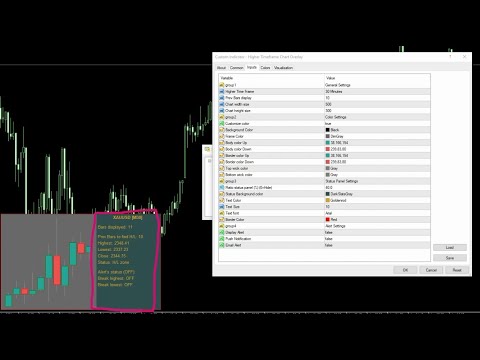
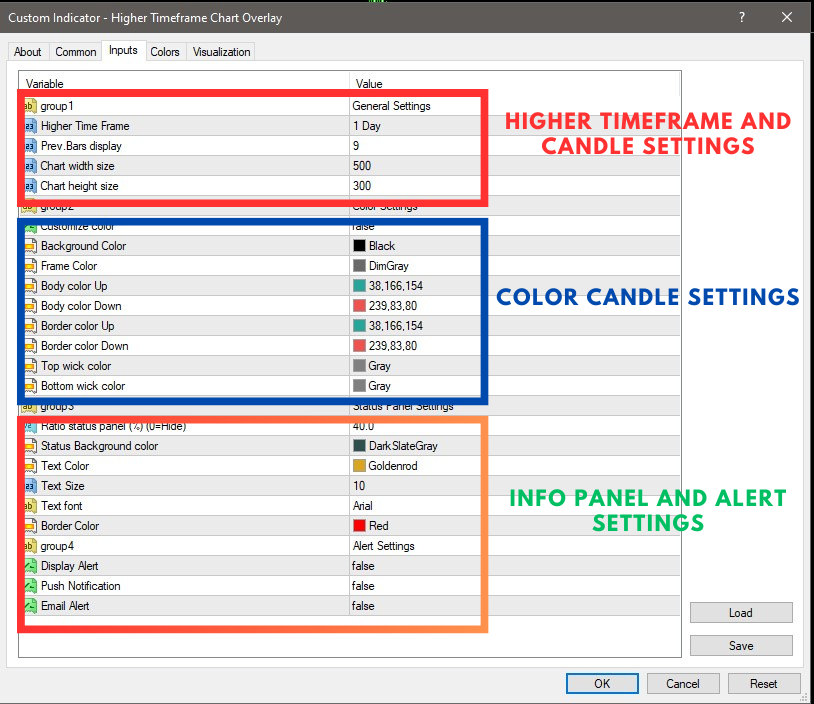
Almost everything can be change as you want. You can change/set:
- Panel's height and width.
- The width of the body and wicks
- Change background and frame colors - Enable/disable the Status Panel (if disabled, only the candle chart is displayed).
- Location of the Status Panel (Drag and Drop)
- Text color and size - Background color of Status Panel.
- Change the color of the panel's border.
Alert settings:
- Display an alert.
- Push Notifications
- Email Alert.