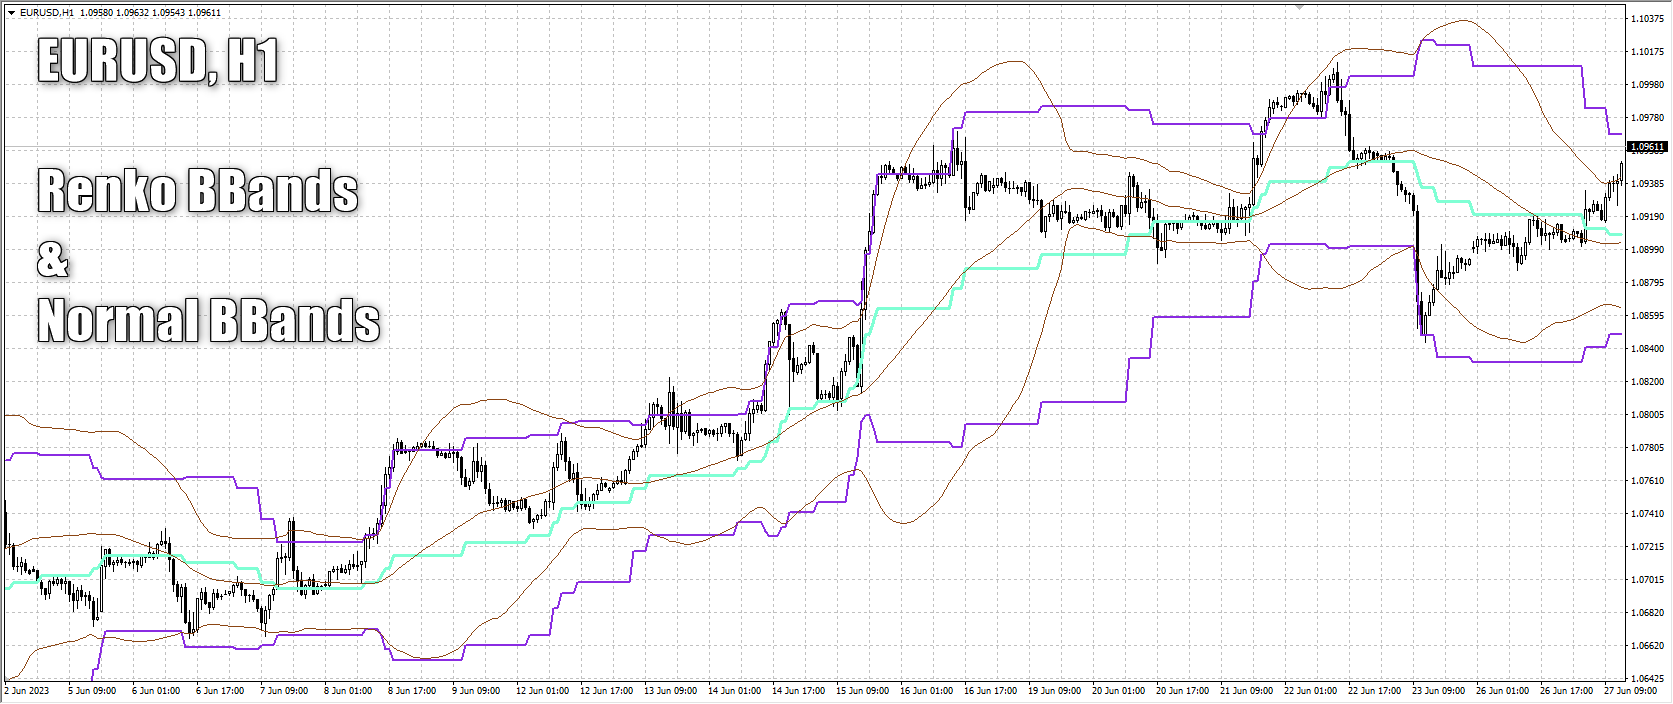
Renko Bollinger Bands
- インディケータ
- バージョン: 1.0
- アクティベーション: 5

Renko Bollinger Bands are Bollinger bands based on Renko boxes. You can see the free enhanced Renko indicator here.
This indicator can be useful to get a better aspect of the price and deviation since it is based on Renko bars. Also the Main line of Bollinger Band is the SMA of Renko bars based on the Period in the inputs.
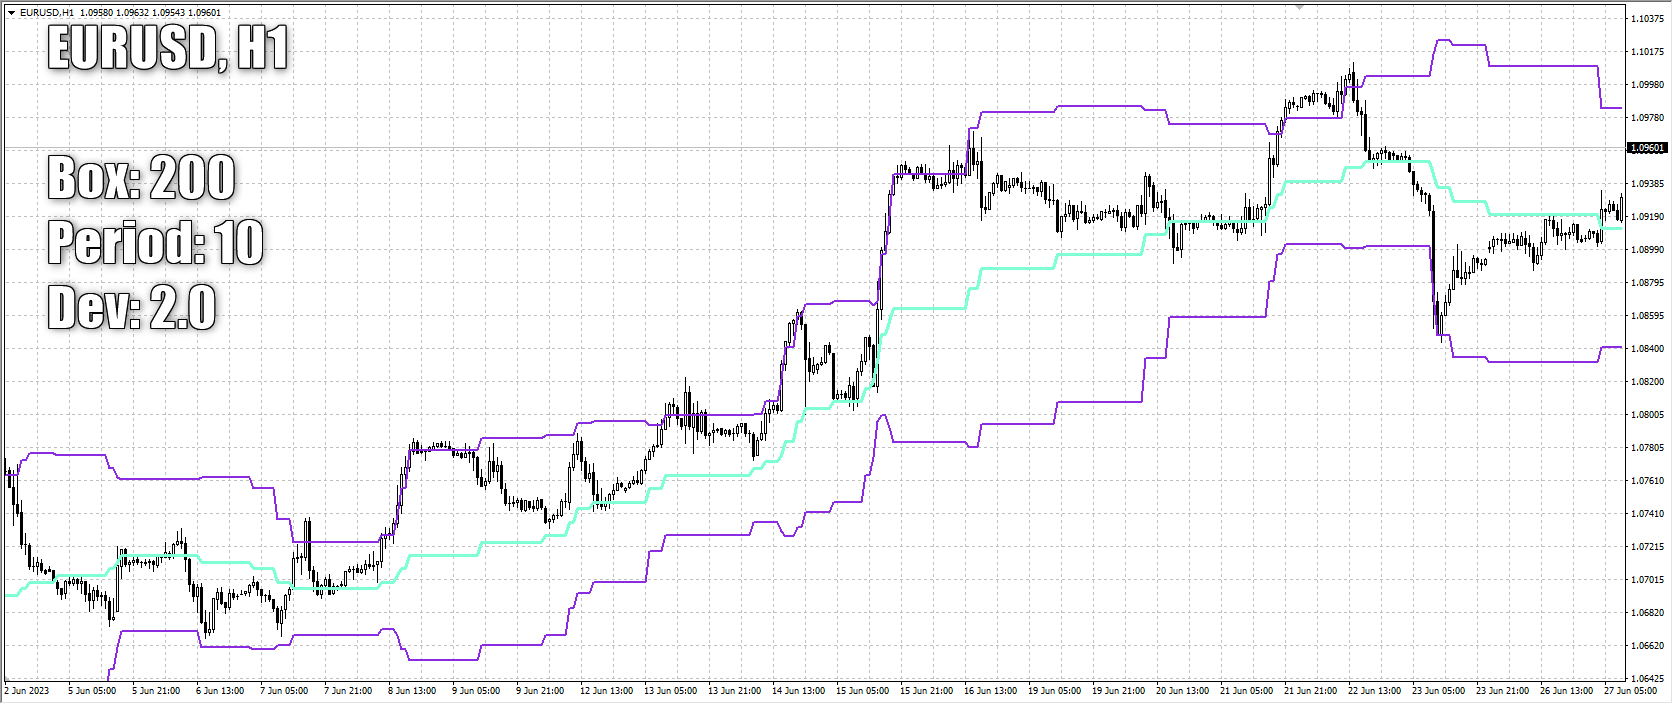
Inputs:
- Box Size: Renko box size based on market Points.
- Period: Bollinger Bands Period
- Deviation: Bollinger Bands Deviation.