 MetaTrader 5
 エキスパート
 インディケータ
 ライブラリ
ライブラリ
 ユーティリティ
 ウィジェット
 ルール
ルール
YouTubeにあるマーケットチュートリアルビデオをご覧ください
ロボットや指標を購入する
仮想ホスティングで
EAを実行
EAを実行
ロボットや指標を購入前にテストする
マーケットで収入を得る
販売のためにプロダクトをプレゼンテーションする方法
MetaTrader 5のためのエキスパートアドバイザーとインディケータ - 142
 自動売買ロボットとインジケータを使用して、外国為替取引の収益性を高めます。 自動売買ロボットを使用すると、取引の開始と終了を自動化でき、インジケータは市場の行動をより正確に予測するのに役立ちます。
このページには、MetaTrader5アプリケーションのカタログが掲載されています。
自動売買ロボットとインジケータを使用して、外国為替取引の収益性を高めます。 自動売買ロボットを使用すると、取引の開始と終了を自動化でき、インジケータは市場の行動をより正確に予測するのに役立ちます。
このページには、MetaTrader5アプリケーションのカタログが掲載されています。 
The Oscar, one of my favorite indicators. This is my enhanced Version of it with more options and better visuals. Many different averaging methods Oscar changes color on signal cross, but not too volatile (3% extra threshold) Adaptable Divisor, higher numbers lead to more signals, due to higher fluctuations. Its a fast but quite accurate trend direction indicator. Play around with the settings and make it match to your setup. GL trading Please follow me on Twitter https://twitter.com/semager and
FREE

SmartTrader Volatility Monitor shows two things that matter before you take a trade: is the spread reasonable right now, and is volatility behaving normally? What it shows Spread - current spread in points, color-coded Good / Elevated / Wide against thresholds you set Volatility - current ATR compared to its recent average, shown as a ratio (e.g. "1.8x") and a state: Low, Normal, or High Why "Low" volatility gets flagged too, not just "High" Most volatility tools only warn about high volatility.
FREE

ProFactor is an indicator generating signals based price on the famous profit factor formula. The calculation is simply defined as gross GREEN BARS divided by gross RED BARS.
That's it in a nutshell, but sometimes the simplest things hold the most value.
So let's imagine your trading system's gross profit for the past year was $40,000 and your gross losses were $20,000. Your Profit Factor would be 2. The ProFactor calculation works on the price of the asset instead of the strategy outco
FREE
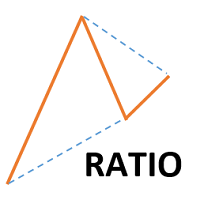
This indicator shows ratios between extremes on the chart. You can specify your own ratios (e.g. Fibonacci).
Parameters Most important Density - how much in details to search ratios in extremes. Bigger number means less details, smaller number means more details. Base unit is 1 bar on the chart. History - how far to go in history while searching. When you set -1, the indicator processes all bars from history. Base unit is 1 bar on the chart. Range - how far search ratios from given extreme. Bas
FREE
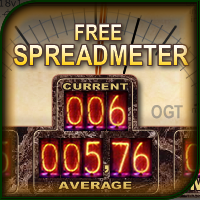
The indicator shows the current spread of the symbol, the minimum, average and maximum values for the current bar in the form of digital, analog and graphic indicators. Has two modes of operation: fixing the system spread, or calculating the spread as the difference between the "Bid" and "Ask" prices on each incoming tick. Parameters The indicator has a single input parameter: Type of calculation - type of spread calculation. It can take the following values: System spread - the spread value
FREE

*** Free Version: Maximum Lot 0.10 ***
CopyCopy: Smart Replication Manager for MT5 CopyCopy is the ultimate tool for those who want to replicate trades with complete autonomy. Many signals and EAs operate with minimum lots (0.01) that do not match your account size or your growth strategy. With CopyCopy, you turn this limitation into an opportunity, taking full control over volume and risk. The difference? You don't have to copy "all or nothing." You decide exactly where the orders come from.
FREE

ST Smooth Trend: Silence the Market Noise Trading doesn't have to be a guessing game. Most traders lose money because they react to every small price wiggle. ST Smooth Trend was built to give you a crystal-clear view of the market by filtering out the chaos. Key Benefits for Your Trading: Intuitive Color System: No more confusion. Green means trend up, Red means trend down, and Gray tells you the market is flat—protecting your capital when there’s no clear direction. Visual Safety Zones: The dot
FREE

Pna Vwap: Professional Multi-Timeframe VWAP Gain a professional edge and trade with institutional clarity. Pna Vwap is a powerful, all-in-one VWAP system Stop guessing the true market trend. Pna Vwap provides a clean, multi-dimensional view of the market by showing the real, volume-weighted average price across three critical timeframes. Understand where the value is, identify who is in control, and make trading decisions with greater confidence. Core Features & Key Advantages This is not a ba
FREE

SignalPulse — MT5 → Telegram — Buy/SellアラートをTelegramグループへ送信 すべての取引を、購読者向けの即時かつプロフェッショナルなTelegramアラートに変換。チャート上に搭載されたワンタップ操作パネルから、取引を直接コントロールできます。 SignalPulseはMT5口座を監視し、Buy、Sell、決済、または建玉をブレークイーブンへ移動した瞬間に、Telegramへリアルタイムで通知します。 さらに、チャート上の操作パネルからBUY、SELL、CLOSE ALL、カスタムメッセージをワンクリックで実行できます。 購読者に表示する通知タイプも自由に選択可能。シグナル配信者が大量の通知でチャンネルを埋めることなく、必要な情報を1つの明確なメッセージとして届けるために設計されています。 トレーダーやシグナル配信者がSignalPulseを選ぶ理由: 同じメッセージをリアルタイム更新。通知スパムを防止。 同一シンボルで短時間に部分決済やSL変更などが発生した場合、新しいメッセージを送るのではなく既存のメッセージを更新します。 決済時の正確な
FREE

局所的なチャートの変動をトリガーにして、ポジションエントリーを行うEAです。 マーチンゲール法やグリッドを使用していません。
エントリートリガー: [level1] 1. 下がった→下がった→現時点で規定の差額より上がって見える = BUYエントリー 2. 上がった→上がった→現時点で規定の差額より下がって見える = SELLエントリー [lebel2] 1. 下がった→下がった→間をおいて上がった→規定の差額より上がった = BUYエントリー 2. 上がった→上がった→間をおいて下がった→規定の差額より下がった = SELLエントリー
たったこれだけのシンプルなものです。 Forex でも CFD でも利用可能です。 XXXJPYで顕著に特徴が表れます。
setfiles.zip: https://www.mql5.com/ja/blogs/post/761084
その他の機能: "trailing stop" - 利益確定範囲でslを設定します。動作ステップは自動です。。 "Support / Resistance Line depth" - Support / Resi
FREE
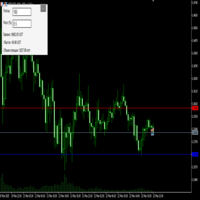
Преимущества и принцип работы индикатора "Risk end Lot Size Calculator" Преимущества : Простота использования :
Индикатор автоматически рассчитывает все необходимые параметры, вам нужно только ввести количество пипсов и риск.
Управление рисками :
Помогает определить, сколько вы можете потерять в сделке, и какой объем позиции (лот) выбрать, чтобы не превысить допустимый риск.
Визуализация :
На графике отображаются линии стоп-лосса для Buy и Sell, что позволяет быстро оценить уровни.
Удобство :
О
FREE

SPECIAL OFFER: FREE FOR A LIMITED PERIOD To celebrate our February 2026 launch, we are offering the Phoenix Trade Planner for FREE to the first 500 users. Download now and secure your lifetime access to the most intuitive planner on the market! Why Phoenix Trade Planner? Most traders fail because they enter trades without knowing their exact £/€/$ risk. The Phoenix Trade Planner changes the game by allowing you to draw your trade on the chart before you commit. 1. Intuitive "Drag-to-Trade
FREE


RSIBandsTREND is a custom trend-focused indicator that enhances the classic RSI approach by visualizing dynamic upper and lower bands based on RSI calculations.
It plots three clean bands (upper, lower, and midline) directly on the chart, helping traders identify overbought and oversold zones with precision. Features: Three-band system: upper, lower, and center RSI lines EMA-smoothed RSI band calculation Clear trend zone visualization on chart Works on all timeframes (M1 to Monthly) Fully opt
FREE

Golden Trader Panel - 究極の取引ダッシュボード ゴールデントレーダーパネルを選ぶ理由 強力な機能: 洗練されたゴールドデザインのプロフェッショナルダッシュボード 一目で分かる総合的な口座概要 1〜10秒ごとの自動更新(カスタマイズ可能) 取引状況を瞬時に認識するスマートカラーコーディング リアルタイム情報表示: 未決済取引数 - すべての有効ポジションを追跡 口座残高 - 基本通貨での現在残高 評価損益 - 自動色分けされたライブP/L 現在の純資産 - ポートフォリオ総価値 通貨ペア愛称 - 金、銀、ビットコインなど 現在価格 - リアルタイム相場価格更新 取引タイプ - 買い/売り/ヘッジのカラー表示 利確ゾーン - 複数のTPレベル表示 損切ゾーン - すべてのSLレベルを一度に表示 P/Lパーセンテージ - 残高に対する損益率 完全なカスタマイズ: 取引スタイルに合わせたパネル色の選択 必要に応じた更新頻度の調整 パネル位置の選択(4箇所利用可能) 読みやすさのためのフォントサイズ変更
FREE

SESSION SUHUTRADE: Master the Market Hours with Precision Are you tired of missing out on high-probability setups during specific trading sessions? Do you struggle to identify when the Asian, London, or New York markets are truly active and presenting the best opportunities? Introducing SESSION SUHUTRADE , the ultimate MQL5 indicator designed to give you unparalleled clarity over the global trading sessions. This powerful tool automatically detects and highlights the exact market hours for Asia,
FREE

Market Time Watch X For Macbook! A clean, lightweight and essential time-tracking tool for every trader Market Time Watch is a professional on-chart time display designed for traders who need an accurate real-time clock and precise candle timing while analyzing the markets. This tool helps you instantly see current local time , server time , and candle countdown directly on your chart without any clutter or heavy UI components. Whether you scalp fast markets, swing-trade sessions, or simply need
FREE

The M Extensions are variations of the Golden Ratio (Fibonacci Sequence). It is the World's first technique developed for Candle Projections.
Advantages:
Easy to plot. Candle anchoring; High and accurate precision as support and resistance; Excellent Risk x Return ratio; Works in any timeframe; Works in any asset / market. The M Extensions are classified into:
M0: Zero point (starting candle) RC: Initial candle control region M1: Extension region 1 M2: Extension region 2 M3: Extension regi
FREE
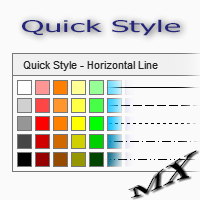
The Quick Style utility is designed for facilitation and acceleration of working with the properties of graphical objects. Left-click a graphical object while holding the Shift key to open the quick access window for configuring the object properties. In the window, you can change the color, style and line width with one click, including those of other graphical objects. All changes are displayed immediately. To close the Quick Style , simply click the free space on the chart. The utility is eas
FREE
DLMACD - Divergence Local (Wave) MACD . The indicator displays divergences by changing the color of the MACD histogram. The indicator is easy to use and configure. It was created as an addition to the previously published DWMACD . For the calculation, a signal line or the values of the standard MACD histogram can be used. You can change the calculation using the UsedLine parameter. It is advisable to use a signal line for calculation if the histogram often changes directions and has small val
FREE

1.mt5跟单软件,支持本地跟单。
2.只需要一个程序,主端输入从端账户,从端输入主端账户
3.品种名称要一致。
4.跟单可正向跟单也可以反向跟单,手数暂时不支持按比例
5.可一对一跟单,一对多跟单没试过
6、喊单和跟单都是同一个EA
7、可以多个跟1个,设置好跟单和喊单的ID。
8、功能齐全,看以下说明,4种跟单手数方案,应该满足各种需要了。
9、跨平台没问题,商品名称有后缀,前缀的,都可以跟单
10、参数设置也做了保存,大家可以加载参考,再根据参数设置的图片说明,不难哈。
无dll 无txt 设计 不需调用动态链接库
币种后缀自适应,无需二次匹配
傻瓜式操作 单项向从控端 仅需填写 主控端账号 就可以 若开启双向平单则 主控填从控账号 从控填主控账号
瓜式操作,MT5本地跟单EA,支持自定义注释 前缀,微秒级别跟单
FREE

This MQL5 indicator creates a customizable grid of horizontal lines on your trading chart. Here's what it does:
**Main Functions:** - Draws equally spaced horizontal lines across the visible price range - Supports two line types: horizontal lines or trend lines with forward projection - Automatically adjusts to price scale changes
**Key Features:** 1. **Customizable Spacing**: Set grid distance in pips (20 pips by default) 2. **Flexible Starting Point**: Auto-calculates starting price or lets
FREE

MetaTrader 5 플랫폼에서 사용되는 사용자 정의 인디케이터로, 다양한 타임프레임에서의 시장 트렌드를 시각적으로 표시하는 데 사용됩니다. 이 인디케이터는 사용자가 지정한 X 및 Y 좌표에 위치하는 패널을 생성하여, M1부터 MN1까지 총 21개의 타임프레임에 대한 트렌드를 각각 라벨 형태로 보여줍니다. 각 타임프레임의 트렌드는 20기간 단순 이동평균(SMA)과 50기간 단순 이동평균을 비교하여 결정되며, 상승 트렌드는 초록색, 하락 트렌드는 빨간색, 보합은 회색으로 표시됩니다. 또한, 모든 타임프레임에서의 트렌드를 종합하여 상승 비율을 계산하고, 이 비율에 따라 전체 시장 트렌드가 표시됩니다. 전체 트렌드는 일정 간격으로 깜빡이며 사용자에게 시각적 주의를 끌도록 설계되었습니다. 이 인디케이터는 시장 상황을 빠르게 파악하고자 하는 트레이더들에게 유용하며, 업데이트 간격과 깜빡임 간격은 사용자의 필요에 맞게 조정할 수 있습니다. 또한, 패널의 위치와 색상도 사용자 정의가 가능하
FREE

Introducing the "Cybercycle Trend" Forex Oscillator, a powerful technical indicator designed to enhance your trading experience in the foreign exchange market. This innovative tool utilizes advanced algorithms to identify and analyze market trends, providing you with valuable insights and helping you make informed trading decisions.
The Cybercycle Trend Forex Oscillator is specifically designed to detect and measure cyclical price movements in the forex market. By incorporating this oscillator
FREE
FractalEfficiencyIndicator A ratio between 0 and 1 with the higher values representing a more efficient or trending market, It is used in the calculation of Perry J. Kaufman Adaptive Moving Average (KAMA), dividing the price change over a period by the absolute sum of the price movements that occurred to achieve that change. The Fractal Efficiency or also known as Efficiency Ratio was first published by Perry J. Kaufman in his book ‘Smarter Trading‘. This is mostly considered a filter for v
FREE

Expansion Limits
Expansion Limits is a powerful multi-timeframe indicator that automatically draws dynamic support, resistance, and expansion levels based on higher timeframe price action.
How It Works The indicator takes the high and low from a selected higher timeframe (default H4) and calculates 11 strategic levels:
HTF High – The high price from the higher timeframe
HTF Median – The exact midpoint between high and low
HTF Low – The low price from the higher timeframe
4 Upper Expansio
FREE

Get the best out of your forex trading experience with our Superb Trend indicator! Our revolutionary technology helps you make smarter and more successful trades, no matter your skill level. With a simple and intuitive interface, you'll be able to analyze trends and make wiser decisions in no time. Stop gambling with your money; start leveraging our Superb Trend Indicator to outperform the market!
Trend Signals: Bullish trend will show as Green line. Bearish trend will show as Red line.
Supe
FREE
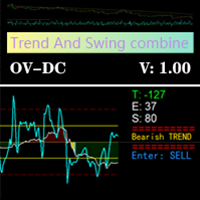
Based on the trend-following principle of CCI, it has been improved to become an indicator that can identify the reversal of the trend and its development direction, that is, it can identify the top and bottom attenuation of the oscillating trend in the trend market. feature The red and green columns represent the trend of bullish or bearish development under the current cycle. The blue line shows the position and attenuation of the current price trend in the current cycle. The upper and lower
FREE

The DFG Chart Indicator displays the historical DFG levels used in the DFG dashboard. These levels are generated dynamically using moving averages and Fibonacci ratios. The Fibonacci Bands automatically adjust to reflect changes in the price range and trend direction. The indicator also features buttons for selecting chart symbol and timeframe, along with a wide range of customization options. Key Features Dynamic DFG Levels
Automatically calculated using moving averages and Fibonacci ratios. H
FREE

The “Summary Risk Target” indicator is designed to show the total number of transactions made on a single pair. The transactions counted include active positions as well as pending orders . By setting a stop loss for each trade, this indicator displays the total potential risk (loss) that may be incurred. This helps traders easily understand their overall risk exposure without the need for manual calculations. Likewise, for take profit , if the TP level is defined—either in terms of pips or at a
FREE
マルチタイムフレーム対応、カスタマイズ可能なビジュアルシグナル、設定可能なアラートシステムを備えたForce Indexインジケーター。
フリーランスのプログラミングサービス、アップデート、その他のTrueTL製品は MQL5プロフィール でご利用いただけます。
フィードバックとレビューを大変感謝いたします!
Force Indexとは? Force IndexはAlexander Elderによって開発され、価格の方向性、価格変動の大きさ、出来高を組み合わせて価格動向の背後にある力を測定します。今日と昨日の終値の差に、その期間の出来高を掛け合わせ、移動平均スムージングを適用することで計算されます。 正のForce Index値は買い圧力(強気派が優勢)を、負の値は売り圧力(弱気派が優勢)を示します。短期のForce Indexはトレンド内の調整での参入ポイントの特定に使用し、長期のものは主要な転換点を特定します。ゼロラインのクロスはトレンド方向の変化を確認します。 機能: 出来高統合モメンタム計算 スムージング用の設定可能なMAメソッド(SMA、EMA、SMMA、LWMA) 矢
FREE

これは、リアルタイムバイナンス先物ティックデータとリアルタイムバイナンススポットティックデータを処理するためのユーティリティです。 データをより高速にプルし、BinanceFutureの境界内にとどまるように設計されています。
動作ロジック:グローバル変数は、Binance Check ServerTimeから受信した時間情報を記録します。
他のプログラムでは、この時間情報を使用して、より速く、より効率的に作業を行います。
[ツール]メニュー>> [オプション] >> [エキスパートアドバイザー]からWebRequestを許可し、URLを追加する必要があります:https://api.binance.com 設置時や販売後に問題が発生した場合は、お気軽にお問い合わせください。
FREE

SCALPING GOLD DIGGER EA Intelligent Gold Trading Robot for XAUUSD
Free Demo Version = https://c.mql5.com/6/1028/GoldDigger_DEMO.zip
Trade Gold with Confidence SCALPING GOLD DIGGER EA is an advanced Expert Advisor designed exclusively for XAUUSD (Gold) traders. Combining intelligent market analysis with adaptive trade management, it automatically identifies high-quality trading opportunities while maintaining strict risk control. Built for both beginners and experienced traders, SCALPING GOLD

It's demo version of Auto StopLoss Defender , you can buy on page - https://www.mql5.com/ru/market/product/33106 or extended version of the program is Auto StopLoss Premium , you can set stoploss and takeprofit - https://www.mql5.com/ru/market/product/33111
Demo restrictions: Stop-loss 0.10% for new order.
While you are trading, Auto StopLoss Defender doing all the routine work. "Must have" for scalping. Best way to save account balance in case of force majeure.(Internet connection loss
FREE
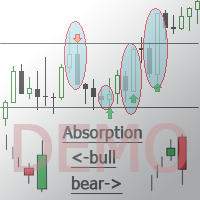
This is a demo version of the Candle Absorption Full indicator. It has limitations on operation. This indicator detects the Engulfing candlestick pattern and draws the corresponding market entry signal.
Features It works only with EURUSD on timeframes M1 and M5. The indicator analyzes a combination of 2 or 3 candlesticks depending on settings. The number of pre-calculated bars (signals) is configurable. The indicator can send an alert to notify of a found signal. Signal can be filtered by setti
FREE

RiskLock MT5 — Professional Drawdown Protection & Emergency Account Lock System RiskLock MT5 is a professional risk management utility designed to protect trading accounts from excessive drawdown and catastrophic loss events.
Main Features Drawdown Percentage Protection
Fixed Monetary Loss Protection
Emergency Account Lockdown
Automatic Position Liquidation
Pending Order Deletion
Optional Close-All-Charts Protection
Real-Time Color Dashboard
Emergency Global Variable Lock
Mult
FREE

Smart Exit Manager - FREE Version Demo Account Only - Test all features before upgrading to Smart Exit Manager PRO for live trading.
Overview Smart Exit Manager automatically calculates the exact price level where closing all your positions will achieve your target profit. The target line updates in real-time as you open or close trades, accounting for broker commissions and providing a precise exit point visible on your chart. Perfect for traders managing multiple positions with different lot
FREE

Quantum Simulator – Discover the Power of Quantum Dynamic Risk Quantum Simulator is an Expert Advisor designed to demonstrate the effectiveness of the Quantum function, fully integrated into the RiskGuard Management system. Through a simple interface, you can simulate an equity curve starting from a fixed balance of €100,000 , using your own custom statistics: Win Rate (%) Average Risk/Reward Ratio Number of Trades Maximum Allowed Drawdown (Optional) Minimum Accepted Drawdown The EA performs a
FREE

Time Indicator for MT5 Simple and powerful time-based signal indicator for MetaTrader 5. Time Indicator draws clean circle signals directly on the chart at your selected times:
00 / 15 / 30 / 45 minutes. Perfect for traders who use:
️ session timing
️ volatility timing
️ scalping entries
️ market opens
️ news preparation
️ manual or automated trading Main Features Fixed Time Signals Signal every: 00 minutes 15 minutes 30 minutes 45 minutes Enable or disable eac
FREE

STAMINA HUD – Advanced Market & Trend Dashboard (MT5) STAMINA HUD is a professional market information panel designed for traders who want clarity, speed, and control directly on the chart. It provides a clean heads-up display (HUD) with essential market data and multi-timeframe trend direction , without cluttering the chart or generating trading signals.
What STAMINA HUD Shows Current Price
Spread (in real pips)
Today High–Low range (pips)
Average D
FREE

This indicator is a trading strategy designed to find high-probability entry points by combining two very popular indicators: Bollinger Bands (BB) and the Relative Strength Index (RSI) . The core idea is "dual confirmation" : a trade signal is only considered valid when both indicators agree. This helps filter out many of the false signals that occur when using just a single indicator, thereby increasing the reliability of each entry. Bollinger Bands are used to identify relative price value zon
FREE
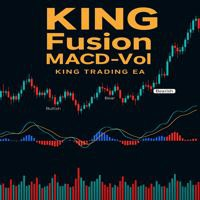
- وصف المنتج - مؤشر احترافي متكامل
لا يعد KING Fusion MACD-Vol من KING TRADING EA مجرد MACD آخر — فهو عبارة عن مجموعة أدوات تداول كاملة تجمع بين مؤشرات احترافية متعددة في نافذة فرعية واحدة أنيقة. لم تعد بحاجة إلى تحميل مخططك بأدوات منفصلة. يجمع هذا المؤشر بين:
MACD مع خطوط مزدوجة ورسم بياني مكبر
رسم بياني ملون ومثبت بالحجم
ملصقات ديناميكية مع قيم المؤشرات في الوقت الفعلي (ATR، ADX، RSI، Volume)
عداد تنازلي للبار
التنبيهات المتقاطعة (مرئية + صوتية)
كل ما تحتاجه من الوضوح والسرعة والدقة -
FREE

This indicator, often referred to as an Auto-Fibonacci Retracement Tool, is a technical analysis script designed to identify potential support and resistance levels based on the "Golden Ratio." Unlike the standard manual tool, this version automatically scans a specific lookback period (e.g., the last 100 candles) to find the absolute Swing High and Swing Low, drawing the levels for you in real-time. How to Use it for Trading 1. Entering a BUY Trade (Long) You use the Fibonacci levels to find "
FREE

OrderCalc opens a window in the chart with the data of your orders:
Position size, stop loss, take profit, profit/loss
Only the positions for this symbol are displayed. If several positions exist, these are totalled and displayed in the last line. If you work with pyramids, you can see at a glance how big the total profit or loss is.
M can be used to display information about the symbol: Margin, spread, minimum order size, increment etc. R opens the risk calculator. A click in the chart calc
FREE

The Co-Pilot is a simple trade management system designed to be the quickest way from your strategy to the market. It is optimized for single trade setups that might be short, medium or long term. The program allows you to set your trade setup directly from the chart using graphical objects, set your risk apetite and even provides oppurtunity for partial closes. It also has a built in alert system that keeps you informed on the actions taken by the copilot when youre offline.
It is designed to b
FREE
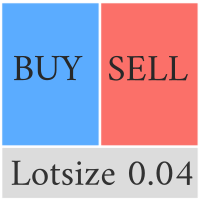
Compliement your normal MT5 Buy/Sell panel with this automatic lot size panel. This product is free without any limitations. There will be a pro verision later with additional functionality, but my motto is to always have awesome free products. It automatically places the stop and sizes the lot according to the given ATR for risk. You have to try it to experience it!
Now I can't trade manually without it.
It's turned out to be much more intuitive than I would think before creating it.
There's
FREE

Description L'indicateur Bid/Ask Spread Signal est un outil avancé conçu pour les traders utilisant MetaTrader 5 (MT5) qui souhaitent surveiller et réagir efficacement aux variations du spread Bid/Ask. Il offre une visualisation claire du spread actuel, de sa moyenne mobile, et des niveaux d'alerte personnalisables, permettant ainsi une meilleure prise de décision et une gestion des risques optimisée.
Caractéristiques Principales • Visualisation du Spread en Temps Réel : Affiche le spread Bid
FREE

PositionRelay TV Slave Subscriber は PositionRelay クラウドの TradingView ウェブフックシグナルを MetaTrader 5 のフォロワー口座にミラーします。仮想 TradingView ソース口座(MT5 マスターではない)をポーリングし、TV_ チケットコメント付きで建玉、決済、変更アクションをコピーします。
関連製品:MT5 マスター→スレーブのコピートレード用 PositionRelay Master Publisher と PositionRelay Slave Subscriber。製品ラインごとに専用スレーブ EA を使用 — 同一スレーブでマスターと TV ソースを同時に実行しないでください。
要件: - TV Sync 付きの有効な PositionRelay サブスクリプション(TV Sync プラン、または TV Sync を含む Pro/Ultimate) - 2FA 有効でウェブフックアラートを設定した TradingView Plus+(positionrelay.com の TradingVi
FREE

PositionRelay Slave Subscriber は PositionRelay マスター口座のオープンポジションを読み取り、ローカルの MetaTrader 5 ターミナルにミラーします。固定・スケール・残高適応ロット、シンボル単位の制御、ダッシュボード表示のための定期セルフレポートに対応します。
関連製品:PositionRelay Master Publisher(無料)。スレーブがポジションをミラーする前に、マスター口座で同じ User ID の PositionRelay Master Publisher を実行する必要があります。
要件: - プランに利用可能なスレーブ枠がある有効な PositionRelay クラウドサブスクリプション(positionrelay.com で登録) - positionrelay.com ダッシュボードの PositionRelay User ID - マスター口座で動作中の PositionRelay Master Publisher - スレーブターミナルごとに一意の InpAccountLabel
セットアップ:
FREE

FOREX17 MOUSE TRADING ASSISTANT BASIC (F17MTA)
- Forex17 Mouse Trading Assistant Basic(F17MTA)は、マウスとキーボードを使用してチャート上から手動で注文を行うためのビジュアルツールです - エントリー、ストップロス、テイクプロフィットを動的に設定・表示できます - Basicは簡易版であり、F17MTAエコシステムの入門バージョンです
====================== 重要なお知らせ ======================
- これは無料のBasicバージョンです
- Standardバージョンは英語で提供されており、マルチターゲットなどの高度な機能が含まれます
- 詳細については英語版の説明をご確認ください
- MetaTrader 5でAutoTradingを有効にする必要があります
====================== 主な機能 ======================
- Bキーを押し続けてBuyモード - Sキーを押し続けてSellモ
FREE

TRADE PANEL MASTER — Know Your Risk Before You Click
Open your chart. See your panel. Trade with confidence.
Before you click Buy or Sell, Trade Panel Master shows you exactly what you risk, what you gain, and your R:R ratio — in real time. No mental math. No surprises.
FEATURES
- Lot sizing with real-time margin display - SL & TP in 3 modes: Points / Money / Price - Au
FREE
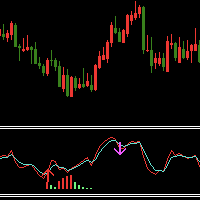
Indicator introduction: The indicator draws wave lines and histograms, It has small price lag, and the signal will not drift. The indicator can send emails, alerts and notifications to you when previous k line has an up arrow and it is under the histogram sections or it has a down arrow. you can choose whether or not to send the two kind of alerts, the alerts repetition times can also be changed. If the indicator appears red and green histograms, this is a buy zone. It can be used to analyze mar
FREE

Stop guessing your performance. Track your wins and losses instantly, directly on your charts! As traders, keeping an accurate, real-time pulse on our psychological and execution performance is key to staying disciplined. DaBhoza Win Rate Tracker is a lightweight, intuitive, and highly visible on-chart utility designed to help you log and monitor your trade outcomes manually with a single click. Whether you are testing a new manual strategy, practicing on a demo account, or keeping track of your
FREE

トレーダーなら誰もが知っているお決まりの手順があります。インジケーターの設定を開き、数字を変え、OK を押し、チャートを目を細めて眺め、違うと判断して、また設定を開く。Relative Vigor Index で設定する数字は期間ひとつだけですが、自分の銘柄で 10 と 14 を比べたくなるたびに、その一度のダイアログ往復が「変えては睨む」サイクルを毎回強いてきます。RVI Live Tuner はそれを終わらせます。 これは チャート上でリアルタイムに 調整できる、古典的な 2 ライン構成の RVI(RVI とその Signal)です。チャート上には期間スライダー付きの小さなパネルが表示されます。ドラッグすれば、見ているその場で 2 本のラインが即座に再計算・再描画されます。「10 か 14 か」の疑問は、フォーラムのスレッドではなく自分のチャート上で数秒で解決します。 ラッパーではない、本物の RVI。 本インジケーターは教科書どおりの計算を自前で実装しています。4 本のバーに対称加重をかけた close-to-open の値動きと high-to-low のレンジを、それぞれ期間
FREE

どのトレーダーにも覚えのある手順があります。インジケーターの設定を開き、数値を変え、OK を押し、チャートを目を細めて眺め、違うと判断して、また設定を開く。Money Flow Index に設定する数値は期間ひとつだけですが、自分の銘柄で 14 と、より短い/長い設定を比べたいと思うたびに、その一度のダイアログ往復が同じ「変えては眺める」サイクルを強います。MFI Live Tuner はそれを終わらせます。 これは チャート上でそのまま、リアルタイムに 調整できる Money Flow Index です。チャート上に期間用のスライダーを備えた小さなパネルが表示されます。スライダーをドラッグすると、固定の 20/80 レベルに対してラインが即座に再計算・再描画され、その様子をそのまま目で追えます。「14 か、自分の数値か」という問いは、フォーラムのスレッドではなく、自分のチャートで数秒のうちに答えが出ます。 本物の MFI であって、ラッパーではありません。 本インジケーターは教科書どおりの計算を自前で実装しています。典型価格(high・low・close の平均)にティックボリュー
FREE

トレーダーなら誰もが知っているお決まりの作業があります。インジケーターの設定を開き、数値を変え、OKを押し、チャートをじっと見て、違うと判断し、また設定を開く。WPR Live Tuner はその繰り返しを終わらせます。 これは チャート上でリアルタイムに調整できる Williams %R です。チャート上の小さなパネルに、%R の期間と2本のレベルを動かすスライダーが並んでいます。スライダーを動かせば、見ているその場でインジケーターが即座に再計算・再描画されます。納得のいく形になれば、それで完了です。ダイアログもOKボタンも必要ありません。 MA シグナルラインはオプション。 %R の移動平均をパネルから直接オン・オフでき、その計算方法(SMA、EMA、SMMA、LWMA)もボタン1つで切り替えられます。4種類の方法をそれぞれ1クリックで試せて、変更はその瞬間にチャートへ反映されます。EMA(5) と SMMA(9) のどちらが自分の %R をうまく平滑化するかを確かめるのに、設定ダイアログを4往復する必要はなく、数秒で済みます。 スタイルエディタもリアルタイム。 %R ライン、MA
FREE

Position Closer is advisor used to close all orders when the profit will cross specified value either above or below. You can close all orders with one button click.
On panel on chart you have options: Deactivate after close - If Deactivate after close is checked the advisor will disable Close above profit and Close below profit options after orders are closed either on crossing the profit or on hitting the CLOSE ALL button. Close above profit - If Close above profit is checked, the advisor wil
FREE
This indicator displays the spread with extra options Simple and easy to use and fully customisable: View as Pips or Pipettes Chart symbol can be hidden Text display can be changed Change colour and text styles Add or hide a decimal point Spacing options between inputs Default screen positions Screen position inputs
Pro version includes: Drag and drop box on the screen Add an alert when the spread is too high Alert colours for text and text box changeable
How to use 1. Simply use the default
FREE

FirstBlade Performance Analyzer is a non-trading MT5 utility. It is NOT a trading robot. It does not open, modify or close trades.
This product is a non-trading MT5 utility designed to analyze account trading performance using historical and current account data directly inside MetaTrader 5. Overview FirstBlade Performance Analyzer provides professional-grade performance analytics and visual diagnostics for MT5 accounts.
It helps traders understand profitability, drawdown behavior, timing effi
FREE
Triple Exponential Moving Average (TRIX) It is a strong technical analysis tool. It can help investors determine price momentum and identify oversold and overbought signals in a financial asset.
Advantages of having an indicator like TRIX.
One of the main advantages of TRIX over other trend-following indicators is its excellent filtering of market noise and its tendency to be an early rather than late indicator.
To aid in the operations, a coloring was configured to facilitate the identifica
FREE

Faster execution, clearer order control, and better trading discipline. OCT Panel — Professional MT5 Trading Control Panel OCT Panel is built for traders who want faster execution, clearer order control, and better trading discipline. OCT Panel is a professional trading assistant panel designed for MetaTrader 5 .
It helps traders manage orders, positions, Stop Loss, Take Profit, pending orders, and trade execution more efficiently during manual trading. OCT is not a signal system and does not g
FREE

The Volume Heatmap indicator visually shows the INTENSITY of the volume taking into account the concept of standard deviation. Purpose of the Indicator: High volumes are common where there is a strong consensus that prices will increase. An increase in volume often occurs at the beginning of a new upward trend in the price of an asset. Some technical analysts do not rely on trend confirmations without a significant increase in volume. Low volumes usually occur when an asset is heading for a down
FREE

Order Book, known also as Market Book, market depth, Level 2, - is a dynamically updated table with current volumes of orders to buy and to sell specific financial instument at price levels near Bid and Ask. MetaTrader 5 provides the means for receiving market book from your broker in real time. The expert OrderBook Recorder records market book changes and stores them in local files for further usage in indicators and expert adviser, including testing in the tester. The expert stores market book
FREE

You can send MetaTrader screenshot easily to your identified telegram channel via press the send button that on the chart. TelegramBotToken: Telegram API credentials. You can create API credentials on my.telegram.org web page ChatId: Your telegram chatId. Secreenshots will be sending this channel - Please do not press the button repeatedly. This may cause your bot or ip address to be blocked. - You have to add telegram api address ( https://api.telegram.org ) in Option > Expert Advisors > Allow
FREE
Trendline Toolbox (MT5) Trendline Toolbox is a utility indicator for MetaTrader 5 that helps manage trendlines and common chart objects. It is a charting tool; it does not provide trading signals and does not guarantee any profit. Main functions Clone the selected trendline (keeps style, angle, and price levels). Toggle the Extend/Ray property for the selected trendline. Delete the selected trendline. Purge all objects on the current chart. Draggable panel: double-click the hand icon and drag t
FREE

Trade Details Tracker is a lightweight yet powerful chart-panel designed to give traders instant visibility into their open positions. Instead of checking multiple terminal tabs, this indicator displays real-time trade statistics directly on the chart , helping you manage risk, monitor exposure, and make faster decisions. Key Features Real-Time Trade Overview
Instantly view Buy & Sell trade counts for the active symbol. Automatic Breakeven Calculation
Volume-weighted breakeven
FREE
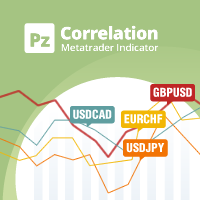
In the world of finance, correlation is a statistical measure of how two securities move in relation to each other. Correlations are used in advanced portfolio management. This indicator measures how different securities move in relation to a reference one, thus making portfolio management easier. [ Installation Guide | Update Guide | Troubleshooting | FAQ | All Products | Get Help ] Avoid concurrent trades in highly correlated instruments Find trading opportunities among highly correlated
FREE

TideMarks Basic — Session Highs & Lows (NY, London, Tokyo) This is the free version of TideMarks. It displays today's session highs and lows for Tokyo, London and New York with no configuration required — just add it to your chart and it works. The full version adds: On-chart toggle buttons per session Open-Close range lines Session candle coloring with directional tick marks Two fully customisable extra sessions Extend lines as live support and resistance Full alert suite (8 alert types) Config
FREE

XFlow shows an expanding price channel that helps determine the trend and the moments of its reversal. It is also used when accompanying transactions to set take profit/stop loss and averages. It has practically no parameters and is very easy to use - just specify an important moment in the history for you and the indicator will calculate the price channel. This is a demo version limited to CHF currency pairs. Designed to familiarize you with the interactive use of XFlow DISPLAYED LINES ROTATE
FREE

TRI Visualizer Enhanced - 熱力学的市場分析の革命 概要 TRI(Thermal Range Indicator)Visualizer Enhanced は、従来のテクニカル分析を超越した、物理学の熱力学理論を応用した革新的なマーケット分析インジケーターです。市場の価格変動を「熱力学的エネルギー」として捉え、これまで見落とされていた市場の微細な変化を高精度で検出します。 革新的な仕組み 1. デュアル計算エンジン クラシックTRIモード 基本公式: |終値-始値| + (高値-安値) ローソク足の実体とヒゲを統合した純粋なボラティリティ測定 シンプルで直感的、あらゆる市場環境で安定動作 熱力学的TRIモード(独自開発) 価格加速度 :2次微分による価格変化の勢いを測定 出来高変化率 :相対的な出来高の変化を動的に評価 ポジションエネルギー :正規化された価格変動エネルギーを計算 熱力学的係数 :物理学の熱力学法則を市場分析に応用 2. 高度な平滑化システム SMA(単純移動平均) :基本的なノイズ除去 EMA(指数移動平均) :最新データ重視の平滑化
MetaTraderマーケットはMetaTraderプラットフォームのためのアプリを購入するための便利で安全な場所を提供します。エキスパートアドバイザーとインディケータをストラテジーテスターの中でテストするためにターミナルから無料のデモバージョンをダウンロードしてください。
パフォーマンスをモニターするためにいろいろなモードでアプリをテストし、MQL5.community支払いシステムを使ってお望みのプロダクトの支払いをしてください。

取引の機会を逃しています。
- 無料取引アプリ
- 8千を超えるシグナルをコピー
- 金融ニュースで金融マーケットを探索