ProbabilityLimitStop
- インディケータ
- バージョン: 3.0
- アップデート済み: 3 11月 2025

Powerful Price Discovery
Features
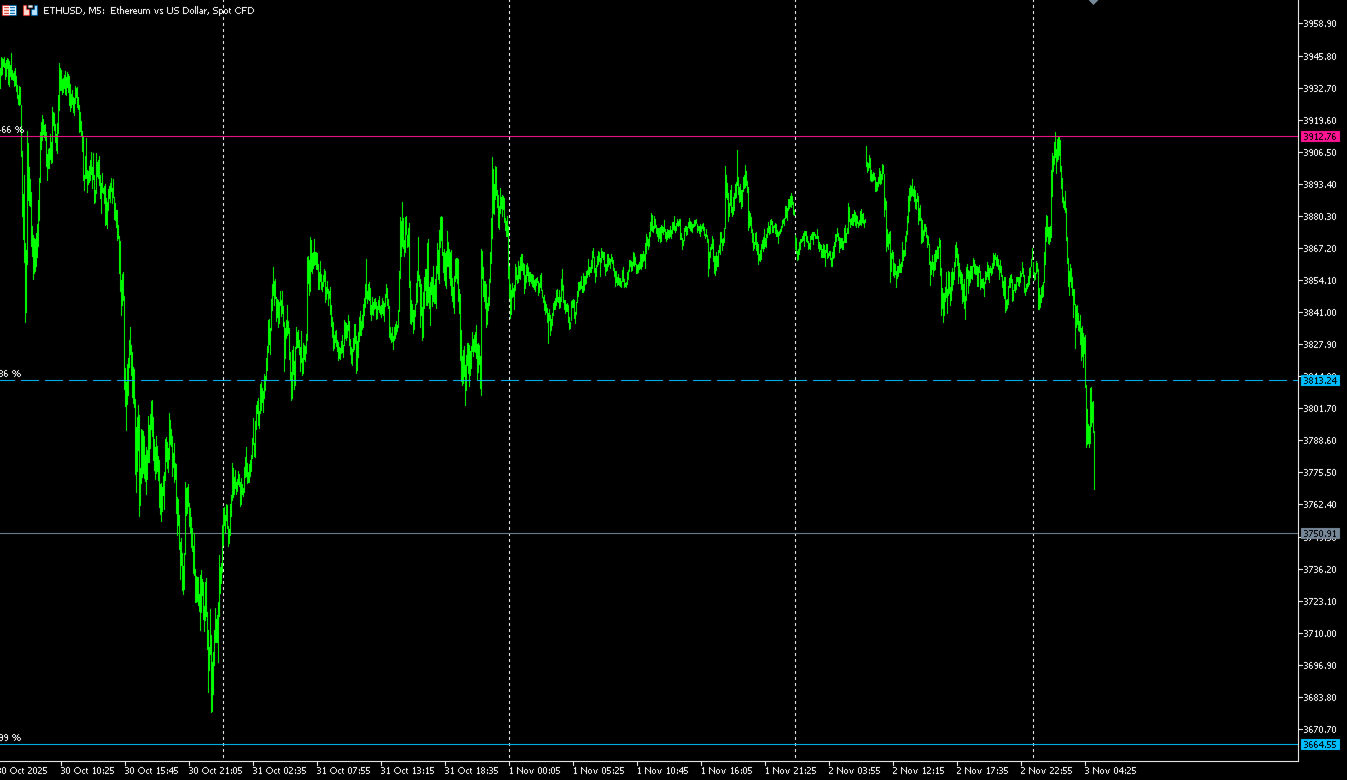
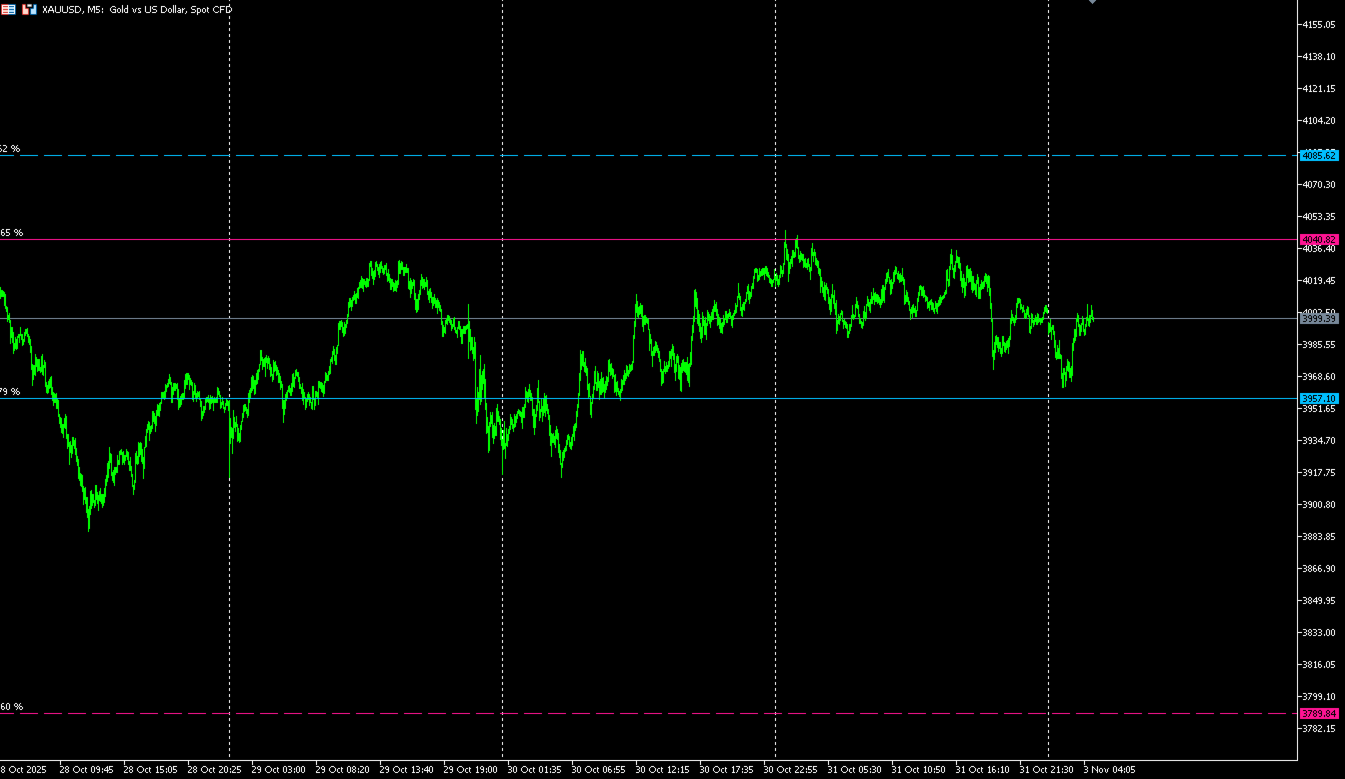
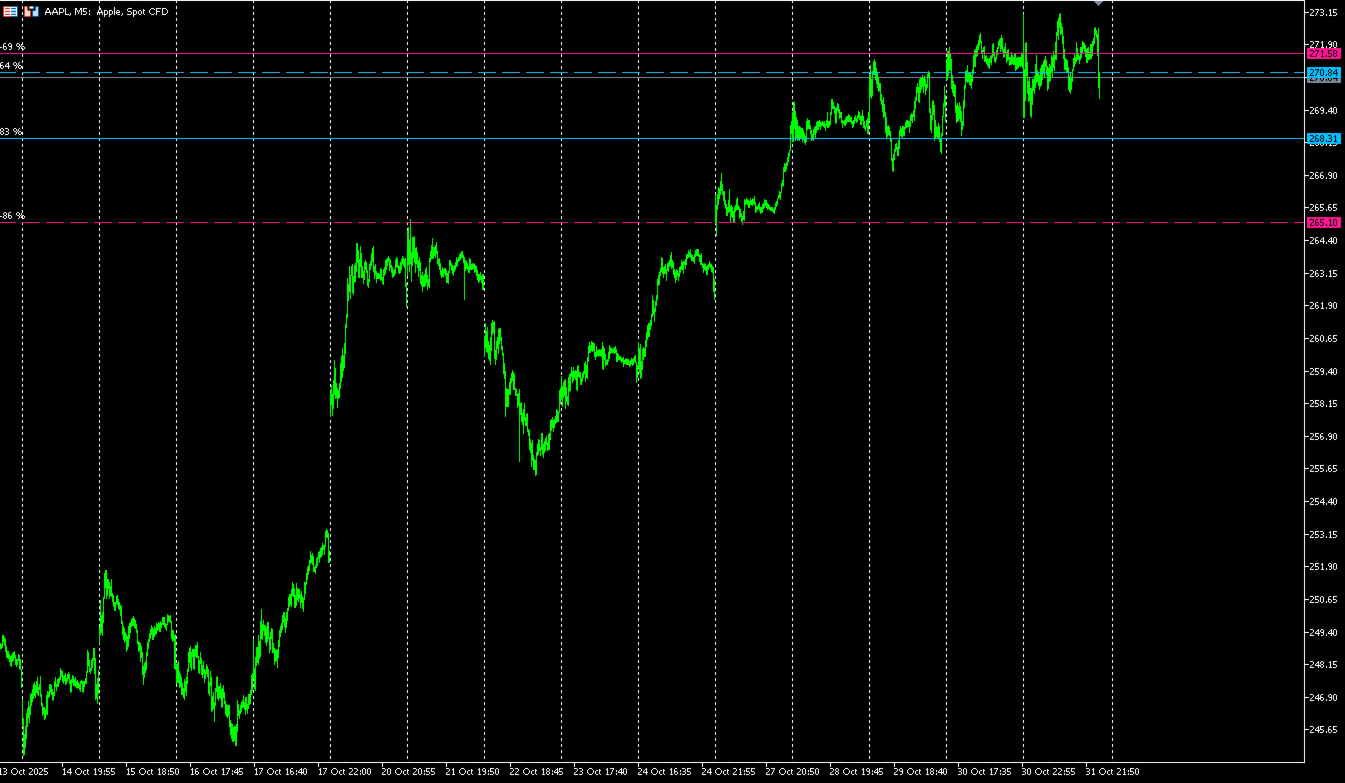
1. Displays Key Price Levels and Probability.
2. Key Price Levels: Calculated as (Buy + Sell) × (Limit + Stop) = 4 Lines, shown when Probability > 55%.
3. Time Frame Dependency: Each Time-frame has different OHLC prices, affecting Probability calculations.
4. Breakout Condition: If the price breaks the historical Highest or Lowest, Probability may reach 99%.
5. Parameter: PatrolPoints = 8 : The indicator recalculates only when the price moves over PatrolPoints (for reduce CPU usage). Set 0 to update Probability instantly.
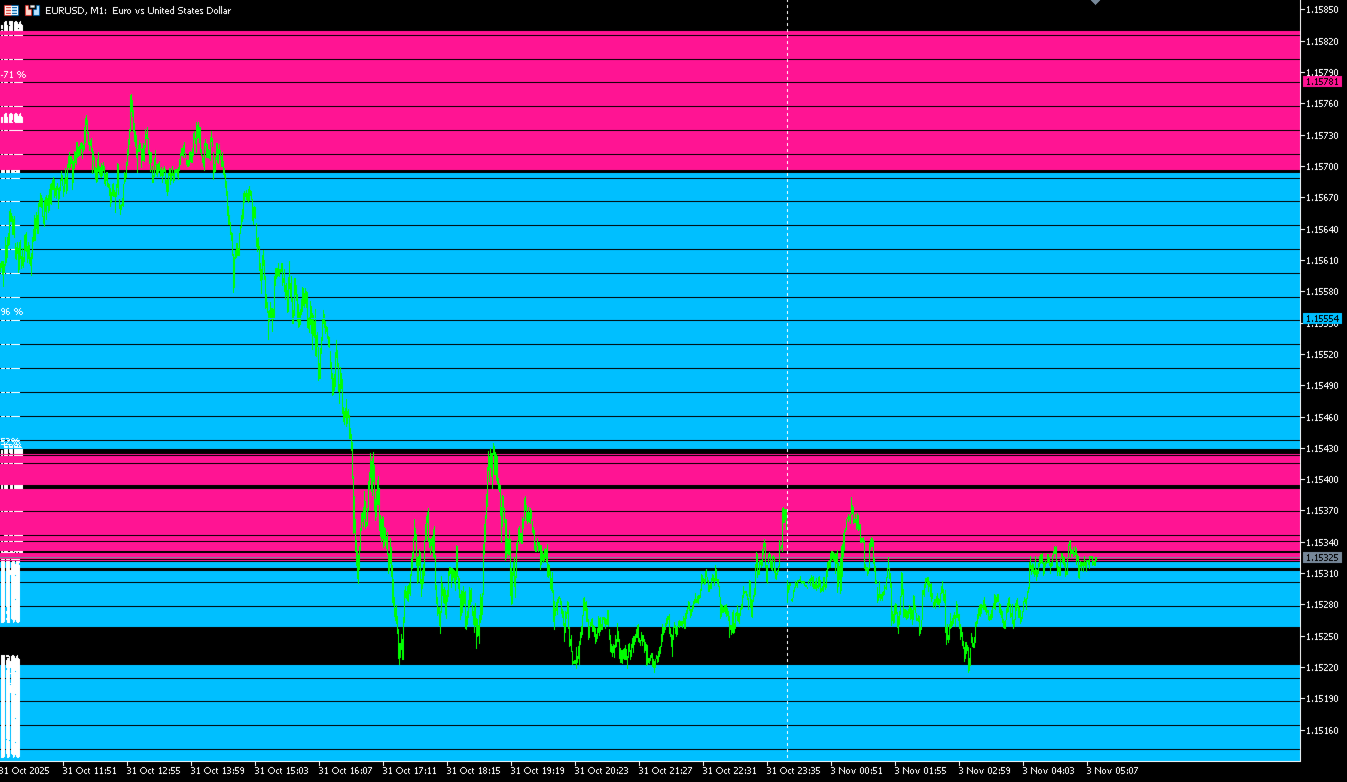
6. Parameter: HeatMap : Displays Probability lines in the background.
Additional Settings
DBBars = 100 (for reduces CPU usage) – Set 100000 (Max Bars in Chart) for more comprehensive analysis
Probability Updates – Probability changes with additional price bars or when switching Time-frames.
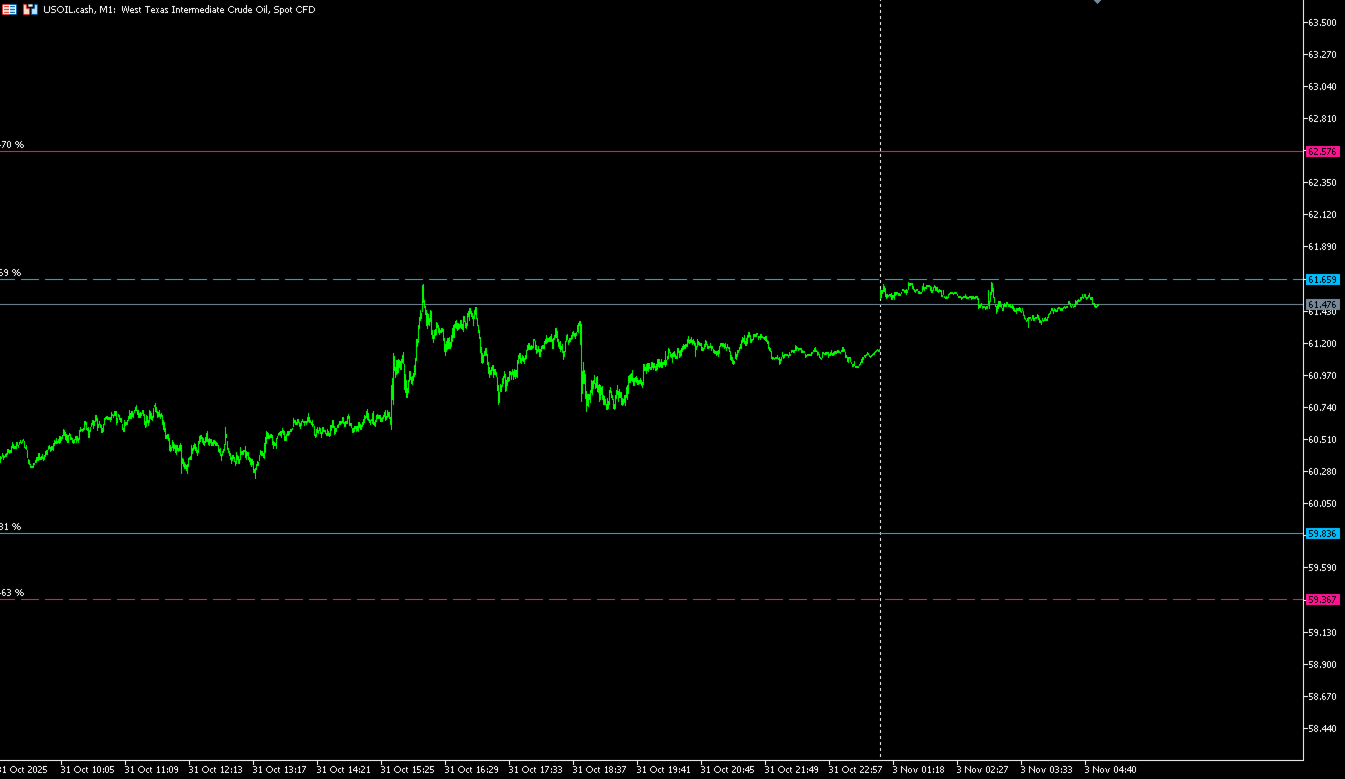
Recommended Time-frame: M1 (1-minute) for the most responsive Probability updates.
Features
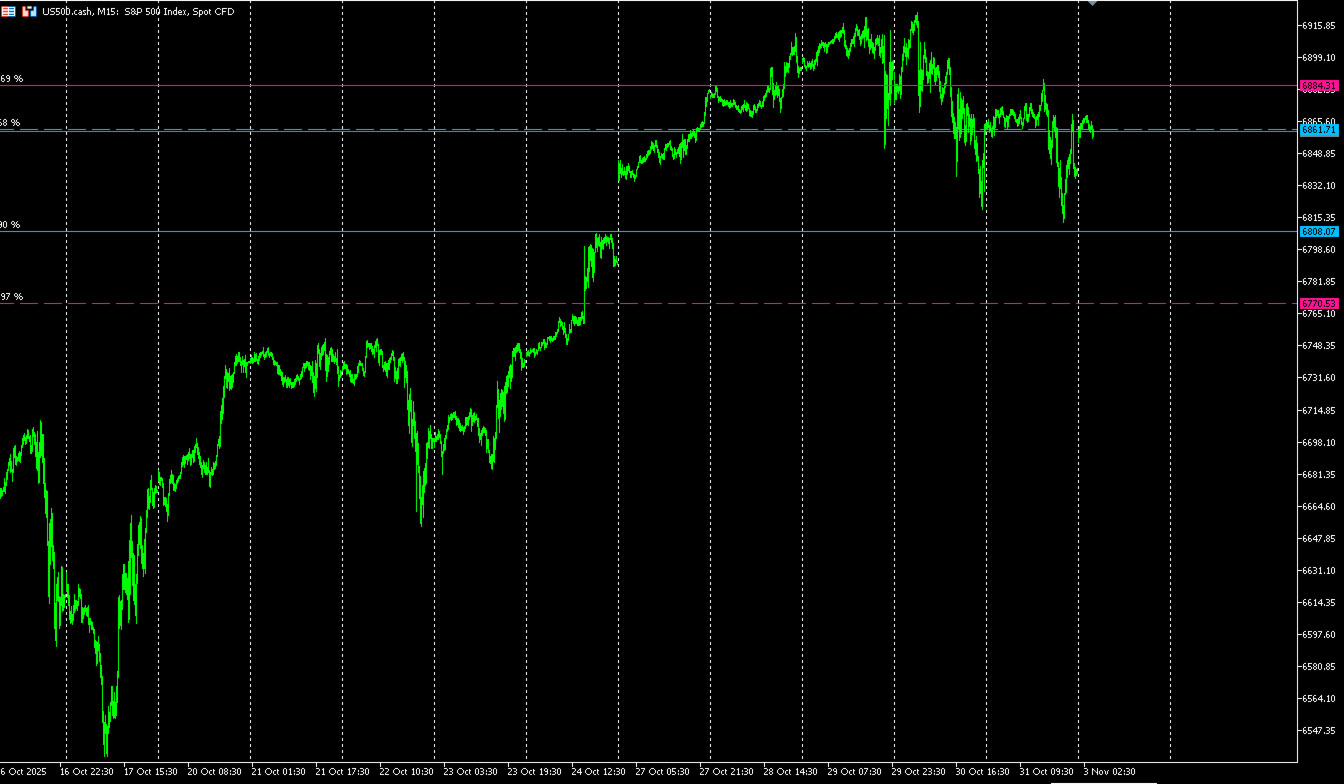
1. Displays Key Price Levels and Probability.
2. Key Price Levels: Calculated as (Buy + Sell) × (Limit + Stop) = 4 Lines, shown when Probability > 55%.
3. Time Frame Dependency: Each Time-frame has different OHLC prices, affecting Probability calculations.
4. Breakout Condition: If the price breaks the historical Highest or Lowest, Probability may reach 99%.
5. Parameter: PatrolPoints = 8 : The indicator recalculates only when the price moves over PatrolPoints (for reduce CPU usage). Set 0 to update Probability instantly.
6. Parameter: HeatMap : Displays Probability lines in the background.
Additional Settings
DBBars = 100 (for reduces CPU usage) – Set 100000 (Max Bars in Chart) for more comprehensive analysis
Probability Updates – Probability changes with additional price bars or when switching Time-frames.
Recommended Time-frame: M1 (1-minute) for the most responsive Probability updates.