 MetaTrader 5
 エキスパート
 インディケータ
 ライブラリ
ライブラリ
 ユーティリティ
 ウィジェット
 ルール
ルール
YouTubeにあるマーケットチュートリアルビデオをご覧ください
ロボットや指標を購入する
仮想ホスティングで
EAを実行
EAを実行
ロボットや指標を購入前にテストする
マーケットで収入を得る
販売のためにプロダクトをプレゼンテーションする方法
MetaTrader 5のための新しいテクニカル指標 - 184
 テクニカル指標からのシグナルは、株式および外国為替市場での取引の開始と終了に重要な役割を果たします。指標の本質は、将来の価格変動を予測することを目的とした金融銘柄価格の数学的変換です。
テクニカル指標をテストして、市場の動きとそれからの利益をより正確に予測します。
テクニカル指標からのシグナルは、株式および外国為替市場での取引の開始と終了に重要な役割を果たします。指標の本質は、将来の価格変動を予測することを目的とした金融銘柄価格の数学的変換です。
テクニカル指標をテストして、市場の動きとそれからの利益をより正確に予測します。 
サポート&レジスタンスレベルファインダー:
サポート&レジスタンスレベルファインダーは、取引におけるテクニカル分析を向上させるために設計された高度なツールです。ダイナミックなサポートとレジスタンスレベルを備えており、チャート上で新しいキーポイントが展開されるにつれてリアルタイムに適応し、ダイナミックかつレスポンシブな分析を提供します。そのマルチタイムフレーム機能により、ユーザーは任意の所望のタイムフレームで異なるタイムフレームからのサポートとレジスタンスレベルを表示でき、日足レベルを5分足のチャートに表示するなど、微妙な視点を提供します。このインジケーターは計算に過去のデータを使用します。レベルの検出時には複数パラメータ計算を使用します。ユーザーは、サポートとレジスタンスレベルの色を個別にカスタマイズでき、パーソナライズされたビジュアルエクスペリエンスを作成できます。ツールには価格が重要なレベルに近づくとトレーダーに通知するアラート機能も含まれており、タイムリーな意思決定を促進します。隠す/表示ボタンやレベルの可視性を迅速に切り替えるためのホットキーなどの便利な機能を備えており、サ
FREE
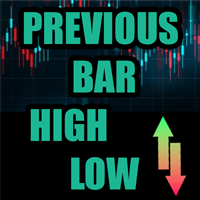
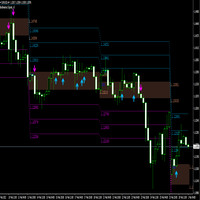
このインジケーターは、トレーダーの要件に従ってチャートをよりクリーンにするために有効/無効にできる最大6つのレベルをプロットします
これらの6つのレベルは2つのセットにあります:高と低
セットごとに、異なる時間枠を選択できます
価格が日次、週次、または月次の高値に達すると、通常5分などの短い時間枠で価格が拒否されると考えられるため、これは以前の高値と安値の反転の戦略に基づいています。
特徴 :
-単一のチャートで最大6つの時間枠の高値と安値を追跡します
-これらのレベルにアラートを設定します。メール、プッシュ、またはターミナルアラート。価格がこれらのレベルに達すると、即座にアラートが送信されます。
-線のスタイル、幅、色など、レベルのスタイルをカスタマイズします
-シフト:2日目または3日目の高低を追跡または調査したいですか?シフトは、2番目のバーの高低の場合は2に、3番目のバーの高低の場合は3に設定できます。
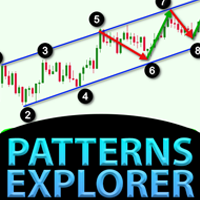
対称三角形、非対称三角形、直角三角形などの三角形パターン、立ち上がりウェッジや立ち下がりウェッジなどのウェッジパターン、拡張パターン、トレンドチャネルのパターンエクスプローラー
このインジケーターは、現在のパターンだけでなく過去のパターンも調査します。トレンドラインまたは三角形を手動で描画して時間を節約しようとし、チャートに最適なパターンをプロットする自動分析にこれを使用したい場合に最適なインジケーターです。
特徴 :
-最適なパターンを調整して見つけるためにZigZagextdepthを即座に変更するためのパネル
-パターンをジグザグの前のバーに戻し、過去に何が起こったかを調査します。トレンドラインが尊重されているかどうかを調査し、価格アクションを理解します。
以前の履歴パターンを調査し、このインジケーターを使用してそれらを分析および学習することにより、マスター戦略を考え出します。
-[切り替え]ボタンから、トレンドチャネルまたはトレンドラインからウェッジモードまたはトライアングルモードに即座に切り替えます
-パターンが変更されないようにパターンをフリーズするのを一時

Secreto is a fundamental technical indicator that allows you to assess the current market situation in order to enter the market of the selected currency pair in a trend and with minimal risk. It basically uses the process of identifying the rate of change in price growth and allows you to find entry and exit points from the market. The indicator can be used with an optimal risk-to-reward ratio, it shows good signals. Uses two options for settings. Shows favorable moments for entering the marke

Arrow technical indicator without redrawing Vendetta in the Forex market is able to give tips with the least errors. The indicator does not redraw its signals when the price changes. It combines several filters, displaying market entry arrows on the chart.
Every rise and fall is reflected in your emotional state: hope is replaced by fear, and when it passes, hope appears again. The market uses your fear to prevent you from taking advantage of a strong position. At such moments you are most vul

Reservoir is a reversal indicator and is part of a special category of instruments. The indicator not only analyzes the price movement, but also indicates the points of possible reversals. This contributes to the quick and optimal opening of buy or sell orders (depending on the current situation). In this case, the historical data of the analyzed asset is necessarily taken into account. It is the correct implementation of such actions that in many ways helps traders make the right decision in t

Salinui - Arrow trend indicator, without delay and redrawing, is used by traders in trend strategies in trading in financial markets (Forex, CFD, binary options). The indicator predicts the most likely short-term price movement based on complex mathematical calculations. One of the biggest challenges traders face is finding the right trading system for them. This indicator is designed to detect trends in price movement and allows you to quickly determine not only the direction of the trend, but
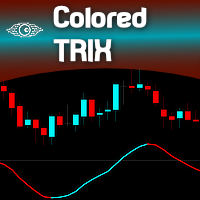
Developed by Jack Hutson in the 80's, the Triple Exponential Moving Average (a.k.a. TRIX ) is a Momentum technical indicator that shows the percentage of change in a moving average that has been smoothed exponentially 3 times. The smoothing process was put in place in order to filter out price movements that are considered insignificant for the analysis period chosen. We at Minions Labs found hard to follow the smoothness of the original TRIX line, so we colored the TRIX line with BUY and SELL t
FREE

About AIntel
Is there are reason you select RSI 14 or 21? Is there a reason you select EMA 25? Is there a reason you pick these periods for these and any other indicators? Those numbers might have worked 10 or 20 years ago. They might be working for traiding certain currency pair in a certain timeframe.. But they DO NOT give you the best profit and outcome at all times all pairs all trades! AInter is "automated inteligence" series indicators that optimize automatically for best profit so you don
An Adaptive Moving Average (AMA) is one more moving average overlay, just like EMA. It changes its sensitivity to price fluctuations . The Adaptive Moving Average becomes more sensitive during periods when price is moving in a certain direction and becomes less sensitive to price movement when price is volatile. For more information, welcome to our Telegram Group. https://t.me/InfinXx
FREE
A breakout refers to when the price of an asset moves above a resistance area, or moves below a support area . Breakouts indicate the potential for the price to start trending in the breakout direction. For example, a breakout to the upside from a chart pattern could indicate the price will start trending higher. The indicator works with arrows in case of breakthrough, you also have a level of 1 tp, a level of 2 tp, a level of 3 tp. For more information, welcome to our Telegram Group. https:
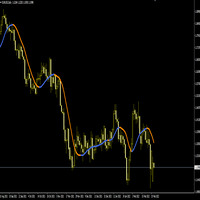
The Hull Moving Average (HMA) attempts to minimize the lag of a traditional moving average while retaining the smoothness of the moving average line. Developed by Alan Hull in 2005, this indicator makes use of weighted moving averages to prioritize more recent values and greatly reduce lag. The resulting average is more responsive and well-suited for identifying entry points. For more information, welcome to our Telegram Group. https://t.me/InfinXx
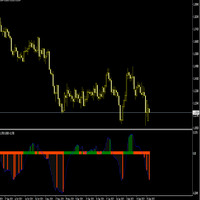
The Slope indicator measures the slope of a linear regression , which is the line of best fit for a data series. A 20-period Slope, therefore, measures the slope of a 20-day linear regression. ... In general, a positive slope indicates an uptrend, while a negative slope indicates a downtrend. How do you use slope Indicator?
By applying the slope indicator to both the price chart and the price relative , chartists can quantify the price trend and relative performance with one indicator. A pos

このインディケータは、相場の反転ポイントを予測する最もポピュラーなハーモニックパターンを識別します。これらのハーモニックパターンは、外国為替市場で常に繰り返され ている価格形成であり、将来起こりうる値動きを示唆します。/ MT4無料バージョン
さらに、このインジケーターには、市場エントリーシグナルと、様々な利食いと損切りが組み込まれています。ハーモニック・パターン・インディケータは、それ自体で売買シグナルを発 信することができますが、他のテクニカル・インディケータを使用してこれらの シグナルを確認することをお勧めします。例えば、RSIやMACDなどのオシレーターを使用して、トレンドの方向性やモメンタ ムの強さを確認してから売買を行うことを検討するとよいでしょう。
このインディケータのダッシュボードスキャナ: ( Basic Harmonic Patterns Dashboard )
含まれるハーモニックパターン ガートレー バタフライ バット カニ サメ サイファー ABCD
主な入力 Max allowed deviation (%): このパラメータは、調
FREE

このダッシュボードは、選択されたシンボルの最新の利用可能なハーモニックパターンを表示するので、時間を節約し、より効率的に / MT4バージョン 。
無料インジケーター: Basic Harmonic Pattern
インジケーター列 Symbol : 選択したシンボルが表示されます。 Trend : 強気または弱気 Pattern : パターンの種類(ガートレー、バタフライ、バット、カニ、サメ、サイファー、ABCD) Entry : エントリー価格 SL: ストップロス価格 TP1: 1回目の利食い価格 TP2: 2回目の利食い価格 TP3: 3回目の利食い価格 Current price : 現在値 Age (in bars): 最後に描画されたパターンの年齢
主な入力項目 Symbols: "28 Major Currency Pairs "または "Selected Symbols "から選択。 Selected Symbols: カンマで区切られた監視したいシンボル("EURUSD,GBPUSD,XAUUSD")。ブローカーがペアに接
The Market Reversal Catcher indicator looks for market reversal points or major pullback. To do this, it analyzes previous price movements and using a flexible algorithm for estimating the probability of a reversal, also gives recommendations on entry points and sets recommended profit targets for positions opened on a signal. Market Reversal Cather User Guide - Read Version for MetaTrader 4 - here The indicator is very easy to use and does not require a lot of information to understand how it

これは簡単に最も見過ごされている指標であり、価格行動に関するほとんどの洞察を提供します。それは私が自分で使用する唯一の指標です。
この指標は、今日の価格の動きと、最も可能性の高い方向についての洞察を提供します。
ADRは、1日の平均範囲を表します。日中取引または頭皮を使用する場合は、価格が変動する範囲を知っている必要があります。
価格がその日の通常の半分に移動し、価格アクションの最下部にあるとすると、価格が再び完全に上昇して1日の平均範囲に到達するのではなく、下降し続ける可能性が高くなります。価格は常に平均的な1日の範囲で動くことを目指しています。
また、動的なサポートと抵抗が与えられます。価格が平均レンジと同じくらい移動したとき、あなたは中間に向かって取引することができます。
このインジケーターは、価格がトレンドラインから跳ね返る可能性があるかどうかも通知します。したがって、トレンドラインを使用して取引する場合は、これが指標になります。
3種類のレンジがあります。
1.ブラックレンジ-現在の価格に基づく現在のレンジですが、価格が平均よりも大きく変動する場合は、上または

インデックスボラティリティトレンドインジケーター。
主な特徴:
これは、同じであるBinaryまたはDerivブローカーの合成インデックスにのみ使用されます。 トレンドフィルターが付いています。 値下げの可能性を警告するサウンドアラートがあります。 あなたがそれをVPSに置くならば、それはあなたにモバイルアラートを送ることができます。 これは、効率を高めるように設計されたL566b12アルゴリズムで構成されています。
インジケーターの使い方
M1のテンポラリティで動作します。 トレンドは強いに違いありません。 シグナルキャンドルがトレンドとは異なる色で終了するのを待ちます。 次のローソク足の開始時にトレード権を入力するには、デリバティブクロックの57秒に入力します。 マルチンゲールは2つまでしか適用できません。
詳細についてはお問い合わせください:
WhatsApp: +5930962863284
購入後、このツールから最も可能性のあるメリットを得る方法について、ドライブで追加のガイドを送信するように私に連絡してください。
最高のチケッ

この需給ゾーンインジケーターはチャート上にゾーンを描画し、価格がゾーンに到達またはゾーンを超えたときにアラートを送信します。ゾーンの代わりに、通常のダブルトップ/ボトムについてアラートを受け取るために使用することもできます。 RSI、ADX、ボリューム、および発散フィルターを使用して、最も強力なセットアップのみをフィルターで除外することができます。独自のルールとテクニックを組み合わせることで、このインジケーターを使用して、独自の強力なシステムを作成(または強化)できます。この指標は、需要と供給にすでに精通している経験豊富なトレーダー向けであり、取引を終了または開始することを決定する際にどのように使用できるかを示しています。 特徴
次の分岐がサポートされています。 MACD、OsMA、RSI、CCI、確率論的および素晴らしい。 ゾーンには3色があります(入力で調整可能)。テストされていないゾーンの場合は暗い色、テストされたゾーンの場合は中程度、壊れたゾーンの場合は明るい色。 ゾーンの外側の境界線の価格とゾーンテストの量は、各ゾーンで書き込まれます。 インディケータは、エキス
Indicator Constant TF Moving Average basically is the same Moving Average indicator, but differently it always shows the price values of chosen time frame. Also, number of periods to show can be selected. Indicators purpose is to use it as support and resistance level in smaller time frames than selected in Input menu. How it looks like you can see in screenshots and video. ---------Main settings-------- Timeframe - choose time frame from dropdown menu Number of periods to show - enter the integ

The indicator, Big Candle Detect , is based on ATR and Volume to detect candlesticks of buying and selling strength, which is represented through an oscillator indicator. With this indicator you will be able to identify the lateral market, providing better entries according to your strategy.
Big Candle Detect highlights candles with brighter colors when the condition is found, making it easier to identify, in addition to being fully compatible for automation in your EA.
SETTINGS
ATR Period
An indicator for analyzing different currency pairs simultaneously Forex is a complex market that requires several currency pairs to be analyzed simultaneously Determine the number of currency pairs yourself Determine the currency pair you want to analyze to analyze 4 of the most important and similar currency pairs at the same time. For direct and simple analysis, some currency pairs have changed (EURUSD>>>USDEUR) Do not doubt that to succeed in this market, you must analyze several currency pa
FREE

The indicator draws lines (with line objects) to the close prices of the last closed bars, on selected timeframes. Parameters
Close line 1 close price timeframe - timeframe of the 1st close price Close line 1 color - color of the 1st close price Close line 1 width - width of the 1st close price Close line 1 style - style of the 1st close price Close line 1 max count - the maximum number of lines plotted for the 1st close price, considering the selected timeframe in Close line 1 timeframe paramet

Holiday Sales Zones Indicator The Zones Indicator is your everyday Trading tool that leverages advanced algorithms, including ICT institutional concepts like order blocks , engulfing candle patterns , and Level interactions , to identify critical levels of supply and demand (Resistance & Support). Visual signals are generated and clearly marked on the chart, providing a straightforward guide for traders to spot key opportunities.
Key Features Advanced Algorithmic Analysis : Identifies supply
O indicador mostra as principais regiões de compradores e vendedores. Onde há defesa e agressão dos players do mercado, possíveis locais de STOPS. Regiões em vermelho com Setas para baixo indicando onde houve vendedores atuando no mercado. Regiões em verde com Setas para cima indicam onde houve compradores atuando no mercado. Indicador mostra locais interessantes para operar, onde o Stop é mais barato.

TrendHunt is an indicator focus on higher timeframe (H1 and Above) It using breakout strategy, plus MA for filter. Check for Support, Resistance and News before every entry to increase the success rate.
Parameters Moving Average Period - 200 Moving Average Price - Closed Price Entry Period - 20 (Breakthrough 20 High for Long, 20 Low for short) Stop Period - 10 (cross over 10 low for exit long)
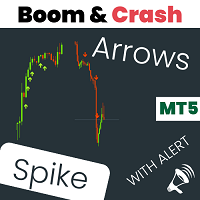
ブームおよびクラッシュスパイク検出器インジケーターは、主に価格のブームおよびクラッシュを検出するための高度な戦略に基づいてコーディングされています。 価格の高確率のブームとクラッシュを検出するために、複雑なアルゴリズムが組み込まれました。 ブームまたはクラッシュフェーズの可能性について警告します。
ブームフェーズ:価格の上昇が速すぎる場合。 クラッシュフェーズ:価格の低下が速すぎる場合。
期間限定オファー:インジケーターは30ドルと生涯でのみご利用いただけます。
主な機能
プッシュ通知を携帯電話に送信します コンピューターまたはラップトップでポップアップしてアラートを鳴らします 再描画されない矢印を表示します(潜在的なブームの場合は上向きの矢印、潜在的なクラッシュの場合は下向きの矢印) すべてのペアでの作業。
おすすめ
時間枠:H1およびH4 ペアの推奨:トレンドフェーズのペア。
コンタクト
ご不明な点がある場合やサポートが必要な場合は、プライベートメッセージでご連絡ください。
著者
SAYADI ACHREF、fintechソフトウェアエンジニアおよびFinansyaの
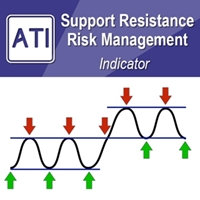
Introduction to Support Resistance Risk Management Support Resistance is the most trusted technical analysis. However, the risk management for the support and resistance is not practiced often. Hence we provide one effective risk managment method for the support and resistance trader. In the book: Scientific Guide To Price Action and Pattern Trading (Wisdom of Trend, Cycle, and Fractal Wave), how to use Support Resistance is described as well as Fibonacci Analysis, Harmonic Pattern, Elliott Wave
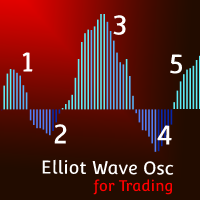
MT4 Version Elliot Wave Oscillator MT5 Elliot Wave Oscillator MT5 is an indicator designed to support Elliot Wave counts. The default settings help filtering out the noise in the market allowing a clear perception for the waves counts in differnt timeframes. Elliot Wave Oscillator high customization level allows the you to optimize this indicator to your personal preferences. Shorter Periods and faster reactive MAs will provide more infomation but will require a higher level of experience for a
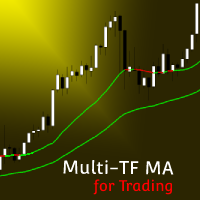
MT4 Version Multi Timeframe MA MT5 Multi Timeframe MA MT5 is an indicator that offers the representation of up to 3 MAs with different Periods and Timeframes. This allows the user to reprensent in one chart and timeframe information coming from other timeframes and get notified as any of the MAs crosses another one. Multi Timeframe MA is the first indicator in the market that offers Multi Timeframe interactions and a high customization level from up to 7 different MA types (SMA, EMA, WMA, Smooth

This project did not reach the basic funding number, so I am abandoning it momentarily. The system is now free for other traders to continue the idea. You can follow my new project through my signals.
A tool for institutional investor, now avaliable for Home users. We equip you like banks equip their analysts!
How it works
Focused on the Forex market, it takes advantage of the need of nations to control the value of their currency and the world exchange variations to analyze, through the pro
FREE
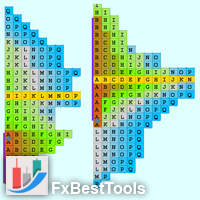
Definition : A Market Profile is an intra-day charting technique (price vertical, time/activity horizontal). Market Profile is best understood as a way to see order in the markets. Market Profile was a way for traders to get a better understanding of what was going on, without having to be on the trading floor. The current indicator is developed based on Easy-to-Use architecture including a wide range of visual settings.
Major Features of Indicator : Various Views of Market Profile The indicat
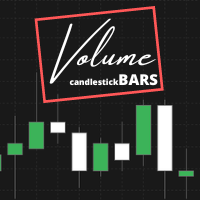
Indicator that show candlestick bars with an different sampling method than time fixed. Real time data is sourced to the indicator and it may be used as substitute of the default graph. Each bar is formed when a predefined volume of assets was dealt, showing in the graph the OHLC of this clustering. The amount of bars is proportional to the amount of negotiations instead of a sample in a fixed amount of time. If the broker doesn't show the real volume of the trades, this indicator won't work. Th
FREE
This indicator is mainly used for my SuperDonchain EA but can also be used as a simple indicator. It draws a donchain channel in the chart window. It has various setting options which affect the graph. Furthermore, the colors of the graph can be adjusted. Simply copy it into the indicators folder and drag it from there into the chart window https://www.mql5.com/de/market/product/78025?source=Unknown%3Ahttps%3A%2F%2Fwww.mql5.com%2Fde%2Fmarket%2Fmy
This indicator is mainly used for my SuperDonchain EA but can also be used as a simple indicator. It draws a simple supertrend on the chart window. It has various setting options which affect the graph. Furthermore, the colors of the graph can be adjusted. Simply copy it into the indicators folder and drag it from there into the chart window. https://www.mql5.com/de/market/product/78025?source=Unknown%3Ahttps%3A%2F%2Fwww.mql5.com%2Fde%2Fmarket%2Fmy
This indicator calculates trend via two different moving averages and draw zigzag trend lines. You can change fast and slow Moving Averages settings for customization. Inputs:
Fast MA Time Period : 64 Fast MA Shift: 0 Fast MA Method: Smoothed Fast MA Apply To: Median Price Slow MA Time Period: 32 Slow MA Shift: 0 Slow MA Method: Smoothed Slow MA Apply To: Median Price ZigZag Color: Red ZigZag Type: DashDot ZigZag Width: VeryThin
FREE

PAX BDB Trade Chaos system of Bill Williams (Bearish/Bullish divergent bar). One of the signals of the "Trade Chaos" system of Bill Williams. (First wiseman)
When bar moving away from the "Alligator" indicator and there is divergence on the Awesome Oscillator indicator, it shows a potential point of movement change.
It is based on the opening/closing of the bar, the position relative to the previous ones, the Alligator and AO.
When trading, the entrance is at the breakthrough of the bar(short
Индикатор отображает размер бара и его направление. ---------------------------------------- Цвета гистограммы: * Красный - Медвежий бар.
* Зелёный - Бычий бар.
* Серый - Цена открытия и цена закрытия равны. * Синяя линия - скользящая средняя.
---------------------------------------- Параметры: - Type of Calculation - Тип расчёта ( High - Low, Open - Close ) - Moving Avarage - Период скользящей средней - Method for MA - Метод усреднения скользящей средней
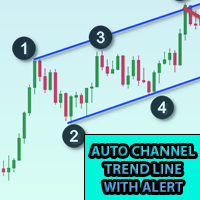
このインジケーターをチャートに追加し、ZigZagのExtDepth設定を設定します
価格がトレンドラインのアッパー、ロワー、またはミドルチャネルに触れると即座にアラートを出します
特徴 :
-上、下、または中線のアラートを有効/無効にします -アラートの後に一時停止を数秒で追加 -チャート上のボタンでトレンドチャネルを一時停止または一時停止解除 -入力フィールドにポイントを追加して早期アラートを追加します。たとえば、ETH価格は2900.25で、ここでは25桁が「ポイント」です。したがって、入力フィールドに25をポイントで追加し、トレンドチャネルの下線の値が2900.25の場合、次のようになります。 2900.50に早期アラートを受け取ります(設定から25ポイントを追加)
-方向性タッチを有効/無効にします。詳細についてはスクリーンショットを参照してください。価格が下からの抵抗と上からのサポートに触れる場合、方向性タッチが考慮されます。この機能は、複数のアラートからのノイズを回避するために追加されます 1分から5分のチャートで下取りする場合、Extdepthへの推奨設定は5

説明 :
外国為替市場(PSAR)で専門的で人気のあるインジケーターの1つに基づいた新しい無料インジケーターをご紹介します。このインジケーターは元のパラボリックSARインジケーターの新しい変更です。プロSARインジケーターでは、ドットと価格チャートのクロスオーバーを見ることができます。クロスオーバーはシグナルではありませんが、動きの終わりの可能性について話します。新しい青いドットで購入を開始し、最初の青いドットの1 atr前にストップロスを配置し、最後にドットが価格チャートを横切るとすぐに終了できます。
売買シグナルを開く方法は? 最初の青い点によるオープンバイトレードと最初の赤いドットによるオープンセルトレード
正しいストップロスはどこにありますか? 安全なストップロスは最初のドットにある可能性があります(最初の青いドットの買いの場合と最初の赤い点の売りの場合)
正しいテイクプロフィットはどこにありますか? テイクプロフィットはストップロス距離とRRに基づいて調整できるので、私の提案は2 RRで、ストップロスの2倍です。
利益を上げているのにtpを達成できなかった場合
FREE

The indicator helps to enter a trade following the trend, at the same time, after some correction. It finds strong trending movements of a currency pair on a given number of bars, and also finds correction levels to this trend. If the trend is strong enough, and the correction becomes equal to the one specified in the parameters, then the indicator signals this. You can set different correction values, 38, 50 and 62 (Fibonacci levels) are better. In addition, you can set the minimum trend lengt

The trend is your friend!
Look at the color of the indicator and trade on that direction. It does not repaint. After each candle is closed, that's the color of the trend. You can focus on shorter faster trends or major trends, just test what's most suitable for the symbol and timeframe you trade. Simply change the "Length" parameter and the indicator will automatically adapt. You can also change the color, thickness and style of the lines. Download and give it a try! There are big movements w
KT Bollinger Shots works using a striking blend of the slingshot pattern and the mean-reversion phenomenon applied to financial markets.
In addition, a mathematical algorithm is used with variable deviation to fine-tune the indicator's signals on a different level.
Winning Trade: After a signal, if price touches the middle band in profit, it is considered a winner. Losing Trade: After a signal, if price touches the opposite band or touches the middle band in loss, it is considered a loser.
!
SEE THE TREND ON EVERY TIME FRAME. INTELLIGENT INDICATOR READS PRICE ACTION TO SPOT TRUE MARKET CYCLES AND TREND. This advanced multi-currency and multi-time frame indicator, reads trend in real-time so you always know the trends of the markets you want to trade.
Trend-Viewer Pro has been specifically designed to read the trend of every time frame and every market , simultaneously, making it much easier for you to find markets with time frame correlation , so you can focus on th
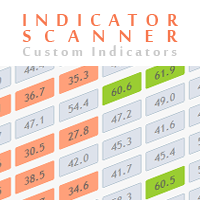
Advanced Indicator Scanner is a multi-symbol multi-timeframe scanner that works with hundreds of custom indicators available across the web including mql5 website market and codebase indicators.
Advanced Indicator Scanner features:
Scans your indicator in 28 customizable instruments and 9 timeframes. Monitors up to 2 lines(buffers) of an indicator. Showing of indicator value on buttons. You can choose between 3 alert modes: Single symbol and timeframe Multiple timeframes of a symbol Multiple
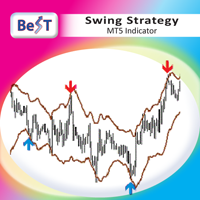
BeST Swing Strategy MT5 is a Metatrader indicator based on the corresponding Jim Berg's work about volatility as described in his article "The Truth About Volatitlity" (TASC 2/2005).The indicator consists of 2 channel lines deriving as (MA+/- times the ATR) and can be used as a standalone trading system.The outlier prices of the Market as of the indicator's values can be used for producing Entry and Exit Signals.
Advantages of the indicator
== Uses 2 Swing Strategies
== Never repaints its Sig
Bollinger Band is one if the most useful indicators if used properly. Trend Guard used the parameters based on Bollinger to create a tool that can help traders enter trades at most optimal level. The indicator is useful to all traders since it checks for retracements and changing trend direction. With this indicator, you get the opportunity to open trades early and also lock your profits based on the dotted trend lines that form after a certain level of Bollinger band. We have simplified the ind

Indicator that show candlestick bars with an different sampling method than time fixed. Real time data is sourced to the indicator and it may be used as substitute of the default graph. Each bar is formed when a predefined amount of ticks is received, showing in the graph the OHLC of this clusteri of ticks. The input variable is the amount of ticks of each bar. It's a different approach of sampling, the amount of bars is proportional to the amount of negotiations insted of a sample in a fixed am
FREE

Gartley Hunter - An indicator for searching for harmonic patterns (Gartley patterns) and their projections. The indicator is equipped with a system of alerts and push notifications. Manual (Be sure to read before purchasing) | Version for MT4 Advantages
1. 12 harmonic patterns: 7 classical and 5 exotic. New patterns will be added as the indicator develops. 2. Constant automatic search for harmonic patterns. The indicator is capable of finding from the smallest to the largest patterns. 3. Automa
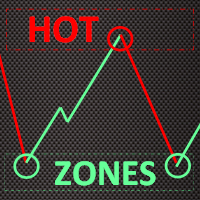
This indicator simplifies your entry zones by displaying the areas where you can plan your entry that potentially could give you high risk/reward ratios. Other than picking the most optimal entry points, the Hot Zone indicator can act as your typical support/resistance indicator for pullbacks for all timeframes. You can use this indicator as the only trading indicator or use it with another indicator for reentry purposes. Besides, when using Hot Zones, the risk/reward ratio should be well abov

Investment Castle News — Stay Ahead of the Headlines
The Investment Castle News Indicator plots upcoming economic news events directly on your chart, so high-impact releases never catch you off guard. Know what's coming, and trade around it with confidence.
What it does for you News on your chart: upcoming events marked right where you trade — no separate calendar tab. Avoid nasty surprises: see high-impact releases before they hit the market. Plan around volatility: time your entries and exit
FREE
When trading price action or using price action triggers such as Pbars, Inside Bars, Shaved Bars, etc. it is important to always wait for the bar/candle to close more than anything else.It is often the case (whether it’s the 4H, hourly, etc) that price action will be dominant in one direction for the majority of the candle only to reverse strongly at the end of the candle. Institutional traders know retail traders are less disciplined than they are. They know a good trading candle pattern coul
FREE

This simple, yet powerful indicator is very good way to determine actual S/R levels. It's main purpose is making your overview on markets much better.It has built-in arrow signal system, which should be used along with MT indicators for best results.Just try it.
Recommended MT indicators to use along:
Bollinger Bands (default) RSI (period 3, levels 10/90)
マルチタイムフレーム対応、カスタマイズ可能なビジュアルシグナル、設定可能なアラートシステムを備えたRate of Change(ROC)インジケーター。
フリーランスのプログラミングサービス、アップデート、その他のTrueTL製品は MQL5プロフィール でご利用いただけます。
フィードバックとレビューを大変感謝いたします!
ROCとは? Rate of Change(ROC)は、指定した期間における価格の変化率をパーセンテージで測るモメンタムオシレーターです。現在の価格をn期間前の価格と比較し、差をパーセンテージで表示することで、価格動向の速度を容易に把握できます。 正のROC値は上昇モメンタムを、負の値は下降モメンタムを示します。ROCが零線をクロスすると、トレンド転換の可能性を示します。トレーダーはROCを使って買われすぎ・売られすぎの状態を識別し、トレンドを確認し、価格とモメンタムの乖離を発見します。 機能: 矢印と垂直線によるビジュアルシグナルマーカー 設定可能なトリガーを持つ3つの独立したシグナルバッファ シグナル検出オプション:方向転換、レベルクロス、ピーク/バレー
FREE
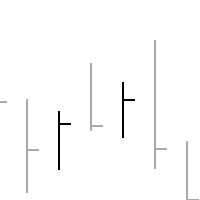
**************************************************************************** このインジケーターの役割はただ一つ、HLCバー(建値のないバー)としてチャートを表示することです。
また、このバーには2つの特徴があります。
バーの色は、現在のバーの終値と前のバーの終値を比較して決定されるため、価格のギャップ(隙間)による混乱が生じないようになっています。この状況の例をスクリーンショットに示します(標準的なローソク足が表示されているバーと比較しています)。 バーの色や太さを編集することができます。 ****************************************************************************

A machine translation from English product description was used. We apologies for possible imprecisions. 英語の製品説明からの機械翻訳が使用されました。 不正確な可能性があることをお詫び申し上げます。 お気に入りのろうそく足の価格アクションパターンの視覚化システム。 アタッチされると、インジケーターはチャート上の次のパターンを自動的にマークします。 ピノキオバー - 長い「鼻」を持つ小さなボディのバー、非常によく知られている逆のパターン。 内側のバー - 範囲が前のバーの範囲内にあるバー。 それは市場の不確実性を表しています。 外側のバー - 範囲が前のバーの範囲を超えるバー。 それは市場の不確実性を表しています。 レールパターン - ほぼ等しく、より大きなボディを持つ 2 つの結果として生じる反対側のバー。 逆のパターン。これは、より高い時間枠のピノキオバーパターンと実際に一致します。 マスターキャンドル パターン - キャンドルの 5 つ、後続の 4 つのキャンド
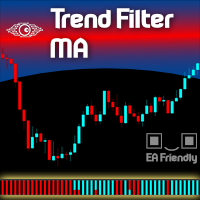
One of the best tools category for an Expert Advisor is the Filtering System . Using a filter on your entries will take your metrics to the good side. And even when you trade manually a filtering system is more than welcome. Let us present a commonly used filtering system based on Exponential Moving Averages - in fact, you can choose the type of the MAs as you wish and also mix them all up - we called this indicator Filter Trend MA . We present this indicator as a colored strip you can use at th

MT4 Version Wave Trend MT5 Wave Trend is an oscillator, which helps identifing in a extremely accurate manner market reversals. The Oscillator being obove the overbought level and a cross down of the fast into the slow MA usually indicates a good SELL signal. If the oscillators is below the oversold level and the fast MA crosses over the slower MA usually highlights a good BUY signal. The Wave Trend indicator can be also used when divergences appear against the price, indicating the current move

Ronal Cutrim has been a dedicated mathematician for 14 years and has more than 10 years of experience in the financial market.
The concept of the theory is simple, find imbalance between buyers and sellers. Which makes a lot of sense, because nothing goes up forever, nothing falls forever. When you find an asset with a mathematical probability of unbalanced equilibrium, it is a great way to get into trading: TUTORIAL: Turn on the subtitles, the video is subtitled
Indicator - HotKeys allows you to make your work in the MT5 terminal more comfortable
Indicator features: - Calling the creation of an object on the chart with keyboard shortcuts - Enable/disable auto scroll - Quick switching between main custom templates
Preset keyboard shortcuts: - Rectangle - Q - Fibo - E - Horizontal level - R - Cut - T - Auto Scroll - A
You can assign other keyboard shortcuts (capital letters of the English alphabet only)
Important: The indicator does not allow you
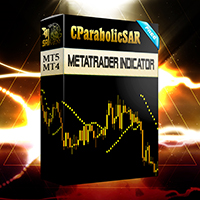
This indicator is based on ParabolicSAR. This indicator does not change the trend easily and does not change the trend until it receives a clause and approval. This indicator can be used for trail stop or trend detection.
MT4 Version
benefits:
Works on all instruments and time series,
Does not redraw its results,
Comparison depth is adjustable,
Works well with any popular strategy,
The power of the areas is adjustable,
We assure you that we welcome any
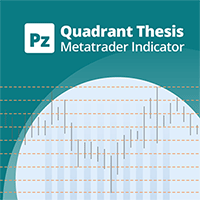
This is a general purpose indicator that displays colored lines at fixed and customizable price intervals, entered as parameters. It offers universal, constant, and familiar price ranges that allow quick and precise price analysis of a currency pair. With default parameters, this indicator implements The Quarters Theory , as described originally by Ilian Yotov . [ Installation Guide | Update Guide | Troubleshooting | FAQ | All Products | Get Help ] Easy to use No optimization needed Customiz
FREE

The M Extensions are variations of the Golden Ratio (Fibonacci Sequence). It is the World's first technique developed for Candle Projections.
Advantages:
Easy to plot. Candle anchoring; High and accurate precision as support and resistance; Excellent Risk x Return ratio; Works in any timeframe; Works in any asset / market. The M Extensions are classified into:
M0: Zero point (starting candle) RC: Initial candle control region M1: Extension region 1 M2: Extension region 2 M3: Extension regi
FREE

Indicator that shows you at any time the current number of closed deals as well as profit and loss totals of the closed deals of the account that you're logged into for a configurable period.
To do this, it is best to load Deals and "Complete history" in the account history in the terminal and then enter the desired period in the indicator (e.g. 2022.01.01-2023.01.01 would be for calendar year 2022).
Input options:
- Period (Attention: corresponding data must be loaded into the account hist

Hello Traders
I have created this indicator to Catch SPIKES on Crash1000, Crash500 and Crash300. Follow the below mention instruction for better Result
1. When Red arrow pop up on the Chart, Take a Sell entry
2. Stay in trade until price break below from entry
3. Do not hold trades after all trades went in Blue
4. Keep adding position until spike cross below from intial entry
See Example for more assistance
マルチタイムフレーム対応、カスタマイズ可能なビジュアルシグナル、設定可能なアラートシステムを備えたForce Indexインジケーター。
フリーランスのプログラミングサービス、アップデート、その他のTrueTL製品は MQL5プロフィール でご利用いただけます。
フィードバックとレビューを大変感謝いたします!
Force Indexとは? Force IndexはAlexander Elderによって開発され、価格の方向性、価格変動の大きさ、出来高を組み合わせて価格動向の背後にある力を測定します。今日と昨日の終値の差に、その期間の出来高を掛け合わせ、移動平均スムージングを適用することで計算されます。 正のForce Index値は買い圧力(強気派が優勢)を、負の値は売り圧力(弱気派が優勢)を示します。短期のForce Indexはトレンド内の調整での参入ポイントの特定に使用し、長期のものは主要な転換点を特定します。ゼロラインのクロスはトレンド方向の変化を確認します。 機能: 出来高統合モメンタム計算 スムージング用の設定可能なMAメソッド(SMA、EMA、SMMA、LWMA) 矢
FREE

MT4 Version MA Ribbon MT5 MA Ribbon is an enhanced indicator with 8 moving averages of increasing periods. MA Ribbon is useful to recognize trend direction, reversals and continuation points in the market as well as potential entry, partial take profit and exit points. Entry points for long and shorts position can be found when the price entries or leaves the Ribbon, at retest or a defined number of MA crossovers. It offers a good combination with mostly any volume or momentun indicators to

MT4 Version Most indicators draw lines.
This one draws the battlefield. If you ever bought an EA or indicator based on a perfect equity curve — and then watched it bleed out live — you’re not alone.
The problem? Static logic in a dynamic market. Fibonacci Bollinger Bands adapts.
It combines Bollinger structure with customizable Fibonacci levels to mark zones of control — where price reacts, pauses, or reverses. No magic. Just logic that follows volatility. Why this tool matters It
FREE

The main application of the Rwanda indicator is to generate buy and sell signals. Displays the Rwanda indicator signals on the price function chart using a mathematical approach. The indicator determines the long-term and short-term trend. The best result is given by the combination of the indicator with fundamental news, it can act as a news filter, that is, it can show how the market reacts to this or that news.
With this indicator, you can predict future values. The indicator is designed to

The main purpose of the Deathly indicator is to evaluate the market. Red dots indicate that the priority should be to open SELL positions. The blue color indicates that it is time for BUY trades. Using the indicator is very convenient and easy. The indicator is universal. It is applied at any time intervals. You can use the indicator to trade different assets. The tool is perfect for Forex trading. It is actively used for trading in commodity, commodity and stock markets.
The indicator impleme
MetaTraderマーケットが取引戦略とテクニカル指標を販売するための最適な場所である理由をご存じですか?宣伝もソフトウェア保護も必要なく、支払いのトラブルもないことです。これらはすべて、MetaTraderマーケットで提供されます。

取引の機会を逃しています。
- 無料取引アプリ
- 8千を超えるシグナルをコピー
- 金融ニュースで金融マーケットを探索