 MetaTrader 5
 エキスパート
 インディケータ
 ライブラリ
ライブラリ
 ユーティリティ
 ウィジェット
 ルール
ルール
YouTubeにあるマーケットチュートリアルビデオをご覧ください
ロボットや指標を購入する
仮想ホスティングで
EAを実行
EAを実行
ロボットや指標を購入前にテストする
マーケットで収入を得る
販売のためにプロダクトをプレゼンテーションする方法
MetaTrader 5のための新しいテクニカル指標 - 177
 テクニカル指標からのシグナルは、株式および外国為替市場での取引の開始と終了に重要な役割を果たします。指標の本質は、将来の価格変動を予測することを目的とした金融銘柄価格の数学的変換です。
テクニカル指標をテストして、市場の動きとそれからの利益をより正確に予測します。
テクニカル指標からのシグナルは、株式および外国為替市場での取引の開始と終了に重要な役割を果たします。指標の本質は、将来の価格変動を予測することを目的とした金融銘柄価格の数学的変換です。
テクニカル指標をテストして、市場の動きとそれからの利益をより正確に予測します。 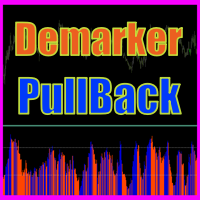
Demarker pullback system - is the manual trading system for choppy markets. It show 2 colored histogram. When histogram is blue - market is quite bullish, when histogram ir orange - market is more bearish. Up arrow is plotted when histogram is in oversold zone but blue color. Down arrow is plotted when histogram is in overbought zone but orange color. These patterns shows false breakout and possible soon reverse(price is overbought but shows bearish signs and price is oversold but shows bullis

Normal Parabolic SAR with label of long or short state. Tells also "Parabolic long" and "short". Can be used in multitimeframe layouts together with Swiss HolyGrail indicator or in different timeframes. So, if all the indicators show "long" or "short" you can be sure that the risk of a wrong direction is small. The standard values for Parabolic SAR are 0.02 for step and 0.2 for maximum. You may experiment with changing the maximum to get smother curves. Note that changes in parabolic SAR are la
FREE
Индикатор отображает изменение баланса В правом нижнем углу окна.
Отображаются следующие периоды Сегодня Вчера 3 дня Неделя 10 дней Месяц 3 месяца Полгода Год Все время Есть возможность выставить расчетное время. Удобно пользоваться для расчетов прибыли/убытков с определенного часа.
Будет полезен например ночным скальперам. Данные совпадают с расчетами отчета в терминалее.
FREE

ボラティリティ アナライザーはモメンタム インジケーターであり、タイトな取引範囲での値固め後に価格が大きく上昇する傾向を利用します。このインジケーターは、スクイーズが発火したときの動きの予想される方向を示すために、運動量オシレーターも使用します。このヒストグラムはゼロ ラインの周りで振動し、ゼロ ラインより上のモメンタムの増加はロングを購入する機会を示し、ゼロ ラインを下回るモメンタムはショートの機会を示す可能性があります。
期間限定オファー : インジケーターは、わずか 50 $ で無期限でご利用いただけます。 ( 元の価格 125$ )
主な機能 横向きトレンド検出器。 低揮発性検出器。 強気の高値と弱気の高値のボラティリティ検出器。 すべての時間枠とすべてのペアで作業します。 ポップアップ アラートとプッシュ通知アラートを提供します。
コンタクト 質問がある場合、またはサポートが必要な場合は、プライベート メッセージでご連絡ください。
警告 すべてのインジケーターとツールは、公式のメタトレーダー ストア (MQL5 マーケット) からのみ入手できます。
プレミア

About the indicator: DALA Forecast is a universal tool for predicting the dynamics of time series of any nature. For prediction, modified methods of nonlinear dynamics analysis are used, on the basis of which a predictive model is built using machine learning methods. To get the trial version of the indicator, you can contact me in private messages.
How to use the indicator: Apply the indicator to your chosen financial instrument or indicator with the settings you need. The prediction will be
FREE

The Roll the Field indicator displays signals in a simple and accessible way in two colors (when to buy and when to sell is determined by changing the color). Knowing the entry point of each currency is very important for every forex trader. The intelligent algorithm of the indicator accurately determines the trend, filters out market noise and generates entry signals.

Point discussion is a fundamental technical indicator - an algorithm that allows you to obtain data on future prices using quotes data for a certain period of time specified in the indicator settings. The technical analysis indicator Point discussion is based on a special formula. It is with its help that the calculation takes place. The indicator is well suited for determining a reversal or a large sharp jerk to one side, thanks to it you will know when this happens, it will notify you by the a

the fundamental technical indicator Informative Trend, which allows you to assess the current market situation in order to enter the market of the selected currency pair in a trend and with minimal risk. It basically uses the process of identifying the rate of change in price growth and allows you to find entry and exit points from the market.
The indicator was created on the basis of the original indicators for searching for extreme points and is well suited for determining a reversal or a la

One of the main definitions for monitoring the currency market is a trend, which is why the Megan indicator was created in order to display the trend in a visual form. Forex indicator Megan is a real trading strategy with which you can achieve the desired results. As soon as the indicator is set, the main indicators will immediately begin to be recalculated at the price of the traded pair, based on the postulates of technical analysis. In addition, when potential entry points are detected, visua
Everything is simple. The usual Information indicator.
Shows on the chart: Current spread, buy swap, sell swap, time to close the candle, broker time.
The indicator can be placed at the top right or at the bottom right of the chart.
Most often, the spread is called the difference between the sale and purchase price.
Swap is the cost of transferring a position to the next day.

The movement exhaustion is a color rule that helps indicate when the movement will revert its direction. The darker the color, the greater the probability to revert. The indicator is based on the price statistic. Works on every timeframe, every instrument. Five color options: 0. Natural movement. (Gray) 1 - 4. Movement exhaustion (Yellow to maroon) The trader can use it as reversal or exhaustion signal. In a trend following trade it can be used as an exhaustion signal, indicating the movement ca

Early WPR divergence - is the manual system to define trend reverse. Green histogram shows main trend, Orange one - shows "short"/local trend. System is looking for clear divergence between both trends and pick up position(plot buy/sell arrows). When main trend is up, but local trend reverses to bearish trend and get's big power - sell arrow is plotted; When main trend is down, but local trend reverses to bullish trend and get's big power - buy arrow is plotted; Main inputs are : mediumTrendPe
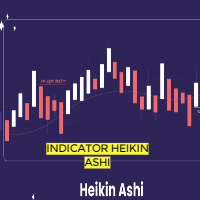
In this indicator, Heiken Ashi candles are calculated with the most optimal method. You can also customize the results by adjusting the amount of period and method input. But the most important advantage of this indicator is the adjustment of the time frame value. You can use this to calculate the Heiken Ashi chandels to See in time frames with lottery in the lower time chart. In this case, you get the best signal to buy or sell using two or more Heiken Ashi indicators with different timeframes
FREE

Precision Trading with the Inside Bar Pro Indicator for MT5 The Inside Bar Pro indicator by @Billyenaire is a powerful tool designed for traders who rely on clean, price-action-based setups. It automatically detects inside bar formations—candlestick patterns where the current candle is completely contained within the high and low of the previous candle. Key Features: Automatically identifies inside bars in real-time Highlights inside bars directly on the chart using customizable candle colors W
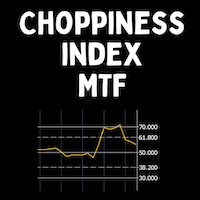
The Choppiness Index was created by Australian commodity trader E.W. Dreiss. It is designed to determine if the market is choppy (trading sideways) or not choppy (trading within a trend in either direction). A basic understanding of the indicator would be; higher values equal more choppiness, while lower values indicate directional trending. The values operate between 0 and 100. The closer the value is to 100, the higher the choppiness (sideways movement) levels. The closer the value is to 0,

Meet the new generation ichimoku cloud. You can develop hundreds of strategies on it. Or you can open a trade directly by looking at whether it is above or below the cloud.
Now it is much easier to know the trend...
Once you get used to this cloud, you won't be able to look at the graphics without it.
The calculation logic is completely different and you will experience the privilege of looking at the market from a different perspective.
By looking at the chart, set the appropriate paramete

Live broadcast of the indicator on YouTube. Please click on the link below for more credibility. There are also videos of the indicator that you can watch. Note that the broadcast is late, do not rely on it. Only a review of the indicator is only a review of the indicator’s accuracy, which does not lose almost and the profit rate reaches 95%. I will work with great accuracy on the CRASH coin 1000 INDICES
マーケットステップスは、Gannの時間と価格の相関関係に基づいて設計・構築され、プライスアクション特有のルールによって最適化されたFXマーケット用のインジケーターです。マーケットオーダーフローの概念を利用して、注文が集中する可能性のある価格帯を予測します。
インディケータ・レベルは、それ自体を取引に使用することも、他のストラテジーやインディケータの間違ったシグナルをフィルタリングするための組み合わせとして使用することもできます。すべてのトレーダーは、マルチタイムフレーム(TF)ゾーンと値動きの可能性をチャート上にまとめるために、このような強力なツールを必要としています。テスターモードでは、そのレベルがチャート上でどのように価格を支配しているかを試すことができます。
インジケータの利点
チャートに2つの異なるゾーンを表示し、異なるTFに対してトレンドとレンジ相場を指定することができます。 プライスアクショントレーダーは、異なるTF/プライスゾーンでのオーダーフローを確認したり、FTR(Fail To Return)/FTC(Fail To Continue)を確認するために使用す
次世代の自動化された需要と供給のゾーン。どのチャートでも機能する新しい革新的なアルゴリズム。すべてのゾーンは、市場の価格行動に従って動的に作成されています。
2種類のアラート --> 1) 価格がゾーンに達したとき 2) 新しいゾーンが形成されたとき
もう 1 つの役に立たない指標はありません。実績のある完全な取引戦略を手に入れることができます。
新機能:
価格が需給ゾーンに達したときにアラートを出す
新しい需給ゾーンが作成されたときにアラートを発します
プッシュ通知アラート
ピップ単位のゾーン幅ラベル
MTF のもう 1 つのタイムフレーム。したがって、現在より 2 時間足高いのではなく、現在より 3 時間足し上に見えるようになります。
アラート/ゾーン/MTF 機能を有効/無効にするボタン
あなたが得る利点:
取引から感情を取り除きます。
取引エントリをオブジェクト化します。
確率の高いセットアップで利益を上げましょう。
描画ゾーンから時間を節約します。
DESCRIPTION
The EasyFollowerTrader-Bot3-DayTrade indicator only trades with the trend. Thus, the indicator will, at first, observe the trend of three averages synchronous with the selected time-frame. Then the indicator observes the trend of the daily chart. When these two charts are moving in the same direction, we have the highest probability of winnings. We will call this region the region of high probability of gain.
In the region of high probability of gain, the indicator will indicate t

この指標は、YouTube チャンネル「The Secret Mindset」のビデオ「A Reliable Scalping Strategy I Discovered After 1 Month of Price Action Trading」で提案された戦略に基づいています。 信号をフィルタリングするための戦略と条件の完全かつ詳細な説明は、ビデオで公開されています。 * YouTube チャンネルの作成者はこのインジケーターの開発とは関係ありません シグナルは他のインジケーターと組み合わせて、各トレーダーの判断によってフィルタリングする必要があります
インジケーター
前のバーの高値/安値範囲内にあるバーは、インサイドバーと呼ばれます。 インジケーターはオプションでこれらのバーをペイントできます 2 つの連続するインサイドバーはチャネルを作成し、多くの場合サポートレベルまたはレジスタンスレベルとしても機能します
信号
インジケーターは、2 つの異なるモードで信号矢印を表示できます。 FAST: バーが閉じるまでシグナルが再描画されるため、トレーダーはシグナル バーがすでに閉じた
FREE
DESCRIPTION
The EasyFollowerTrader Bot4 DayTrade indicator always trades with the trend. Thus, the indicator, at first, observes the trend of the average of the highs and lows of the candles of the selected time-frame. Then see if this trend is in line with the trend of the daily chart to operate in favor of the major trend. When these two charts are moving in the same direction, we have the highest probability of winnings. We will call this region the region of high probability of gain.
In t
DESCRIÇÃO O indicador EasyFollowerTrader-Bot2-DayTrade opera apenas a favor da tendência. Assim, o indicador, em primeiro momento, observar a tendência de três médias síncrona com o time-frame selecionado. Em seguida, o indicador observar a tendência do gráfico diário. Quando estes dois gráficos estiverem se movimentando na mesma direção, teremos a maior probabilidade de ganhos. Chamaremos esta região como região de alta probabilidade de ganho. Na região de alta probabilidade de ganho, o ind
Simple ATR Modern 市場のボラティリティをより明確に追跡するためのシンプルなツールで、デイトレードやスイングトレードに最適です。 取引を開始する際や初心者にとって最適なインジケーターです。
ビジュアルインジケーターの色: ATR Daily - 青 Volatility Vision インジケーターと組み合わせて分析を強化しましょう。 市場の状況の変動を正確に測定し、デイトレードやスイングトレードの意思決定に不可欠です。 基本的な14日間(設定可能)の単純移動平均の真の範囲インジケーターを利用して正確性を確保します。 取引システムにおける取引開始または終了戦略の実施に理想的で。 ATR インジケーターが他より優れている理由: 簡単に使用できる: ATR インジケーターは設定が簡単で、初心者のトレーダーでも理解しやすいです。 汎用性: デイトレードやスイングトレードのどちらにも適しており、さまざまな取引戦略に柔軟に対応できます。 信頼性: ATR は正確な市場ボラティリティデータを提供し、トレーダーがより賢明な判断を下すのに役立ちます。 カスタマイズ可能: 移動平均期間
Colors generated according to the Height and Depth parameter.
The analysis is carried out following the direction of the price and volume traded if the traded value exceeds the calculation base the system changes the color to green, informing you that the price direction is strong to buy, if the traded value is less than the calculation base the system changes to red, indicating that the price is strong for sale.
FREE
Trend Support Resistance is a fairly simple indicator that provides traders with confirmed immediate support and resistance in whatever timeframe you monitor. It's good for short-term and long-term order blocks. With the default settings, the indicator identifies critical support and resistance areas. Bearish Order Blocks are around the OrangeRed areas while Bullish Order Blocks almost always form near the LawnGreen areas. We have also added a Multi-timeframe feature that can be helpful to allow

This indicator uses a different approach from the previous version to get it's trendlines. This method is derived from Orchard Forex, and the process of making the indicator is demonstrated in there video https://www.youtube.com/watch?v=mEaiurw56wY&t=1425s .
The basic idea behind this indicator is it draws a tangent line on the highest levels and lowest levels of the bars used for calculation, while ensuring that the lines don't intersect with the bars in review (alittle confusing? I know
FREE
TransitGhost Signal indicator, this is one of my best forex trading strategy. The strategy is based on the simple moving average cross, 5 SMA AND 200 SMA of which take a longer time to cross. Whenever the is a cross between the 5 SMA and 200 SMA a signal will be given, when the 5 SMA cross the 200 SMA to the upside ,a buying arrow will appear on chart, and push notification(alert) "Buy now, use proper risk management" will be sent on both the MT5 PC and mobile app, and when the 5 SMA cross the 2
FREE
Indicator for boom and crush which can be used to catcher spikes or ride a whole wave of spikes. If a signal is found it can send Alerts , note that this feature can be disabled. to get most out of this strategy you must not enter with just the signal alone but u can pair this with the "ichimuko" indicator put in a second window so as to define good turning points more of this can be seen in the screenshot provided. For Boom the Ichimuko must be below or has touched the 20 level For Crash the Ic

The Average Daily Range (ADR) is an indicator that shows how far a currency pair can move in a day. Automatically displays the upper and lower ADR levels. Automatically calculates the percentage and distance of ADR achieved by the currency pair for the day. Notifies when the price reaches the ADR level. Changes the color and thickness of the ADR line when the price reaches it.

A version based on David Waves' description in his book 'Trade About to Happen' of his adaptation of the Wyckoff wave chart. The indicator directionally accumulates volume, adding to each brick or candle close, with color indication for up and down. it can be used it with tick or real volume, it also changes color when the accumulated value of the previous wave is exceeded, being the trade signal. Yellow color is used for doji candlestick, it will continue with accumulation without zero the sum

Indicator is based on Market Maker Strategy. NO REPAINT.
MM's are traders and their objective is to make money. This includes strategies to trade against retails traders. The major difference between them and other traders is that they have the ability, through access to massive volumes, to move price at their will. So to make money, they aim to buy at a lower price and then sell at a higher price. They achieve this by: 1. Inducing traders to take positions. This is achieved by using a

This is a regression tree indicator for MT4/MT5.
This indicator classificate nodes on the time period so that the deviation becomes smaller,
and displays regression line and channel for each node.
It's free!
Attached CartDemo.ex4 and CartDemo.ex5 is a Demo version and has the following limitations:
Can't use HighSpeed method (default method is RandomForest)
Maximum number of bars is 260 (increase from 200)
There is no expiration date and can be started many times, but it stops after an hour.
FREE
Double Correlation indicator (free) plots two windowed correlations in a separate window. the size of window is taken as input before the two symbols to correlate to. Two symbols are taken as an input parameters as well as period length. and the two correlations are computed with the currently shown symbol ex: input GBPJPY and AUDNZD. current symbol EURUSD then the following will be computed corr(EURUSD,GBPJPY) and corr(EURUSD,AUDNZD) The indicator can be useful to run a multi-symbol pair trad
FREE

MA Slope is a simple indicator that measures the slope of a specific Moving Average. We usually say that the price is in an uptrend when it is above the moving average, or it is in a downtrend when it is below the moving average. However, this information is inadequate since most of the time the market is in range. During range-bound markets, price moves back and forth around the Moving Average giving a lot of false signals. MA Slope helps identify and validate trends as it directly measures t
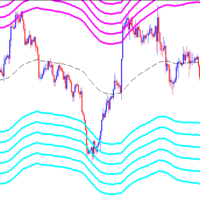
This indicator belongs to the family of channel indicators. These channel indicator was created based on the principle that the market will always trade in a swinging like pattern. The swinging like pattern is caused by the existence of both the bulls and bears in a market. This causes a market to trade in a dynamic channel. it is designed to help the buyer to identify the levels at which the bulls are buying and the bear are selling. The bulls are buying when the Market is cheap and the bears a
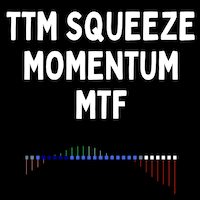
This indicator is based on John Carter's "TTM Squeeze" volatility indicator, as discussed in his book "Mastering the Trade". In this version, this indicator has some improved features: Multiple timeframes (MTF) is supported. You can analyze multiple timeframes in the same window. Histogram is plotted in a different way to help reduce noise. 3 customizable thresholds to help adjust when the dots change color. The dot color indicates the market volatility: d ark blue: very low volatility blue: low

この情報インジケーターは、アカウントの現在の状況を常に把握したい人にとって役立ちます。
VERSION MT 4 - More useful indicators このインジケーターには、ポイント、パーセンテージ、通貨での利益、現在のペアのスプレッド、現在の時間枠でバーが閉じるまでの時間などのデータが表示されます。 チャート上に情報線を配置するには、いくつかのオプションがあります。 価格の右側 (価格の後ろにあります)。 コメントとして (グラフの左上隅に); 画面の選択した隅。 情報区切り記号を選択することもできます。 | /
\ # このインジケーターは使いやすく、非常に有益です。設定で不要な情報項目を無効にすることも可能です。 設定 外観の種類 - 情報行の表示タイプ。次の 3 つのオプションがあります。 価格に従ってください - 価格に従う。 コメントとして - コメントとして; 画面の選択した隅に - 画面の選択した隅にあります。 添付用グラフコーナー - 表示タイプを選択した場合 画面の選択されたコーナーでは、この項目を使用して
FREE
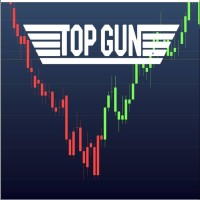
Colors generated according to trading volume and market direction.
The analysis is carried out following the direction of the price and volume traded if the traded value exceeds the calculation base the system changes the color to green, informing you that the price direction is strong to buy, if the traded value is less than the calculation base the system changes to red, indicating that the price is strong for sale.
FREE
It is an indicator used to identify support and resistance points from the daily VWAP and you can use it to check the best entry and exit points.
The calculated value of the channel distance can be calculated in several ways:
- Manual Defining the value to be projected to calculate the distance of the channels.
- Automatic Select the timeframe to be used. Regardless of the graphic time that is on the screen, if the parameter is changed to H1(One hour candles), the system will calc

66% discount only for the first 5 buyers (4 left), main price: 300 $ Show the signal as a line graph Prediction of 10 future candles and advanced display Prediction of individual candles graphically Can be used in the gold symbol Can be used in 15 minutes time frame Can be used only in gold symbol and only 15 minutes time frame
How the indicator works:
Using complex mathematical calculations, it predicts the future 10 candles. The predictions of this indicator are based on price. Therefore,
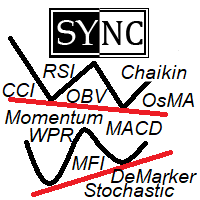
Divergence and Convergence are important harbingers of reversals in stock markets.
The Divergence Sync indicator is designed to automatically search for divergences on a large number of indicators with different parameters.
The search for divergences is carried out on these indicators: (CCI, CHO, DeMarker, MACD, MFI, Momentum, OBV, OsMA, RSI, Stochastic, WPR, Awesome Oscillator ).
To search for divergences, you can use one technical indicator or search simultaneously on any number of indicat

Theory VWAP is a volume-weighted moving average, bringing greater relevance to prices. The VWAP base calculation follows the classic formula described in Investopedia ( https://www.investopedia.com/terms/v/vwap.asp ). VWAP = sum(typical price[i]*volume[i]) / sum(volume[i])
Functionalities
Orion Intraday VWAP innovates by allowing the user to choose between the conventional Daily, Weekly and Monthly periods, also having the option of calculating the Intraday indicator, as used in other platform

The Danko Trend Color indicator is actually a candle coloring to bring practicality, ease and information to your charts.
Danko Trend Color combines PRICE AND VOLUME indicators to define the prevailing trend, so the colors are: Blue (indicates an uptrend)
Orange (indicates a downtrend)
White (indicates undefined trend)
I don't like to promise anything with my indicators, I ask you to download, test it for free (for use in backtesting) and see if the indicator can, in some way, help your oper
# 33% off - limited time only # ChartSync Pro MT5 is an indicator, designed for the MetaTrader 5 trading terminals. It enables the trader to perform better multi-timeframe technical analysis, by synchronizing symbols and objects into virtually unlimited charts. Built by traders for traders! Telegram Premium Support - Dd you purchase the Chart Sync indicator and need a bit of help? Send us a screenshot with your purchase and your Telegram ID so we can add you to our premium support Telegram g

Trend indicator, a revolutionary unique solution for trend trading and filtering with all important trend features built into one tool! This is a 100% non-repainting multi-timeframe and multi-currency indicator that can be used on all currency pairs. HandleTrend is an effective trend following indicator that gives trend signals in the form of arrows on the chart.

Initiated in 1995 by the physicist and technical analyst Paul Levine, PhD, and subsequently developed by Andrew Coles, PhD, and David Hawkins in a series of articles and the book MIDAS Technical Analysis: A VWAP Approach to Trading and Investing in Today's Markets.Latterly, several important contributions to the project, including new MIDAS curves and indicators, have been made by Bob English, many of them published in the book.
FREE

Fundamentação teórica A VWAP é uma média móvel ajustada pelo volume, ou seja, o peso de cada preço corresponde ao volume de ações negociadas no período, dando mais importância ao período em que se tenha mais negociações. A Orion Vwap Bands permite que o usuário use plote 8 bandas que podem ser utilizadas como suportes e resistências para o preço. Cada banda é calculada a partir da Vwap Tradicional:
Ex.: Se escolhermos o valor 0.25 para a plotagem da Banda 1, pega-se o preço da Vwap e acrescent
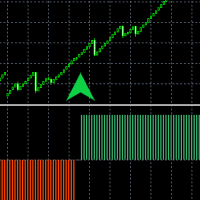
Boom and Crash Buy and Sell Trend. Non-repaint. Can be used on all timeframes 1 minute for scalpers. 5 minute to monthly timeframe for swing trading. works on all boom and crash pairs Crash300, Crash500, Crash1000. Boom300, Boom500, Boom1000. Green histogram colour means the trend is up(bullish) Buy signal. Dark orange histogram colour means the trend is down(bearish) Sell signal.
- 50% off - Telegram group : https://t.me/+5RIceImV_OJmNDA0 MT4 version : https://www.mql5.com/en/market/product/84526?source=Unknown%3Ahttps%3A%2F%2Fwww.mql5.com%2Fen%2Fmarket%2Fmy
Master Pullback is a complete system that gives unique trading opportunities and a clear indication of the market: trend, signals as well as stop loss and take profit levels. This system has been designed to be as simple as possible and detects extreme overbought and oversold zones, support and resistance levels, as
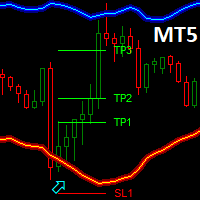
Dark Bands is an Indicator for intraday trading. This Indicator is based on Counter Trend strategy but use also Volatility. We can enter in good price with this Indicator, in order to follow the inversions on the current instrument.
Key benefits
Easily visible take profit/stop loss lines Reliable bands lines with futuristic colors, and Intuitive directional arrows Useful statistics , which indicate the win rate of the signals Plus Package available, leave a feedback to receive it for fr
FREE

DESCRIPTION The EasyFollowerTrader Bot1 DayTrade indicator operates only in favor of the majority trend. Thus, the indicator, at first, observe the trend of the daily chart to operate in its favor. Then the indicator watch the current chart trend. When these two charts are moving in the same direction, we have the highest probability of winnings. We will call this region the region of high probability of gain. In the region of high probability of gain, the indicator will indicate the best ent

ヒートマップ - 通貨相対強度マトリックス Heat Map FXは、FX市場の主要8通貨(EUR、USD、AUD、GBP、NZD、CAD、CHF、JPY)の強弱をリアルタイムでスキャンするために設計された、直感的で強力なインジケーターです。チャートに統合されたダイナミックなヒートマップにより、すべての通貨ペアの騰落率を監視し、通貨ごとの平均強度を算出することで、強度の乖離による最適な取引機会を即座に特定することができます。
設定パラメータガイド update seconds: インジケーターがテーブルの数値を更新する頻度(秒単位)。 variation of the last hours: 価格の騰落率を計算するために使用される過去の時間数。 Symbol Prefix: 口座で必要な場合にブローカーが要求するシンボル名のプレフィックス(例: 「demo.」)。 Symbol Suffix: ブローカーによって適用されるシンボル名のサフィックス(例: 「.ecn」または「m」)。 positive variation color: 騰落率がプラスの通貨ペアの強調色。 negati

あなたの取引戦略の可能性をInventory Retracement Bar MT5で引き出しましょう。これはMetaTrader 5専用に設計された革新的なインジケーターです。この強力なツールは、現在のトレンドに対して45%以上の戻りを示すローソク足パターンを特定し、トレーダーが市場への最適な再エントリーポイントを見つけるのを助けます。 Inventory Retracement Bar MT5は、市場の勢いが再開される可能性が高いときに明確な視覚信号を提供することで、あなたの取引判断を向上させます。これは初心者と経験豊富なトレーダーの両方にとって貴重な資産です。forex、インデックス、商品、暗号通貨に最適なこのインジケーターは、遅延信号のリスクなしに戻りを利用することを可能にします。 MQL製品のインストールガイド | MT4/MT5で購入したMQL製品の更新 | 一般的なトラブルシューティングガイド | インジケーター設定 / ガイド 主な特徴 バッファ統合: インジケーターの値をアクセス可能なバッファとして公開し、Expert Advisorが自動信号ベースの取引を利用できる

Angle of Moving Average MT5 で取引の意思決定を向上させましょう。この革新的なインジケーターは、移動平均の傾きを定量化し、トレンドの方向と勢いについて明確な洞察を提供します。指定されたバー数にわたる移動平均の角度傾斜を測定する原理に基づくこのツールは、2010年頃のトレーディングコミュニティでの概念化以来、テクニカル分析の柱となっています。Forex Factoryなどのフォーラムで広く議論され、市場ダイナミクスの直接的な視覚化で称賛されているAngle of Moving Averageは、複雑なオシレーターに代わる堅牢な代替品として、過剰に複雑な公式のノイズなしに強気または弱気のバイアスを直接測定します。 トレーダーは、Angle of Moving Averageを、トレンドの強さ、潜在的な反転、最適なエントリー/エグジットポイントを直感的なヒストグラム表示—上昇モメンタムは緑、下落シフトは赤—で示す卓越した能力で高く評価しています。現在の移動平均とNバー前の値との角度を計算することで、市場が加速している(大きなヒストグラム)か平坦化している(小さな

The Active Trend indicator helps to analyze the market on the selected time interval. It defines the mainstream. Used in trading. You can use so basic to determine the trend. The indicator works well on both short and longer trend sections. In flat it is recommended to use filters of your choice. It can accompany the position with a stop, it is recommended to set the stop at a fixed distance from the point formed by the indicator. The simplest way to use the indicator is to open a trade in the

An arrow technical indicator without redrawing Signal Breakthrough in the Forex market is able to give tips with the least errors.
Every rise and fall is reflected in your emotional state: hope is replaced by fear, and when it passes, hope appears again. The market uses your fear to prevent you from taking advantage of a strong position. At such moments you are most vulnerable. Currency pairs never rise or fall in a straight line. Their ups and downs are interspersed with rollbacks and reversa

** All Symbols x All Time frames scan just by pressing scanner button ** *** Contact me to send you instruction and add you in "Harmonic Scanner group" for sharing or seeing experiences with other users. - New Update: 2026/10 + FREE Trading Utility MT5 Introduction Harmonic Patterns are best used to predict turning point. Harmonic Patterns give you high win rate and high opportunities for trade in during one day. This indicator detects the best and successful patterns based on Harmonic Tradin
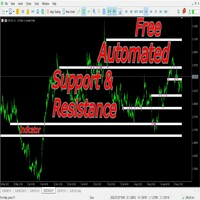
This indicators automatically draws the support and resistances levels (key levels) for you once you've dropped it on a chart. It reduces the hustle of drawing and redrawing these levels every time you analyse prices on a chart. With it, all you have to do is drop it on a chart, adjust the settings to your liking and let the indicator do the rest.
But wait, it gets better; the indicator is absolutely free! For more information: https://youtu.be/rTxbPOBu3nY For more free stuff visit: https:
FREE
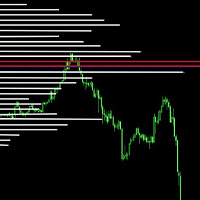
It makes it easier to see where there have been consolidation zones for previous prices and allows you to highlight the histogram where there is the biggest consolidation zone.
Input parameters Intervalo de preço Is the price between the histograms
Periodo Number of candle sticks to be analyzed
Porcentagem Highlights the histogram where there is minimal consolidation in relation to the analyzed period
FREE

Investment Castle Combined — Three Indicators, One Clear View
The Combined indicator merges three of our tools — including the multi-timeframe Bands indicator — into a single, clear multi-timeframe view, so you can read trend, structure and momentum without cluttering your chart. Exclusive to the MQL5 Market.
What it does for you Three indicators in one: a unified multi-timeframe reading on a single chart. Multi-timeframe by design: see what matters across timeframes at a glance. Cleaner chart
FREE

Trend driver bars is the manual trading system, which defines current trend continue or it's pull-back/reverse. "Driver" bars - are price action patterns that has powerfull affect on market, defining it's near future direction. Generally, driver bars represents trend "skeleton" and often anticipates new market impulse. System plots arrows when market shows 3 pattenrs in a row(most powerfull combo-pattern), and makes fast scalping of incomming movement. Loss positions closes by common profit. Lot

The indicator calculates the correlation coefficient of 2 instruments, shifts the chart of the 2nd instrument relative to the 1st and displays the charts of both instruments on the current chart. The maximum positive and negative deltas and the current delta as a percentage of the maximum are calculated. It is possible for signals to set a delta for entry and exit with displaying the direction of entry into trade for each instrument. The space between the charts is also filled with different col
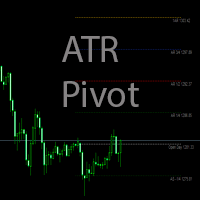
The indicator calculates intraday levels based on the average daily price range, builds support and resistance levels that may be reversal.
Parameters Period ATR - period of the ATR indicator Shift time - time offset for the opening of the day Color opening of day - color of the opening line of the day Color 1AR, -1AS - line color 1AR, -1AS Color AR 1/2, AS -1/2 - line color AR 1/2, AS Color AR 1/4, AS -1/4 - line color AR 1/4, AS -1/4 Color AR 3/4, AS -3/4 - line color AR 3/4, AS -3/4 Color
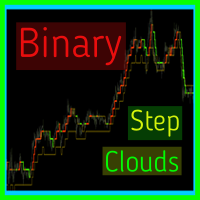
Binary step clouds - is the complete trading system with enter and exit points. System is based on double smoothed exponential step moving and volume weighted simple step moving.Generally each movings define trend direction and places when trend is in active phase. Signals plots when both movings approache to active trend phase and market speed is high. Main Indicator's Features Signals are not repaint,non-late or disappear(exept cases when system recalculates all history datas,refreshing main
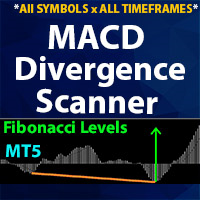
** All Symbols x All Time frames scan just by pressing scanner button ** *** Contact me to send you instruction and add you in "Divergence group" for sharing or seeing experiences with other users. + FREE Trading Utility MT5 Introduction MACD divergence is a main technique used to determine trend reversing when it’s time to sell or buy because prices are likely to drop or pick in the charts. The MACD Divergence indicator can help you locate the top and bottom of the market. This indicator fin
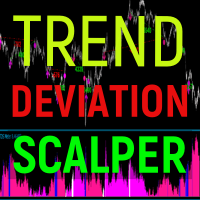
Trend deviation scalper - is the manual system to scalp choppy market places. Indicator defines bull/bear trend and it's force. Inside exact trend system also defines "weak" places, when trend is ready to reverse. So as a rule, system plots a sell arrow when bull trend becomes weak and possibly reverses to bear trend. For buy arrow is opposite : arrow is plotted on bear weak trend. Such arrangement allows you to get a favorable price and stand up market noise. Loss arrows are closing by common p
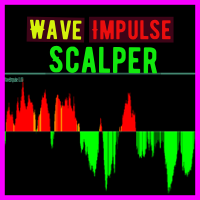
Wave Impulse OmegaScalper - is the manual system for scalping. In many cases Indicator "eats" almost all possible trend wave. System defines up price wave and down price wave. Inside the exact wave - system defines true trend movement and choppy market. Indicator plots signals while market is trending, powerfull and has quiet good volatility. This is complete system with enter and exit points. Main Indicator's Features Signals are not repaint,non-late or disappear(exept cases when system recalcu
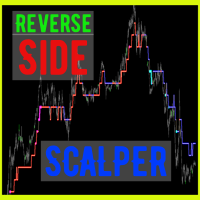
Reverse side scalper is the manual trading system, that works on choppy(anti-trend) market. As a rule markets are on 80% choppy and only 20% is trend phase. System is based on custom step Moving and RSI and reverse pattern. System defines up movement, down movement, trend / choppy phases. Indicator plots Buy signal arrow when current direction is down and phase is trend, Sell signal arrow is plotted when currently is up movement and phase is trend. As a rule it allows to "catch" local maximum/mi
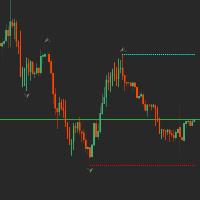
The fractal indicator shows the latest support and resistance levels. If the price breaks through the level and is fixed, the indicator draws a rhombus of yellow or crimson color signaling a possible continuation of the movement towards the breakdown.
Indicator Settings:
- BarCount: sets the minimum number of bars required to build a fractal.
It is better to use the indicator in conjunction with other indicators.
FREE
MetaTraderマーケットは、他に類のない自動売買ロボットやテクニカル指標の販売場所です。
MQL5.community ユーザーメモを読んで、取引シグナルのコピー、フリーランサーによるカスタムアプリの開発、支払いシステムを経由した自動支払い、MQL5Cloud Networkなど、当社がトレーダーに対して提供するユニークなサービスについて詳しくご覧ください。

取引の機会を逃しています。
- 無料取引アプリ
- 8千を超えるシグナルをコピー
- 金融ニュースで金融マーケットを探索