 MetaTrader 5
 エキスパート
 インディケータ
 ライブラリ
 ユーティリティ
 ウィジェット
 ルール
YouTubeにあるマーケットチュートリアルビデオをご覧ください
ロボットや指標を購入する
仮想ホスティングで
EAを実行
EAを実行
ロボットや指標を購入前にテストする
マーケットで収入を得る
販売のためにプロダクトをプレゼンテーションする方法
MetaTrader 5のための新しいテクニカル指標 - 185
 テクニカル指標からのシグナルは、株式および外国為替市場での取引の開始と終了に重要な役割を果たします。指標の本質は、将来の価格変動を予測することを目的とした金融銘柄価格の数学的変換です。
テクニカル指標をテストして、市場の動きとそれからの利益をより正確に予測します。
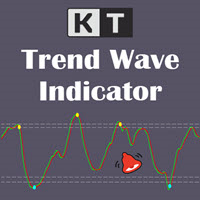
市場の状況とともに Trend Wave の交差を確認 KT Trend Wave は価格の動きを、メインのウェーブと平滑化されたシグナルラインを持つ見やすいオシレーターに変換します。価格チャートの下にある独立したウィンドウに表示されるため、ローソク足を隠さずにウェーブ、基準領域、交差マーカーを確認できます。 ライン、領域、マーカーを組み合わせて読む 黄緑色のメインライン: より速く反応するトレンドウェーブを表示します。 赤色のシグナルライン: ウェーブを平滑化し、方向の変化を比較しやすくします。 水色の上向きマーカー: 下側の基準領域でメインラインがシグナルラインを上抜けた強気の交差を示します。 黄色の下向きマーカー: 上側の基準領域でメインラインがシグナルラインを下抜けた弱気の交差を示します。 チャートを複雑にせず反応を調整 Wave Period はメインウェーブの価格への反応を調整し、Avg. Period はウェーブに適用する平滑化を調整します。長い技術設定の一覧を使わずに、反応性と滑らかさのバランスを選べます。 確定したシグナルの通知方法を選択 新しいバーが始まると、通知ロ
KT Aroonオシレーターは、Tushar Chande氏が1995年に開発した元のAroonオシレーターを改良したバージョンです。現在の高値および安値間の時間間隔を測定し、その情報をもとに市場トレンドの方向と強さを計算します。 このインジケーターは、上昇トレンド中には連続して新高値が形成され、下降トレンド中には新安値が形成されるという概念に基づいています。 買いシグナル: Aroon UpラインがAroon Downラインを上抜けたとき。
売りシグナル: Aroon DownラインがAroon Upラインを上抜けたとき。
特徴
チャート上にAroonシグナルを示す上下の矢印を表示。 市場のトレンドを効率的に表示。 シンプルで視認性が高く、チャートが煩雑になりません。 すべてのMetaTraderアラートに対応。
入力項目 期間: Aroon UpおよびDownラインの計算に使用される期間。 上下矢印の表示: Trueに設定すると、各新しいシグナルでチャートに矢印を表示します。 アラート設定: ポップアップ、サウンド、モバイル通知、メールなどの各種アラートを設定可能。
Ar
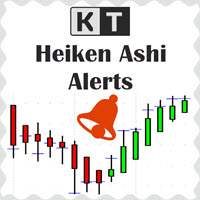
KT Heiken Ashi Alert は、標準的な平均足(Heiken Ashi)ローソク足に基づいて、買い・売りの矢印を表示し、アラートを生成するインジケーターです。Heiken Ashi をトレード戦略に取り入れたいトレーダーにとって、必須のツールです。 平均足が弱気から強気に変わったときに買い矢印が表示されます。 平均足が強気から弱気に変わったときに売り矢印が表示されます。 モバイル通知、メール通知、サウンド、ポップアップアラートを搭載。
Heiken Ashiとは? 日本語で「Heiken Ashi(平均足)」は「平均バー」を意味し、ローソク足チャートをより見やすくし、トレンドの把握をしやすくします。トレーダーは Heiken Ashi をエントリー・エグジットの両方に活用できます。色の変化は、相場の方向転換を示すことがよくあります。
覚えておきたいポイント
Heiken Ashi Alert を単体で使うのではなく、他のインジケーターと組み合わせて使用することで精度が向上します。 トレンド転換は、上下ヒゲのある小さなローソク足から始まることが多いです。 上ヒゲのない赤

KT Pip Counter は、リアルタイムで重要な数値を表示するシンプルかつ実用的なインジケーターです。現在の損益やスプレッド、残り時間などを素早く把握できるため、緊張感の高いトレード中でも客観的な判断を下しやすくなり、無駄なストレスを軽減しながら取引戦略を最適化できます。
特徴
現在の損益を通貨・pips・パーセンテージで同時表示。 最新スプレッドを即時に表示。 現在のバーがクローズするまでの残り時間をカウントダウン。 損益状況に応じた色分けで視認性を向上。 テキストの位置とレイアウトは完全にカスタマイズ可能。 CPU 使用率は極めて低く、プラットフォームの動作を妨げません。
入力パラメータ Account P&L: true にすると口座全体の損益を表示し、false なら現在のシンボルのみ表示。 カラーおよびフォントサイズの設定。 Show After Current Bar: true の場合、情報はバー確定後に表示し、false の場合はチャート四隅に固定。 その他の入力項目は直感的で分かりやすい設定です。

KT Pivot Points は、最新の市場データに基づいて、日足・週足・月足のピボットレベルをチャート上に自動で表示します。ピボットポイントは、特にFX市場において、テクニカル分析で広く利用されている指標の一つです。
特徴
価格がピボットレベルに到達した際にアラートを送信します。 各種類のピボットレベルに対して完全なカスタマイズが可能です。 シンプルな表示で、日足・週足・月足のピボットレベルを一目で確認できます。 最小限のCPUリソースを使用し、高速な計算を実現します。 チャート上の他のインジケーターとも互換性があります。
ピボットポイントとは ピボットポイントは、前の取引日の高値、安値、終値の平均から算出されます。 この計算により、将来のサポートおよびレジスタンスレベルを予測でき、価格がこれらのレベル付近でどのように動くかを判断する手助けとなります。 また、価格がピボットポイントの上にあるときは強気傾向、下にあるときは弱気傾向とされるのが一般的です。
ピボットの計算式
ピボットレベルの計算には、前日、週、または月の高値、安値、終値が使用されます。 P = (H +
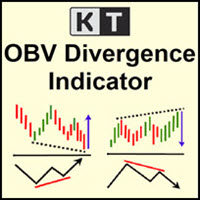
KT OBV Divergence は、価格と OBV(オンバランスボリューム)オシレーターとの間に形成される通常および隠れたダイバージェンスを表示します。
機能
非対称なダイバージェンスは除外され、精度が向上し、チャートの見やすさも保たれます。 トレンドの反転とトレンド継続の両戦略に対応。 エキスパートアドバイザーへの組み込みに完全対応。 エントリーにもエグジットにも使用可能。 すべての MetaTrader アラートに対応。
ダイバージェンスとは何か?
テクニカル分析において、価格が高値を更新している場合、オシレーターも同様に高値を更新すべきです。価格が安値を更新している場合も、オシレーターはそれに追随すべきです。このような通常の関係が崩れたとき、価格とオシレーターが乖離(ダイバージェンス)していると判断されます。 ダイバージェンスには、以下の2つの主要な種類があります: 通常の強気ダイバージェンス: 価格がより低い安値をつけるが、オシレーターはより高い安値をつける場合。 通常の弱気ダイバージェンス: 価格がより高い高値をつけるが、オシレーターはより低い高値をつける場合
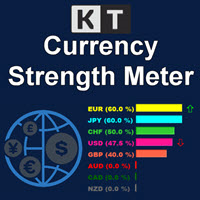
KT Currency Strength Meter は、主要なFX通貨ペアに集約された数学的計算式を適用することで、各通貨の強さと弱さを測定します。 固定された期間内の強気および弱気のローソク足に基づいて通貨の強さが計算されます。その後、アルゴリズムが最も強い通貨と最も弱い通貨をリアルタイムのデータで並べ替え、継続的に順位を更新します。
利点
強い通貨に対して弱い通貨を買うような誤った取引シグナルを除外することで、トレーディング戦略を即座に改善できます。 意図しないヘッジ取引や過剰取引を回避します。 最強通貨に対して最弱通貨を買うといった、リスクの高い逆張り取引を避けられます。 互いに打ち消し合うようなポジションをフィルタリングします。 最新データを用いてリアルタイムで更新されます。 軽量設計でPCのリソースを最小限に抑え、他のインジケーターやEAに影響を与えません。 各通貨に専用カラーが割り当てられており、識別が簡単です。 複雑な設定は不要で、シンプルで直感的な入力パラメータ。
プロのヒント データは現在の時間足から取得されるため、低い時間足での使用は避けてください。データの変
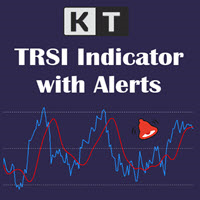
KT TRSI は、RSI(相対力指数)、EMA(指数移動平均)、SMA(単純移動平均)を組み合わせて作られたオシレーターです。従来のRSIと比較して、TRSIはSMAのスムージング効果により、偽のシグナルに対する感度が低くなります。また、MetaTraderのすべてのアラート機能にも対応しています。
シンプルなエントリールール
買い:青いライン(RSI)が赤いライン(TRSI)を上抜けたとき。 売り:青いライン(RSI)が赤いライン(TRSI)を下抜けたとき。
高度なエントリールール 買い:青いライン(RSI)が売られすぎレベルを下回り、その後再び上回り、赤いライン(TRSI)と強気のクロスオーバーが発生したとき。 売り:青いライン(RSI)が買われすぎレベルを上回り、その後再び下回り、赤いライン(TRSI)と弱気のクロスオーバーが発生したとき。
より正確な判断を行うには、TRSIに加えて他のインジケーターや確認シグナルを併用することが重要です。
TRSIの計算式
トリプルEMA = RSIのEMAのEMAのEMA。 TRSI = トリプルEMAのSMAを3バー右にシフトしたも
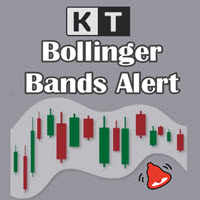
チャート上でボリンジャーバンドへのタッチを監視 KT Bollinger Bands Alert は、上部、中央、下部のボリンジャーバンドを表示し、現在のローソク足が選択したバンドに触れたかを監視します。取引手法に必要なバンドイベントを有効にしておけば、ほかの市場に集中している間も重要な瞬間を通知で確認できます。 3本のバンド価格を常に確認 オプションの価格タグは、上部、中央、下部バンドの現在値に合わせてチャート上を移動します。各バンドの色も個別に設定できるため、外側の境界と中央の基準線を自分のレイアウト内で見分けやすくできます。 計算方法とアラートの流れを設定 ボリンジャー設定: 期間、偏差、シフト、適用価格を調整できます。 チャート履歴: バンドを表示する過去のバー数を選択できます。 バンド選択: 上部、中央、下部バンドのアラートを個別に有効または無効にできます。 アラート間隔: タッチ通知の繰り返しを調整するため、アラート間の最小分数を設定できます。 必要な方法でアラートを受信 選択可能なサウンドファイル、ポップアップ、メール、モバイルプッシュ通知を自由に組み合わせて使用できます
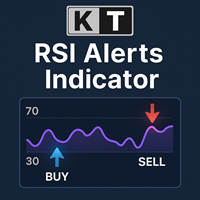
KT RSI Alerts は、RSI(相対力指数)オシレーターをベースとしたカスタムインジケーターで、次の4つのイベントに基づいたシグナルとアラートを提供します。 RSI が買われすぎゾーンに入ったとき。 RSI が買われすぎゾーンから出たとき。 RSI が売られすぎゾーンに入ったとき。 RSI が売られすぎゾーンから出たとき。
特徴 RSI が買われすぎ・売られすぎゾーン内でどのように動くかを分析するトレーダーにとって最適な選択肢です。 軽量に設計されており、パソコンのメモリやリソースをほとんど消費しません。 MetaTrader のすべてのアラート機能に対応しています。
相対力指数(RSI)の歴史 RSI は J・ウェルズ・ワイルダーによって開発され、1978 年に出版された著書『New Concepts in Technical Trading Systems』および同年 6 月号の『Commodities』誌で初めて紹介されました。RSI はモメンタム・オシレーターの一種であり、価格変動のスピードと大きさを測定します。上昇終値と下降終値の比率からモメンタムを計算する仕組み

KT Forex Volumeは、通貨ペアの買いと売りのボリュームをカラーのヒストグラムで表示します。ボリュームとは、資産の買い取引と売り取引の総量を指します。 FX市場では: 買いのボリュームが売りのボリュームを上回ると、通貨ペアの価格は上昇する傾向があります。 売りのボリュームが買いのボリュームを上回ると、通貨ペアの価格は下落する傾向があります。
特徴 ティックボリュームのデータを用いてトレードを確認することで、不利な取引を回避できます。 大口トレーダーの流れに沿ったトレードを支援します。 すべてのMetaTraderアラートに対応しています。
ティックボリュームの活用 他の市場と異なり、スポットFX市場は中央集権化されていないため、リテールトレーダーにとって正確な取引ボリュームデータを得るのは困難です。 ベテランのFXトレーダーであるCaspar Marneyは2011年に論文を発表し、ティックボリュームと実際の取引ボリュームとの間に高い相関と精度があると結論付けました。
ヒストグラムの計算式
KT Forex VolumeインジケーターはChaikinオシレーターを基にし
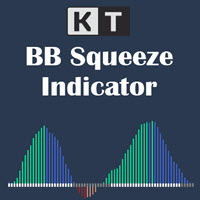
モメンタム拡大の前にボラティリティの収縮を確認 KT BB Squeeze は、ボラティリティの状態とモメンタムの方向を一つの見やすいオシレーターにまとめます。Bollinger Bands と Keltner Channels を比較して市場が収縮中か拡大中かを示し、ヒストグラムでゼロラインを基準にモメンタムの変化を確認できます。 灰色のドット: Bollinger Bands が Keltner Channels の内側にあり、スクイーズまたは収縮局面を示します。 白色のドット: Bollinger Bands が Keltner Channels の外側にあり、拡大局面を示します。 ゼロラインを基準に四つのモメンタム状態を読む 色分けされたヒストグラムが方向と強さを分けて表示するため、強気または弱気のモメンタムが増しているのか、弱まり始めているのかを把握できます。 緑色のバー: 強気モメンタムがゼロより上で上昇しています。 青色のバー: 強気モメンタムはゼロより上ですが弱まっています。 赤色のバー: 弱気モメンタムがゼロより下で強まっています。 サーモン色のバー: 弱気モメンタム
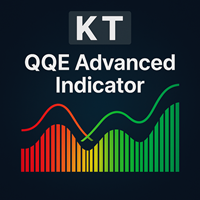
KT QQE Advanced は、クラシックな QQE オシレーターを改良し、カラー ヒストグラムと高速・低速のトレーリングライン(TL)でより正確に視覚化するインジケーターです。
従来の QQE と異なり、KT QQE Advanced はヒストグラム形式で表示され、買われ過ぎ・売られ過ぎレベルを明示します。
活用例
MTF スキャナーで全タイムフレームの売買シグナルを素早く検出。 トレンド方向をより正確に把握。 買われ過ぎ・売られ過ぎの市場状態を特定。 価格モメンタムの強弱を可視化。
入力パラメータ RSI 期間 平滑化期間 MTF スキャナー アラート設定
QQE とは? QQE は Quantitative Qualitative Estimation の略で、超スムーズ RSI と ATR を組み合わせたオシレーターです。 クラシック RSI の代わりに Wilder RSI を採用し、独自の指数平滑移動平均でスムージングを行います。 Wilder の平滑式 = 前回 MA + (1 / n × (終値 − 前回 MA))
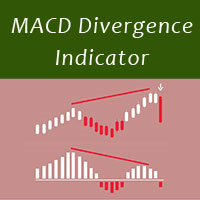
MACD divergence indicator finds divergences between price chart and MACD indicator and informs you with alerts (popup, mobile notification or email) . Its main use is to find trend reversals in the chart. Always use the divergence indicators with other technical assets like support resistance zones, candlestick patterns and price action to have a higher possibility to find trend reversals. Three confirmation type for MACD divergences: MACD line cross zero level Price returns to previous H/L Crea
FREE

Market Momentum Alerter Market Momentum Alerter will inform you about danger to operate in the market.
Imagine you see a very nice setup (Forex, Stocks, Indices) and you decide to place your trade...
And you finally lose your trade and don't understand what happened.
This can happen due to big operations in the market carried out by banks and big institutions.
These operations are invisible for most people.
Now with the Market Momentum Alerter you will be able to detect those operations...

Best indicator for MT5 providing accurate and sniper signals to enter a trade without repainting!
It can be applied to any financial assets: forex, synthetic, cryptocurrencies, metals, stocks, indices . It will provide pretty accurate trading signals and tell you when it's best to open a trade and close it. Most traders improve their trading results during the first trading week with the help of the Power Indicator Pro.
Benefits of the Power Indicator Pro
Entry signals without repaint

KT Average Daily Range(ADR) shows the upper and lower levels using the average daily range covered by the currency pair or the instrument. The average daily range is calculated using the chosen period in the input settings. ADR High: ADR upper level is found by adding the average daily range value to the current day's low.
ADR Low: ADR lower level is found by subtracting the ADR value from the current day's high.
Features
It shows the ADR levels with several other helpful information benefici

KT Fisher Transform is an advanced version of the original Fisher Transform oscillator equipped with divergence detection, crossover alerts, and many more features. Originally it was developed by John F. Ehlers. It converts the asset's price into a Gaussian normal distribution to find the local extremes in a price wave.
Features
A light-weighted oscillator that efficiently identifies the upward and downward crossovers and marks them using vertical lines. It also finds regular and hidden diverg

PriceRunner MT5 The PriceRunner indicator is based on pure relative power. It gives promising results even in M1 timeframes in currency pairs and M2 in commodities and cryptos. The indicator is designed with user-friendly and simple settings. It is very suitable even for beginners who are interested in indicators and strategies. I am ready to make improvements on the indicator in line with the needs of those who buy or rent. However, even in its current state, you can see very promising results
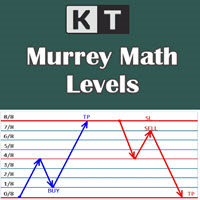
It shows the Murrey Math levels on chart and also provides an alert when price touch a particular level. T. Henning Murrey, in 1995, presented a trading system called Murrey Math Trading System, which is based on the observations made by W.D Gann.
Applications
For Murrey Math lovers, this is a must-have indicator in their arsenal. There is no need to be present on the screen all the time. Whenever the price touches a level, it will send an alert. Spot upcoming reversals in advance by speculatin
KT Candle Timer shows the remaining time in the closing of the current bar. You can use the bar closing time for multiple purposes, including time and trade management during the trading hours.
Features
It also shows the Symbol spreads along with the remaining time. It offers two convenient timer display positions, i.e., chart corner or next to the current bar. From colors to text size, it offers full customization according to user preferences. It is optimized to work without using extensive c
KT Bullish Bearish shows the bullish/bearish regime of the market in the form of a colored histogram representing both of the market states alternately. Bull Market (Blue Histogram): A bull market indicates an uptrend when an instrument price rises over a continued period like days, months, or years. Bear Market (Red Histogram): A bear market indicates a downtrend when an instrument price rises over a continued period like days, months, or years.
Applications
It prevents trading against the big
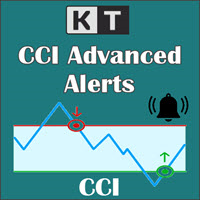
KT CCI Alerts is a personal implementation of the Commodity Channel Index (CCI) oscillator that provide signals and alerts on four custom events: When CCI enter in an overbought zone. When CCI exit from an overbought zone. When CCI enter in an oversold zone. When CCI exit from an oversold zone.
Features A perfect choice for traders who speculate the CCI movements within an overbought/oversold zone. Lightly coded without using extensive memory and resources. It implements all Metatrader alerts.
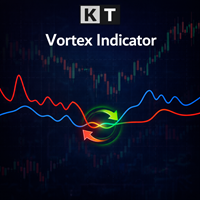
The Vortex Indicator was first presented by Douglas Siepman and Etienne Botes in January 2010 edition of Technical Analysis of Stocks & Commodities. Despite its based on a complex implosion phenomenon, the vortex is quite simple to interpret. A bullish signal is generated when +VI line cross above the -VI line and vice versa. The indicator is mostly used as a confirmation for trend trading strategies. The Vortex was inspired by the work of Viktor Schauberger, who studied the flow of water in tur
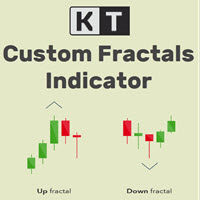
KT Custom Fractals is a personal implementation of the Fractal indicator first introduced by Bill Williams. With KT Custom Fractals you can choose a custom number of bars to allow to the left and right side of the fractal. For example, you can display the fractals that have "three" successive bars with the highest high in the middle and one lower high on both sides , or you can display the fractals that have "Eleven" consecutive bars with the lowest low in the middle and five higher lows on bot

KT Fractal Channel Breakout draws a continuous channel by connecting the successive Up and Down fractals. It provides alerts and also plots the Up and Down arrows representing the bullish and bearish breakout of the fractal channel.
Features
If you use Bill Williams fractals in your technical analysis, you must also include it in your trading arsenal. It can be very effective and useful for stop-loss trailing. A new market trend often emerges after a fractal channel breakout in a new direction.
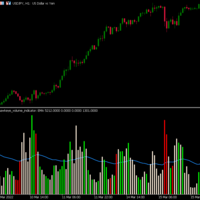
Hawkeye Volume Indicator contains a complex algorithm which executes over 300 calculations per bar in order to analyze the price action and associated volume, giving traders a tremendous advantage. Now Available in MT5 for U nlimited Use !
Volume is the only leading indicator which: .signals a price movement prior to it happening
.provides the fuel that drives the market Hawkeye Volume works in all markets and can be used in all timeframes for both tick and time charts – from longer term swing a
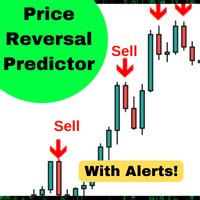
このアルゴリズムは、90%*の精度で価格の短期的な変化を予測します。 価格が信号キャンドルよりも高いか低いかを予測します。 より大きな時間枠で平均復帰取引、バイナリオプションや先物契約のための完璧な。 この指標は5年間のデータに基づいてバックテストされ、時間の経過とともに価格の逆転を予測するための90%の精度を持っています。
特徴:
簡単なセットアップ 任意のグラフにドラッグアンドドロップ アラートを有効にする(オプション) そして、あなたは完了です! 視覚的および音声的な警告 お使いの携帯電話に直接送信されるアラート 端末に送信されるポップアップ警告 高いwinrate 取引の最大90%を獲得 バックテストされた5年と複数の通貨。 (バックテストの詳細と分析については、ウェブサイトを参照してください)。 多数の信号 アクティブモードでは、シンボルごとに一日3-6信号を期待しています パッシブモードでは、シンボルごとに1日に2つの信号を期待しています。 *これは30分の蝋燭の表示器があればあります。 柔軟性 外国為替、指数、コモディティや株式に取り組んでいます。 任意の時間枠で動
FREE
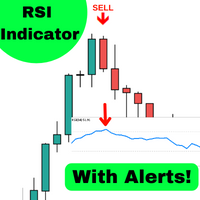
このアルゴリズムは、86%*の精度で価格の短期的な変化を予測します。 ATRによって決定されるように大きな動きがある場合,買われ過ぎや売られ過ぎの状態の間に,インジケータはあなたに警告します. 価格が信号キャンドルよりも高いか低いかを予測します。 より大きな時間枠で平均復帰取引、バイナリオプションや先物契約のための完璧な。 この指標は5年間のデータに基づいてバックテストされ、時間の経過とともに価格の逆転を予測するための90%の精度を持っています。
特徴:
簡単なセットアップ 任意のグラフにドラッグアンドドロップ お好みに合わせてパラメータを調整(オプション) アラートを有効にする(オプション) そして、あなたは完了です! 視覚的および音声的な警告 お使いの携帯電話に直接送信されるアラート 端末に送信されるポップアップ警告 高いwinrate 取引の最大90%を獲得 バックテストされた5年と複数の通貨。 (バックテストの詳細と分析については、ウェブサイトを参照してください)。 多数の信号 シンボル*ごとに1日に2つの信号を期待しています。 *これは30分の蝋燭の表示器があればありま
FREE
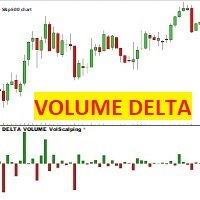
VOLUMEDELTAVolscalping このインジケーターは、価格キャンドルごとに、売買された契約の差であるデルタキャンドルを描画します。 ビッドで取引された(販売された)契約がアスクで取引された契約を超える場合、ろうそくは赤でマイナスになります。逆に、ASKで取引された(購入された)契約がビッドで取引された契約を超える場合、キャンドルは緑でポジティブになります。
注意:このインジケーターは、実際の市場データフローを提供し、契約をBIDとASKに分割するブローカーでのみ機能します。 外国為替、CFD、暗号通貨は合成市場に属しており、実際の市場データフローがないため、インジケーターは機能しません。 デモ口座があっても、預金なしで実際の市場データフローを提供するブローカーは、AMPFUTUREブローカーです。 インデックス、コモディティ、実際の市場で取引されるコモディティ(CME、EUREX、ICEなど)で動作します
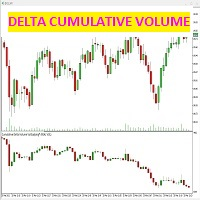
このインジケーターは、各ろうそくのビッドとアスク(アグレッシブ)で成立した契約の違いを検出します。
インジケーターは、価格チャートの下の専用ウィンドウに、販売された契約と購入された契約の違いによって正確に与えられたキャンドルを示します。これは、市場のボリュームの強さを生み出します。
累積ローソク足デルタチャートのみを選択する方法、またはキャンドル自体のトレンドラインを使用する方法も可能です。2番目のボックスu "NONE"を選択すると、トレンドラインは描画されませんが、色を選択すると、ボリュームキャンドルのトレンドラインは、それらと一緒にチャートに表示されます。
この指標は何のためのものですか?価格チャートをボリュームデルタチャートと比較すると、市場の真の強さを確認できます。2つのチャートの収束により、価格の正しい上昇/下降が決定されますが、価格とボリュームデルタの相違はシグナルアラートである必要があります。トレーダーにとっては、価格が逆転するはずだからです。この指標は、取引戦略と一緒に使用して、誤ったシグナルをフィルタリングし、価格と出来高の間の相違の段階で発生するシグナルを
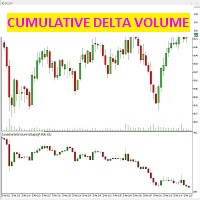
このインジケーターは、各ろうそくのビッドとアスク(アグレッシブ)で成立した契約の違いを検出します。
インジケーターは、価格チャートの下の専用ウィンドウに、販売された契約と購入された契約の違いによって正確に与えられたキャンドルを示します。これは、市場のボリュームの強さを生み出します。
累積ローソク足デルタチャートのみを選択する方法、またはキャンドル自体のトレンドラインを使用する方法も可能です。2番目のボックスu "NONE"を選択すると、トレンドラインは描画されませんが、色を選択すると、ボリュームキャンドルのトレンドラインは、それらと一緒にチャートに表示されます。
この指標は何のためのものですか?価格チャートをボリュームデルタチャートと比較すると、市場の真の強さを確認できます。2つのチャートの収束により、価格の正しい上昇/下降が決定されますが、価格とボリュームデルタの相違はシグナルアラートである必要があります。トレーダーにとっては、価格が逆転するはずだからです。この指標は、取引戦略と一緒に使用して、誤ったシグナルをフィルタリングし、価格と出来高の間の相違の段階で発生するシグナルを

KT Coppock Curve は、平滑化したモメンタムを市場の方向性として分かりやすく表示します。価格チャートの下にある別ウィンドウで動作し、ゼロラインが主な基準になります。曲線の細かな変化に毎回反応するのではなく、モメンタムが強気側と弱気側のどちらにあるかをすぐに確認できます。 この曲線は、長期と短期の変化率を組み合わせ、その結果を平滑化します。そのため、速いオシレーターに出やすいノイズを抑えながら、より大きなモメンタムの変化を追うのに適しています。 最初に位置を確認し、次にクロスを見る 曲線がゼロより上にあるときは、プラスのモメンタムが優勢です。ゼロより下にあるときは、マイナスのモメンタムが優勢です。曲線がゼロラインの片側にとどまっている間は、ローソク足が増えるたびに見方を変えず、現在の方向圧力に合わせやすくなります。 ゼロラインを上抜けると上向き矢印が表示され、下抜けると下向き矢印が表示されます。クロスの正確な位置を目で判断しなくても、新しいモメンタムの変化を簡単に見つけられます。 実際の取引手順への取り入れ方 方向フィルターとして使う場合は、曲線がゼロより上にある間は買いセ
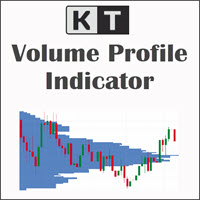
KT Volume Profile は、チャート上で選んだ範囲のどの価格帯に取引活動が集中したかを確認するためのインジケーターです。調べたい値動きに長方形を合わせ、左または右の境界をドラッグします。プロファイルはすぐに再計算され、選択した価格範囲に横向きのヒストグラムを表示します。 重要なチャート範囲を自分で選ぶ 固定セッションや一定の過去期間に縛られません。移動できるボックスを使って、トレンドの一部分、持ち合い、ブレイク前のベース、ニュースによる値動きなど、比較したい区間だけを切り出せます。ボックスを広げたり狭めたりするとプロファイルも更新されるため、値動きの進行とともに市場参加がどう変化したかを確認できます。 時間だけでなく価格別に出来高を読む 長いヒストグラムは、ボックス内でより多くの出来高が積み上がった価格帯を示します。短い部分は活動が少なかった価格帯です。市場がどの価格で多く取引され、どの価格を素早く通過したかを実用的に把握できます。 Point of Control を現在の基準として使う 破線の POC は、選択範囲で累積出来高が最も多い価格を示します。相場の均衡、反応、

私たちのインジケーターは、複数のペアのスプレッドを同時に監視するスプレッドスクリーナーを提供します。また、キャンドルタイマーのカウントダウンは、現在のバーが閉じて新しいバーが形成されるまでの残り時間を表示します。
期間限定オファー:すべてのプレミアムインジケーターはわずか50ドルでご利用いただけます。MQL5ブログにアクセスすると、プレミアムインジケーターのすべての詳細を確認できます。 ここをクリック。
主な機能 同時に広がるマルチペアを監視します。 現地時間ではなく、サーバー時間を追跡します。 構成可能なテキストの色とフォントサイズ CPU使用率を削減するために最適化 ペアのパーソナライズされたリスト。 コンタクト ご不明な点がある場合やサポートが必要な場合は、プライベートメッセージでご連絡ください。
警告 警告すべてのインジケーターとツールは、公式のMetatrader Store(MQL5 Market)からのみ入手できます。
著者 SAYADI ACHREF、フィンテックソフトウェアエンジニアおよびFinansyaの創設者
FREE

ROC は、現在の価格が以前の期間と比べてどれだけ速く変化したかを測ります。そのため、価格が新しいスイング高値や安値を付けても、その動きを支えるモメンタムが追随していない場面で特に役立ちます。KT ROC Divergence はこの食い違いを自動で見つけ、価格チャートと ROC ウィンドウの両方に対応するラインを描きます。 一定の範囲内で動くオシレーターとは異なり、ROC の値幅は市場の速度に応じて広がったり縮んだりします。異なる銘柄どうしで数値そのものを比較する必要はありません。重要なのは、価格のスイングとオシレーターのスイングの関係です。 四つのパターンをトレーダーの言葉で理解する 通常の強気ダイバージェンス: 価格が安値を切り下げる一方で、ROC は安値を切り上げます。価格が下落を続けていても、売りのモメンタムが弱まっている可能性があります。 通常の弱気ダイバージェンス: 価格が高値を切り上げる一方で、ROC は高値を切り下げます。価格がまだ上昇していても、買いのモメンタムが衰えている可能性があります。 隠れた強気ダイバージェンス: 価格が安値を切り上げる一方で、ROC は安値
デュアルライン信号、ゼロレベルシステム、マルチタイムフレーム対応、カスタマイズ可能なビジュアル信号、高度に設定可能なアラートシステムを備えた高度な相対活力指数(RVI)インジケーター。
フリーランスプログラミングサービス、アップデート、その他のTrueTL製品は私の MQL5プロフィール からご利用いただけます。
フィードバックとレビューを心よりお待ちしております!
相対活力指数(RVI)とは? 相対活力指数(RVI)は、John Ehlersが開発したモメンタム・オシレーターで、トレーディングレンジで正規化しながら、終値と始値の相対的な関係を比較することで、直近の価格変動の確信度を測定します。基本原理は、強気市場では終値が始値より高くなる傾向があり、弱気市場ではその逆が成り立つというものです。 RVIはゼロラインの周りを振動します——正の値は強気のモメンタムを示し、負の値は弱気のモメンタムを示します。インジケーターは2本のラインで構成されています:メインライン(RVI値)とシグナルライン(メインラインの4本バー対称加重移動平均)。これら2本のライン間のクロスオーバーはエントリー
FREE

チャート上でトレンド方向を直接確認 KT Trend Magic はモメンタムとボラティリティを組み合わせ、価格に沿って動く色分けラインを表示します。ラインは現在のトレンド状態を連続して示し、計算された方向が変わると色も切り替わります。 緑のライン: 強気のトレンド状態を示します。 赤のライン: 弱気のトレンド状態を示します。 色の変化: チャート上の新しい方向転換を示します。 持続的な動きでは、ラインを押しや戻り、継続を確認するための動的な基準としても利用できます。各転換を現在の値動きとご自身のエントリールールに照らして判断できます。 9つの時間足でシグナルを比較 マルチタイムフレームスキャナーは、M1、M5、M15、M30、H1、H4、D1、W1、MN1 の Trend Magic 状態を Bullish または Bearish で表示します。時間足ごとに別のチャートを開かずに、現在のチャートと短期および長期の方向を比較できます。 複数の時間足が同じ方向を示しているか、現在のチャートが広いトレンド背景に逆行しているかを確認できます。チャートのラインは詳細な局所表示を、スキャナーはよ
今どの外国為替セッションで取引しているのか、そして各セッションが何pips動いたのかを、MetaTrader 5のチャート上で直接確認できます。 KT Forex Sessions MT5は、東京、ロンドン、ニューヨークの各セッションを色付きのボックスで描き、各セッションの値幅をpipsでそのボックスに表示するセッションインジケーターです。 インジケーターはブローカーのGMTオフセットを自動で読み取り、各セッションはそれぞれの都市の現地時間とサマータイムに従います。ボックスは一年中正しい位置に表示され、設定は何も必要ありません。 チャートに表示されるもの すべてのボックスにpips: 取引するどの通貨ペアでも、静かなセッションと活発なセッションが一目で区別できます。 時差の計算は不要: GMTオフセットを調べる必要はなく、春と秋に時計が切り替わるときも変更は何もいりません。 重なる時間帯は専用のボックス: ロンドンとニューヨークが同時に開いている時間帯には、専用の紫色のボックスがあります。 開いているセッションはリアルタイムで広がる: セッションが終わるまで、ボックスは新しい高値と安値
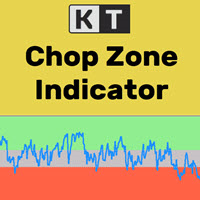
金融市場の多くは、全体の約30%の時間だけトレンドを形成し、残りの約70%はレンジ相場で推移していることはよく知られています。しかし、初心者トレーダーにとっては、市場が現在トレンド中なのか、それともレンジ内で動いているのかを見極めるのは簡単ではありません。 KT Chop Zone はこの課題を解決し、市場のフェーズを明確に3つのゾーン(下降ゾーン、上昇ゾーン、そしてレンジゾーン=Chop Zone)に分けて表示することで、相場環境を視覚的に判断しやすくします。
機能
レンジ相場(Chop Zone)での取引を避けることで、トレードの精度を即座に向上させます。 利確や手仕舞いの目安としても使用できます。たとえば、ポジションがChop Zoneに入った際に決済することができます。 Expert Advisor(EA)との完全な互換性あり。EAに簡単に組み込んで戦略の強化が可能です。 すべてのMetaTraderアラートに対応しています。
インプットパラメーター メイン期間: オシレーターに使われる整数値。推奨値は10〜30です。 上昇ゾーンのレベル: 上昇ゾーンの判定に使う数値を設
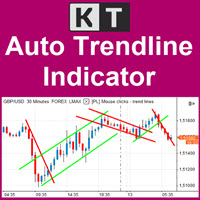
重要なトレンドラインをチャート上で自動更新 KT Auto Trendline は、最近の ZigZag スイングポイントから上側と下側のトレンドラインを自動で作成し、現在のチャート上で両方を将来方向へ延長します。同じラインを何度も手動で引き直すことなく、形成中のブレイクアウト、反発、価格方向の変化を明確な構造として確認できます。 近い値動きと広いスイング構造を同時に確認 最初のトレンドラインセットは初期設定で有効になっており、反応性の高い ZigZag 設定を使用します。より広い視点が必要な場合は、2番目のセットを有効にすると、独自の感度を持つ別の上側と下側のラインが追加されます。1つのチャートで、直近の価格構造とより大きな市場スイングを比較できます。 各トレンドラインセットの反応を調整 Show First Trendline: メインの上側と下側の延長ラインを表示または非表示にします。 Depth、Deviation、Back Step: 最初の ZigZag セットがスイングポイントを検出する感度を調整します。 Show Second Trendline: オプションの2番目の
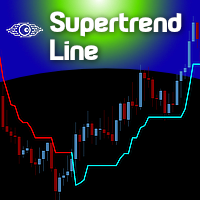
The Supertrend indicator was originally created by a french fellow named Olivier Seban , and its goal is to identify the Primary Trend of prices . Its calculation is easy and based on the average of Highs and Lows and then we add the volatility of a custom period, plus a multiplier. This way we get the Supertrend Line. You can find in the web several approaches and trading strategies using this very useful indicator.
HOW TO "READ" THIS INDICATOR
If the closing prices are above Supertrend Line,
FREE

The Analytical cover trend indicator is a revolutionary trend trading and filtering solution with all the important features of a trend tool built into one tool! The Analytical cover indicator is good for any trader, suitable for any trader for both forex and binary options. You don’t need to configure anything, everything is perfected by time and experience, it works great during a flat and in a trend.
The Analytical cover trend indicator is a tool for technical analysis of financial markets
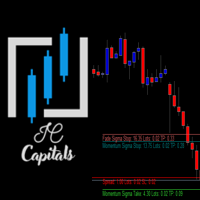
Key Features: Multi-Target Volatility: Configure multiple Take Profit and Stop Loss levels based on real-time market volatility. Fully Customizable: Set specific volatility multipliers (e.g., 4x for Stop, 10x for Take) using any look-back period (e.g., previous 20 bars on a 2-minute chart). Clear Visuals: Assign unique names to each level to be displayed directly on your symbol's chart for easy monitoring. Consistency: Every level calculated is synchronized with the volatility of your chosen per
FREE
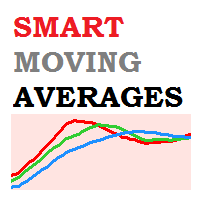
Smart Moving Averages Indicator Smart Moving Averages is an exclusive indicator for Metatrader platform.
Instead of calculating moving averages for the selected chart time frame, the Smart Moving Averages indicator gives you the opportunity to calculate moving averages independently from the chart time frame.
For instance you can display a 200 days moving average in a H1 chart.
Inputs of the indicator are:
Timeframe : timeframe to be used for the calculation of the moving average Period : m

Bar Strength Divergence Indicator BarStrength Indicator is an exclusive indicator to trade Forex, Stocks, Indices, Futures, Commodities and Cryptos.
BarStrength Indicator shows the strength of each candle.
The indicator shows in a separate windows candles relatively to 2 price levels representing resistance and support in the market.
Once candle is near resistance it is highly probable that price movement will change direction and will go down in the next candles.
Once candle is near support
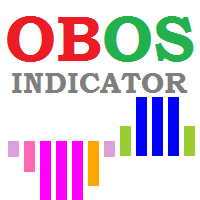
OBOS indicator
OBOS Indicator is an exclusive indicator to spot entries based on price action.
The OBOS Indicator is both effective and user friendly.
Indicator uses simple color codes and levels to indicate Overbought and Oversold conditions. No more headache.
The OBOS Indicator will only gives you indication when there are possible entries. Means you only get useful information.
Inputs of the indicator are:
MaxBars : number of bars to display in your chart Smoothing period : number of b

HighLow Arrow Indicator HighLow Arrow is a simple indicator to be used to signal major lows and major highs in your chart.
This indicator is not intended to be used to trade alone but more as an alert that a turning point might be forming.
In this case the HighLow Arrow indicator signals that a new high or a new low is forming and that traders can prepare for seeking new signals.
The formation of the High or the Low is confirmed after 2 bars have been closed. In the meantime, the alert can b
Tick imbalance bars (TIB), described in the book Advances in Financial Machine Learning (2018) by Marcos López de Prado. Indicator that show candlestick bars with an different sampling method than time fixed. Real time data is sourced to the indicator and it may be used as substitute of the default graph. Each bar is formed when a predefined tick balance is exceeded, showing in the graph the OHLC of this cluster of ticks. The input variable is the amount of ticks of each bar. The indicator may
FREE
Daily Pivots Multi Indicator Daily Pivots Multi is an exclusive indicator to draw your pivots levels and much more.
Most indicators draw daily pivots for the day. Daily Pivots Multi is able to draw levels for different days.
The indicator can do the calculation for unlimited number of days backward. It means that you can draw the levels for today but also for the past days.
This is very useful if you want to study a strategy with Pivots levels over a period of time.
Another problem is that e
Breakout Impulse Indicator Breakout Impulse Indicator is a pattern recognition indicator for Forex, Stocks, Indices, Futures, Commodities and Cryptos.
The Breakout Impulse is a multi-bar pattern.
The purpose of the pattern is to identify a fast change in momentum.
This type of change can announce the start of a big directional move.
Inputs of the indicator are:
Distance : distance in pixel relative to top or bottom of candle to display the arrow symbol MaxBars : number of bars back used to
Matrix Indicator Matrix Indicator is a simple but effective indicator.
Matrix indicator displays usual oscillators indicators in a user friendly color coded indicator.
This makes it easy to identify when all indicators are aligned and spot high probability entries.
Inputs of indicator are:
Indicator: RSI, Stochastic, CCI, Bollinger Bands Param1/Param2/Param3: usual settings for the indicator ValueMin: Oversold level for oscillator ValueMax: Overbought level for oscillator The indicator can
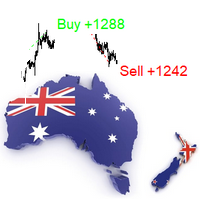
The indicator is a trading system for AUDUSD or NZDUSD currency pairs.
The indicator was developed for time periods: M15, M30.
At the same time, it is possible to use it on other tools and time periods after testing.
"Kangaroo Forex" helps to determine the direction of the transaction, shows entry points and has an alert system.
When the price moves in the direction of the transaction, the maximum length of the movement in points is displayed.
The indicator does not redraw, all actions occ
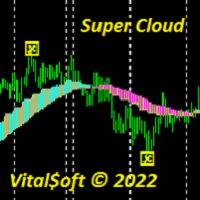
The Super Cloud indicator helps to determine the direction of the trend when trading. Shows on the chart signals about a possible upcoming trend change. The indicator provides an opportunity to detect various features and patterns in price dynamics that are invisible to the naked eye. Based on this information, traders can anticipate further price movement and adjust their strategy accordingly. Works on all timeframes except MN.
Trend Direction ADX indicator Trend Direction ADX is part of a serie of indicators used to characterize market conditions.
Almost any strategy only work under certain market conditions.
Therefore it is important to be able to characterize market conditions at any time: trend direction, trend strength, volatility, etc..
Trend Direction ADX is an indicator to be used to characterize trend direction:
trending up trending down ranging Trend Direction ADX is based on ADX standard indicator.
Tre

Trend Strength MA indicator Trend Strength MA is a part of a series of indicators used to characterize market conditions.
Almost any strategy only works under certain market conditions.
Therefore, it is important to be able to characterize market conditions at any time: trend direction, trend strength, volatility, etc.
Trend Strength MA is an indicator to be used to characterize trend strength:
Up extremely strong Up very strong Up strong No trend Down strong Down very strong Down extremely

Trend Direction Up Down Indicator Trend Direction Up Down is part of a series of indicators used to characterize market conditions.
Almost any strategy only works under certain market conditions.
Therefore it is important to be able to characterize market conditions at any time: trend direction, trend strength, volatility.
Trend Direction Up Down is an indicator to be used to characterize trend direction (medium term trend):
trending up trending down ranging Trend Direction Up Down is based
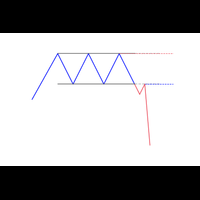
A new box will be added, if the closing price is higher than the maximum (lower than the minimum) of the current box series no less than for the specified value. Reversal will be made, if the closing price is higher (lower) than the last box on a value no less than the specified.
T his is a trend indicator and it can be used as an alternative for the trend definition instruments which use averaging.

KT Risk Reward shows the risk-reward ratio by comparing the distance between the stop-loss/take-profit level to the entry-level. The risk-reward ratio, also known as the R/R ratio, is a measure that compares the potential trade profit with loss and depicts as a ratio. It assesses the reward (take-profit) of a trade by comparing the risk (stop loss) involved in it. The relationship between the risk-reward values yields another value that determines if it is worth taking a trade or not.
Features
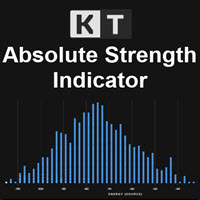
KT Absolute Strength measures and plots the absolute strength of the instrument's price action in a histogram form. It combines the moving average and histogram for a meaningful illustration. It supports two modes for the histogram calculation, i.e., it can be calculated using RSI and Stochastic both. However, for more dynamic analysis, RSI mode is always preferred.
Buy Entry
When the Absolute Strength histogram turns green and also it's higher than the previous red column.
Sell Entry
When th
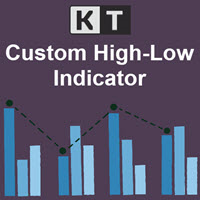
KT Custom High Low shows the most recent highs/lows by fetching the data points from multi-timeframes and then projecting them on a single chart. If two or more highs/lows are found at the same price, they are merged into a single level to declutter the charts.
Features
It is built with a sorting algorithm that declutters the charts by merging the duplicate values into a single value. Get Highs/Lows from multiple timeframes on a single chart without any fuss. Provide alerts when the current pri
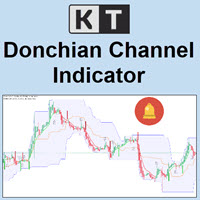
KT Donchian Channel is an advanced version of the famous Donchian channel first developed by Richard Donchian. It consists of three bands based on the moving average of last high and low prices. Upper Band: Highest price over last n period. Lower Band: Lowest price over last n period. Middle Band: The average of upper and lower band (Upper Band + Lower Band) / 2. Where n is 20 or a custom period value is chosen by the trader.
Features
A straightforward implementation of the Donchian channel ble
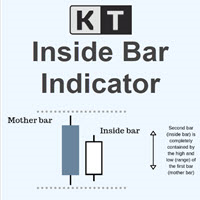
KT Inside Bar plots the famous inside bar pattern in which the bar carries a lower high and higher low compared to the previous bar. The last bar is also known as the mother bar. On smaller time-frames, the inside bar sometimes appears similar to a triangle pattern.
Features
Also plots entry, stop-loss, and take-profit levels with the inside bar pattern. No complex inputs and settings. Erase unwanted levels when the price reaches the entry line in either direction. All Metatrader alerts include
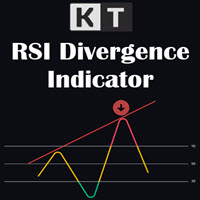
KT RSI Divergence shows the regular and hidden divergences built between the price and Relative Strength Index (RSI) oscillator. Divergence can depict the upcoming price reversal, but manually spotting the divergence between price and oscillator is not an easy task.
Features
Ability to choose the alerts only for the divergences that occur within an overbought/oversold level. Unsymmetrical divergences are discarded for better accuracy and lesser clutter. Support trading strategies for trend reve

Hunt markets with Hunttern ZigZag . Easy to use with one parameter
You can use it for the following: -Classic patterns -Heads and shoulders -Harmonic patterns -Elliott Wave -Support and resistance -Supply and Demand
Single parameter: -Period (1-120)
Features: -Candle time -Single parameter -Light mode template
This is version 1 of Hunttern ZigZag. We are very happy to receive feedback from you.
FREE

主要城市的时间。北京时间、东京时间、悉尼时间、惠灵顿时间、纽约时间、法兰克福时间、伦敦时间、迪拜时间。 城市时间可选择开启或者关闭。 点差变色提醒。设置点差提醒点数,例如,设置100点,点差大于100点,文字会变红色。 Time in major cities. Beijing time, Tokyo time, Sydney time, Wellington time, New York time, Frankfurt time, London time, Dubai time. City time can be turned on or off. Dot difference color change reminder. Set the point difference reminder points. For example, set 100 points. If the point difference is greater than 100 points, the text will turn red.
FREE

FX STEWARDS Trading Signals Alert (v5.00) – The Ultimate Hybrid Signal System (Heritage Edition) Built for traders. Engineered for precision. Designed to dominate. Harness the power of cutting-edge quantitative research with FX STEWARDS Trading Signals Alert, a professional-grade hybrid indicator that fuses a 73-feature neural network, a 30+ pattern candlestick engine, an institutional-style probability model, and full auto-timeframe intelligence into tiered BUY/SELL trade alerts — filtere
Automatic trend lines. Type 1. With two extremums. 1) From the current bar "go" to the left and look for the first (right) extremum point with the InpRightExmSide bars on both sides. 2) From the first point again "go" to the left and look for the second (left) extremum point with the InpLeftExmSide bars on both sides.

LT Easy Trend - 9つのインジケーターの根拠を1つに集約 あるインジケーターが買いを示しているのに、別のインジケーターが売りを示していて、迷ったことはありませんか? LT Easy Trend は、そのような優柔不断さを排除するために開発されました。 世界で最も信頼されている9つのテクニカルインジケーター の数学的合意に基づいた、高確率なシグナルを提供します。 チャートを無数のウィンドウで埋め尽くす必要はありません。Easy Trendがリアルタイムですべてを処理し、すべてのフィルターが同時にトレンドを確認したときのみ、明確な視覚的シグナルを表示します。 9つのトレンドフィルターの力: 以下のすべての条件が完全に一致した場合のみ、エントリーシグナルが生成されます: 移動平均線 (MA): 価格の方向性フィルター。 相対力指数 (RSI): 強さと勢いの識別。 商品チャネル指数 (CCI): 新しいトレンドサイクルの検出。 パラボリックSAR: 動的なトレンド追跡と反転の特定。 ウィリアムズ%R (WPR): 買われすぎ・売られすぎ水準の読み取り。 スト

Sqn Max Indicator Sqn Max is an exclusive indicator to trade the market with high effectiveness.
The indicator is based on price action, volatility and trend.
This indicator is as simple as possible but not too simple.
The indicator can generate alerts to ease the trading process. You don't have to stay all day in front of your screen.
The indicator can be used with any class of assets and with any time frame.
It is possible to achieve better results trading our list of selected assets.
We achi
MetaTraderプラットフォームのためのアプリのストアであるMetaTraderアプリストアで自動売買ロボットを購入する方法をご覧ください。
MQL5.community支払いシステムでは、PayPalや銀行カードおよび人気の支払いシステムを通してトランザクションをすることができます。ご満足いただけるように購入前に自動売買ロボットをテストすることを強くお勧めします。

取引の機会を逃しています。
- 無料取引アプリ
- 8千を超えるシグナルをコピー
- 金融ニュースで金融マーケットを探索