 MetaTrader 5
 エキスパート
 インディケータ
 ライブラリ
ライブラリ
 ユーティリティ
 ウィジェット
 ルール
ルール
YouTubeにあるマーケットチュートリアルビデオをご覧ください
ロボットや指標を購入する
仮想ホスティングで
EAを実行
EAを実行
ロボットや指標を購入前にテストする
マーケットで収入を得る
販売のためにプロダクトをプレゼンテーションする方法
MetaTrader 5のための新しいテクニカル指標 - 179
 テクニカル指標からのシグナルは、株式および外国為替市場での取引の開始と終了に重要な役割を果たします。指標の本質は、将来の価格変動を予測することを目的とした金融銘柄価格の数学的変換です。
テクニカル指標をテストして、市場の動きとそれからの利益をより正確に予測します。
テクニカル指標からのシグナルは、株式および外国為替市場での取引の開始と終了に重要な役割を果たします。指標の本質は、将来の価格変動を予測することを目的とした金融銘柄価格の数学的変換です。
テクニカル指標をテストして、市場の動きとそれからの利益をより正確に予測します。 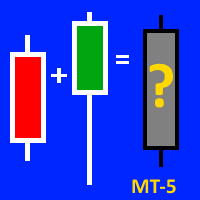
This indicator will be VERY USEFUL for anyone who works with candlestick patterns. This indicator is designed to display the average figure from two adjacent candles (current and previous). Accordingly, it shows IN CONTEXT the strength or weakness of bulls / bears (!). But please, don't forget about the classical basics of technical analysis (!). All indicators are just an auxiliary tool for reading a chart (!). A demo version on the example of mt-4 can be found here: https://www.mql5.com/ru/ma
YOU CAN NOW DOWNLOAD FREE VERSIONS OF OUR PAID INDICATORS . IT'S OUR WAY OF GIVING BACK TO THE COMMUNITY ! >>> GO HERE TO DOWNLOAD
More About Advanced Currency Meter Every good forex system has the following basic components: Ability to recognize the trend direction. Ability to identify the strength of the trend and answer the basic question Is the market trending or is it in a range? Ability to identify safe entry points that will give a perfect risk to reward (RR) ratio on every position.
FREE

В основу алгоритма этого осциллятора положен анализ веера сигнальных линий технического индикатора RSI . Алгоритм вычисления сигнальных линий выглядит следующим образом. В качестве исходных данных имеем входные параметры индикатора: StartLength - минимальное стартовое значение первой сигнальной линии; Step - шаг изменения периода; StepsTotal - количество изменений периода. Любое значение периода из множества сигнальных линий вычисляется по формуле арифметической прогрессии: SignalPeriod(Number)
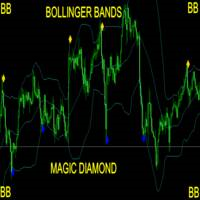
Take Your Trading Experience To the Next Level ! and get the Magic Bollinger Bands Diamond Indicator MagicBB Diamond Indicator is MT5 Indicator which can suggest signals for you while on MT5. The indicator is created with Non Lag Bollinger Bands strategy for the best entries. This is a system to target 10 to 20 pips per trade. The indicator will give alerts on the pair where signal was originated including timeframe. If signal sent, you then enter your trade and set the recommended pips targ
I really like this indicator. But I made it, so of course I would.. NOW FREE. But please consider supporting me by buying my 2 for sale indicators. You can multiply the weight of each indicator used to give more emphasis on it's value when averaging between the 3. Boost fast TEMA and it can move the indicator faster. Boost slow FrAMA and watch it smooth out. I like to use them as open/close lines and set them up so they move quick, but have the FrAMA smooth it out more.
Check out my other indi

Индикатор iVeles_Perfect_Oscilator является опережающим и одним из самых лучших осциляторов на сегодняшний день, использует специализированный расчет текущих цен графика. Очень качественно и своевременно показывает смену направления, очень точный подход к уровням перекупленности и перепроданности, что позволяет своевременно принять решение по сделке. Работает качественно на любом ТФ и с любым инструментом. Параметры: Period - период расчетов Average - усреднение МА Method - применяемый мето

В основу алгоритма этого трендового индикатора положен анализ веера сигнальных линий универсального мувинга I . Алгоритм вычисления сигнальных линий выглядит следующим образом. В качестве исходных данных имеем входные параметры индикатора: StartLength - минимальное стартовое значение первой сигнальной линии; Step - шаг изменения периода; StepsTotal - количество изменений периода. Любое значение периода из множества сигнальных линий вычисляется по формуле арифметической прогрессии: SignalPeriod(

Top indicator for MT5 providing accurate signals to enter Trades.
This Indicator will provide pretty accurate trading signals and tell you when it's best to open a trade by giving alerts to buy or sell. Mainly was created to target Volatility Index on Deriv broker however, the Spot Detector Arrow Indicator can be applied to any financial assets(Forex, Crypto, Indices, Volatilities) on MT5 Brokers.
HOW TO BUY Wait for signal Alert to Buy will be sent to your MT5 Terminal Blue arrow facing

Zigzag Indicator For RSI, To easily identify the highs and lows of the rsi signal. It is easier to observe divergent and convergent signals. Default setting: InpRsi =14 //Rsi Period InpDepth =12; // Depth InpDeviation =5; // Deviation InpBackstep =3; // Back Step
If you want open Exness account try this link : https://one.exness-track.com/a/teg5teg5 Dev buy taphu: Ha Van Tan - hatatrata - Trader's profile - MQL5 community Email: tan.ha@outlook.com
FREE
Just learning how to create an indicator from this tutorial .
its just a garbage text to fill the descriptions. Hello there. Hello there Hello there Hello there Hello there Hello there Hello there Hello there Hello there Hello there Hello there Hello there Hello there Hello there Hello there Hello there Hello there Hello there Hello there Hello there Hello there
FREE

FX STEWARDS Trading Signals Alert - Financials v5.00 (Heritage Edition) (Fundamental + Technical Edition) Built for precision. Powered by data. Driven by market context. FX STEWARDS Trading Signals Alert - Financials layers a live fundamental bias engine, a graduated news-event filter, and a full weekend trading gate on top of everything in the core Technical Edition — the same 73-feature neural network, 30+ pattern candlestick engine, institutional-style probability model, and auto-timefr

Wink IND is an indicator that tell you: -when MACD is saying buy or sell -when RSI is saying buy or sell -work on multi timeframes MT4 Version
by Wink IND: you don't need to have Knowledge about MACD or RSI don't need to check and compare MACD and RSI respectly don't need to check all of timeframes and compare the resaults don't lose time, save more time for your decisions in trading
Wink IND: multi timeframe indicator multi currency indicator show the positions by graphic shapes, arrows and
** All Symbols x All Timeframes scan just by pressing scanner button ** After 18 years of experience in the markets and programming, Winner indicator is ready. I would like to share with you! *** Contact me to send you instruction and add you in "123 scanner group" for sharing or seeing experiences with other users. + FREE Trading Utility MT5 - New Update: 2026/09/25 Introduction The 123 Pattern Scanner indicator with a special enhanced algorithm is a very repetitive common pattern finder wi
UR モメンター
UR Moenter は、オシレータとして表される価格変動の枯渇に相関する価格のモメンタムを完全に計算します。 したがって、これは潜在的な反転またはリトレースメントの本当に初期のシグナルを提供します. この公式は、2018 年に市場バブルが崩壊した後に発見されました。
UR Moenter を使用する利点:
パラメータなし 価格の動きを表す 2 本の線があります。白線は、オシレーター (青い線) として表される価格の移動平均偏差と相関する価格のモメンタムです。 ヒストグラムは、価格の勢いに応じた最大偏差を視覚化したものです インターフェースは、両極端 (上部の赤と下部の緑の領域) のいずれかの線の枯渇を示しています。 最大の利点: 簡単で、すべてのアセットに合わせて調整できます。 ツールの最新情報を入手できる特別な電報チャットがあり、何か不足していると感じた場合はリクエストを送信することもできます!
UR モメンターを選ぶ理由
このインジケーターは、スタンドアロンのエントリーまたはエグジット インジケーターとして使用できます。 価格に依存しているため

数列の一つに「森林火災数列」があります。これは、最も美しい新しいシーケンスの 1 つとして認識されています。その主な特徴は、このシーケンスが線形トレンドを回避することです。最短のものであってもです。この指標の基礎を形成したのはこのプロパティです。 財務時系列を分析する場合、この指標は可能なすべての傾向オプションを拒否しようとします。そして失敗した場合にのみ、トレンドの存在を認識し、適切なシグナルを発します。このアプローチにより、新しいトレンドの始まりの瞬間を正しく判断できます。ただし、偽陽性の可能性もあります。それらの数を減らすために、このインジケーターに追加のフィルターが追加されました。新しいバーが開くとシグナルが生成されます。いずれの場合も再描画は発生しません。 指標パラメータ: Applied Price - 適用価格定数; Period Main - インディケータのメイン期間、その有効な値は 5 ~ 60 です。 Period Additional - 追加の期間。このパラメーターの有効な値は 5 ~ 40 です。 Signal Filter - 追加の信号
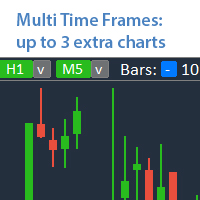
他の時間枠の最大3つの追加チャートを分析 ,メインのチャートを切り替えずに。 多機能ユーティリティ : 66+ の機能を含むこのツール | ご質問があればお問い合わせください | MT4 バージョン このインジケーターは 別ウィンドウ で開きます: ウィンドウ を移動 可能( [<M>] ボタンを使用)。 ウィンドウはスペースを節約するために最小化することもできます ( [ <^>] ボタン) 表示されたウィンドウで設定可能です: 1番目のチャート の期間(左);
2番目のチャート の期間(中央); 3番目のチャート の期間(右);
(各時間枠は無効化可能);
各時間枠の バーの数 。
最大バーの数:
a) 3つのアクティブチャート:30;
b) 2つのアクティブチャート:45;
c) 1つのアクティブチャート:90;
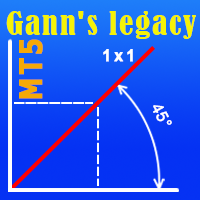
The indicator very accurately determines the levels of the possible end of the trend and profit fixing. The method of determining levels is based on the ideas of W.D.Gann, using an algorithm developed by his follower Kirill Borovsky. Extremely high reliability of reaching levels (according to K. Borovsky - 80-90%) Indispensable for any trading strategy – every trader needs to determine the exit point from the market! Precisely determines targets on any timeframes and any instruments (forex, met

The Weis Wave Chart Forex for MT5 is a Price and Volume indicator. The Price and Volume reading was widely disseminated through Richard Demille Wyckoff based on the three laws created by him: Supply and Demand, Cause and Effect and Effort vs. Result. In 1900 R.Wyckoff already used the wave chart in his analyses. Many years later, around 1990, David Weis Automated R. Wyckoff's wave chart and today we bring you the evolution of David Weis' wave chart. It shows the amount of Volume and the amount o

The Weis Wave Chart for MT5 is a Price and Volume indicator. The Price and Volume reading was widely disseminated through Richard Demille Wyckoff based on the three laws created by him: Supply and Demand, Cause and Effect and Effort vs. Result. In 1900 R.Wyckoff already used the wave chart in his analyses. Many years later, around 1990, David Weis Automated R. Wyckoff's wave chart and today we bring you the evolution of David Weis' wave chart. It shows the amount of Volume and the amount of pips

TRACKINGLEVELS (SUPPORTS AND RESISTANCES)
TrackingLevels is a useful indicator that saves considerable time when a trader starts analyzing a chart. This indicator draw on the chart all the resistances and supports that the market is creating. The resistance and support levels are very important, this levels define areas where there can be a considerable accumulation of sell or buy orders. These are a key areas that every trader must know and keep in mind all the time. This indicator helps the t
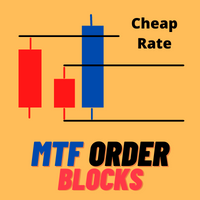
Very precise patterns to detect High Accurate Order Blocks: It Draw zone after market Structure Breakout with a high Accuracy, institutional orders with the potential to change the price’s direction and keep moving towards it, have been placed. Features Auto Order Blocks Draw MTF Order Blocks Double Signal One Alert Signal Second Long Wick Rejection Signal Market Structure BOS LINE How to show MTF order Block Go on indicator setting at the end of scroll you see OTF Setting change Timeframe
Hello;
This indicator provides input and output signals of real volume levels with some mathematical calculations. It is simple and safe to use. As a result of the intersection of real volume levels with averages, it creates buy and count signals.
Indicator parameter descriptions:
A-PERIOD: Indicates the number of bars to be calculated.
B-GAMMA: A fixed Fibonacci trend average of 0.618 is used.
Use C-VOLUME TYPE:Tick volume as a constant.
D-HIGH LEVEL 2: Represents the level of the second
This product generates signals at closing bars thanks to channel scaling. It visualizes these signals with an arrow. The color of the arrow indicates the direction of the trade. The default settings are valid for the H1 period. You can backtest for each period and product. The code content of the indicator has been applied in accordance with price movements as much as possible. For this reason, it detects trend beginnings and ends well.
Parameter descriptions:
PER: Indicates the number of bar

Smart Market Scanner and Dashboard The trend is very important when trading a financial instrument. The trend can be identified by checking various of structures and indicators. Trend shifts can be identified by trendline breakouts and horizontal support/resistance levels. Scanner will scan the selected symbols and show you the direction/trend on selected timeframes. Algo is based on: Price Cycles, Fractals, Order Blocks, Hi-Lo
Advantages: Multi timeframe Multi instruments including Currencies,
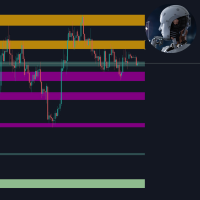
This tool is useful for indicating resistance and support levels It bases on zone in setting to identify top/bottom of candles and and draw rectangle according to those resistance/support level Beside user can edit the zone via dialog on specific timeframe and that value will be saved and loaded automatically. User can determine what strong resistance and support and make the order reasonably.
FREE

В основе индикатора EasyBands лежит тот же принцип, что и при построении Bollinger Band. Однако, данная модификация индикатора использует вместо стандартного отклонения средний торговый диапазон (Average True Range). Соответственно, с данныи индикатором абсолютно аналогично можно использовать все стратегии, которые применяются с Bollinger Band. В данной версии индикатора используется двенадцать уровней и средняя линия (белый цвет). Индикация тренда выполнена в виде окраски свечей в зависимости
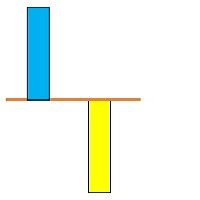
A technical Indicator Providing Price Convergence Signals along with value for experienced and professional traders. Easy to comprehend, Easy to understand.
This is a helping tool provides best signals. This indicator is designed based on the fundamentals of trade. A very good indicator you can customized its color. A best tool to find trade direction.
An adaptive indicator. It constantly adapts to the trade.

A value indicator for experienced and professional traders. It is helping tool to indicate the direction value gain. A best helping tool to trade value. This indicator is equipped with a colored line and a digital tool to indicate value numerically .
This indicator also helps to indicate value during trends. A study based on this indicator shows value of trade significantly changes during trends best tool to cash the trends.

Best helping tool for Professional and Experienced traders. A best Tool To find the trend. Instruction Manual: First Select your desired Symbol. Then attach this tool and wait till it identify the trend for you. Then it will be more feasible to trade.
Once again best tool to trade. Demo version is available you can fully test its functionality. More importantly there are always trend breaks Once Trend break is observed un-attach this tool and then re-attach to get the fresh trend. Precautions:
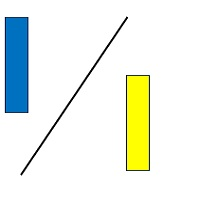
A basic tool for traders to trade percentile of the value. It indicates both values in the for of digits appeared on the left corner of the screen.
Instructions Manual : First choose your desired symbol and then select this tool. Please be remined that this tool is just a helping tool. its upon trader what he desired so. The function of this tool is just to provide a help in trading.

Nade com os grandes ou evite-os a todo custo. Com esse indicador, a escolha é sua! Indicador por coloração de barras, com respostas simples se os "grandes" estão negociando ou não. Saiba quando agir se o mercado está calmo ou agitado, de forma simples, pelo valor de retorno do indicador ou pela aparência das barras.
Indispensável indicador para a construção do seu robô ou para seu setup. Resultado do Indicador: 0 - 5. Participantes do mercado: 0 e 1 = Big Players! 2 e 3 = Dia normal. 4 e 5 = Mo

Three Triple Exponential Average oscillators merged into one. Fast period will pull on the slower period, and the slower will smooth out the faster and avoid early positions. You can use 2 fast and 1 slow, or Fibonacci range or 2 slow, 1 fast. NOW FREE. But please consider supporting me by buying my 2 for sale indicators.
You can use this as an entry indicator and exit indicator. Open when the tripleTRIX line crosses the zero line and close when it starts to reverse. When the peaks get bigger,

RISK TO REWARD TOOL for MT5 with UI on chart: (creates similar RR boxes like on tradingview) -creates and deletes draggable boxes on chart, ANY SYMBOL, ANY TF. Menu buttons:
NEW BUY, NEW SELL, DELETE ALL, ( and minimize) -draggable target TP level
-draggable SL limit level
-text labels with pips SL TP, RR ratio-there is no limit of boxes
-but program remembers first 100 boxes after changing input. there is parameter "delete_on_init" so false = every created box stays as it is, true

Gatotkaca Support Resistance Trendline Indicator is a simple indicator that detects support, resistance and trendlines. It will helps you find breakout momentum based on lines calculated by this indicator. This is conceptually based on fractals, but with customizable periods. Compatible for any timeframes. You can customize how this indicator work by setting up the period input.
FREE
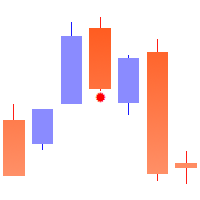
モメンタムリバーサルは、価格の動きとバーの形成の強さの分析に基づいて、可能な逆転ポイントと修正の開始を検出するための強力なツールです。
_________________________________
インジケータ信号の使用方法:
この指標は、新しい価格バーが表示された後に信号を生成します。 価格が指定された方向の臨界点を突破した後、生成された信号を使用することをお勧めします。 インジケーターは信号を再描画しません。
_________________________________
インジケータパラメータは、信号の矢印の表示スタイルを変更することを示唆しています。 計算に使用されるパラメータを変更することは提供されていません-これは私の製品の哲学によるものです:安定性と客観性。
_________________________________
ご質問やご提案のいずれかが歓迎されており、プライベートメッセージで送信することができます
_________________________________
興味のあるすべての人に事前に感謝し、市場を征服することに幸運を
FREE
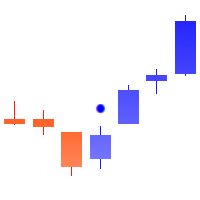
Correction Breakthroughは、価格形成の分析と価格変動の慣性に基づいて、修正または取引回廊から可能なブレイクアウトポイントを検出するための強力なツールです。
_________________________________
インジケータ信号の使用方法:
インジケータは、現在の価格バーの間に信号を生成します。 生成された信号は、信号矢印の上/下の信号バーを閉じた後に使用することをお勧めします。 インジケーターは信号を再描画しません。
_________________________________
インジケータパラメータは、信号の矢印の表示スタイルを変更することを示唆しています。 計算に使用されるパラメータを変更することは提供されていません-これは私の製品の哲学によるものです:安定性と客観性。
_________________________________
ご質問やご提案のいずれかが歓迎されており、プライベートメッセージで送信することができます
_________________________________
興味のあるすべての人に事前
FREE
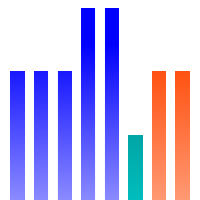
Market Paletteは、慣性と価格変動の加速に基づいて取引の決定をフィルタリングするための強力なツールです。
_________________________________
インジケータ信号の使用方法:
このインジケーターは、3つの異なる色のヒストグラム信号を生成します。 標準的な配色では、青色の列が表示されたときは、ロングポジションのみを保持し、赤色の列が表示されたときは短いもののみを保持し、灰色の列が表示されたときは取引行動を控えることをお勧めします。 より高い列の出現は、価格の動きの臨界点の形成を意味する-列の色を変える可能性が高い。
_________________________________
インジケーターのパラメーターは、ヒストグラム表示のスタイルを変更することを示唆しています。 計算に使用されるパラメータを変更することは提供されていません-これは私の製品の哲学によるものです:安定性と客観性。
_________________________________
ご質問やご提案のいずれかが歓迎されており、プライベートメッセージで送信することが
FREE
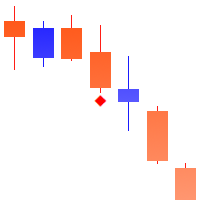
慣性のポイントは、価格変動の慣性を計算するという考えに基づいて、価格の動きの臨界点を検出するための強力なツールです。
_________________________________
インジケータ信号の使用方法:
この指標は、新しい価格バーが表示された後に信号を生成します。 価格が指定された方向の臨界点を突破した後、生成された信号を使用することをお勧めします。 インジケーターは信号を再描画しません。
_________________________________
インジケータパラメータは、信号の矢印の表示スタイルを変更することを示唆しています。 計算に使用されるパラメータを変更することは提供されていません-これは私の製品の哲学によるものです:安定性と客観性。
_________________________________
ご質問やご提案のいずれかが歓迎されており、プライベートメッセージで送信することができます
_________________________________
興味のあるすべての人に事前に感謝し、市場を征服することに幸運を祈っています!
FREE
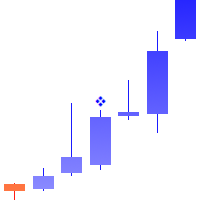
加速ポイントは、価格変動の加速を計算するという考えに基づいて、価格変動の臨界点を検出するための強力なツールです。
_________________________________
インジケータ信号の使用方法:
この指標は、新しい価格バーが表示された後に信号を生成します。 価格が指定された方向の臨界点を突破した後、生成された信号を使用することをお勧めします。 インジケーターは信号を再描画しません。
_________________________________
インジケータパラメータは、信号の矢印の表示スタイルを変更することを示唆しています。 計算に使用されるパラメータを変更することは提供されていません-これは私の製品の哲学によるものです:安定性と客観性。
_________________________________
ご質問やご提案のいずれかが歓迎されており、プライベートメッセージで送信することができます
_________________________________
興味のあるすべての人に事前に感謝し、市場を征服することに幸運を祈っています!
FREE
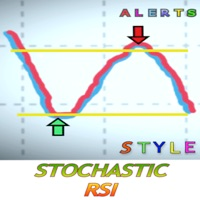
ストキャスティックRSIとは?
ストキャスティックRSI(StochRSI)は、0から1(またはいくつかのチャートプラットフォームでは0から100)の間で、標準的な価格データではなく、相対強度指数(RSI)の値のセットにストキャスティックオシレータ式を適用することによって作成されるテクニカル分析で使用される指標です。このバージョンでは、本当に良い機会を逃さないための警告が含まれています。あなたは、シグナル買い注文またはシグナル売り注文を受信したいときにパラメータを設定します。シグナルを受信するためには、MetaQuotes IDを介してデスクトップ版とMetatraderアプリを接続する必要があります。MetaQuotes IDは、MT4/5アプリのSetting >>Chat and Messagesで確認できます。デスクトップ版では、Tool>>Option>>Notificationsにあります。デスクトップ版にIDを入れ、通知をアクティブにすれば準備完了です。
MT4版を試すにはこちら
スタイルが重要だから
私はそれがろうそくの色、明るいまたは暗いへの背景を変更し、

Gann 9+ Indicator Introduction The "Gann Matrix Chart" is the most simple and clear technical analysis in Gann theory, which is the calculation tool that Gann has always been committed to using. It is the essence of Gann's whole life. The Gann 9+ indicator uses the matrix chart to find the future high or low points of stocks or futures. Indicator Input: The base and step size can be set as 1 by default; When the multiple is -1, the multiple will be automatically obtained, or it can be filled in

Of all the tasks that a trader faces when entering a market, the main task is to determine the direction of the trend. The Artificial Power indicator will help you with this task. Whatever goal the trader sets for himself, the tool to achieve it will be mainly trend indicators.
The Artificial Power indicator without delay and redrawing is used by traders in trend strategies in trading on financial markets (Forex, CFD, binary options). This indicator is designed to detect trends in price moveme
This indicator scans the 1-3 Trendline pattern . The indicator is a 100 % non repaint low risk breakout system . The patterns are formed around swing high and swing lows which make them a low risk pattern with high reward.
PATTERN BACKGROUND The 1-3 Trendline Breakout pattern is formed by four(4) points which are composed of three (3) primary points and the pattern neck. A trendline is always formed by the point 1 and the neck of the pattern . When price breaks out of the trendline formed , it

M & W Pattern Pro is an advanced scanner for M and W patters , it uses extra filters to ensure scanned patterns are profitable.
The indicator can be used with all symbols and time frames.
The indicator is a non repaint indicator with accurate statistics calculations.
To use , simply scan the most profitable pair using the statistics dashboard accuracy , then enter trades on signal arrow and exit at the TP and SL levels.
STATISTICS : Accuracy 1 : This is the percentage of the times price hits TP
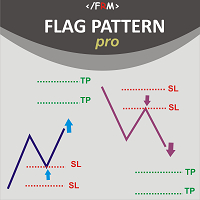
Flag Pattern pro is a Price Action (PA) analytical tool that scans the continuation patterns known as "Flag and Pennant Patterns" .
Flag and Pennant patterns are continuation patterns characterized by a move in a previous trend direction after a shallow retracement usually below 50% of the original move . Deep retracements can however be sometimes found at the 61.8 % levels. The original move is know as the flag pole and the retracement is called the flag.
Indicator Fundam
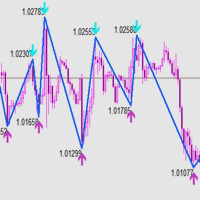
本指标 基于 Zigzag 基础上... 增加了: 1.增加了箭头指示,使图表更鲜明 2.增加了价格显示,使大家更清楚的看清价格. 3.增加了报警等设置,可以支持邮件发送 原指标特性: 1.基本的波段指标构型. 2.最近的2个ZIGZAG点不具有稳定性,随着行情而改变,(就是网友所说的未来函数) 3.原指标适合分析历史拐点,波段特性,对于价格波动有一定的指导性.
Zigzag的使用方法一 丈量一段行情的起点和终点 (1)用ZigZag标注的折点作为起点和终点之后,行情的走势方向就被确立了(空头趋势); (2)根据道氏理论的逻辑,行情会按照波峰浪谷的锯齿形运行,行情确立之后会走回撤行情,回撤的过程中ZigZag会再次形成折点,就是回撤点; (3)在回撤点选择机会进场,等待行情再次启动,止损可以放到回撤的高点。 一套交易系统基本的框架就建立起来了。 Zigzag的使用方法二 作为画趋势线的连接点 趋势线是很常见的技术指标,在技术分析中被广泛地使用。 但一直以来趋势线在实战中都存在一个BUG,那就是难以保证划线的一致性。 在图表上有很多的高低点,到底该连接哪一个呢?不同的书上画趋势线的方法
FREE
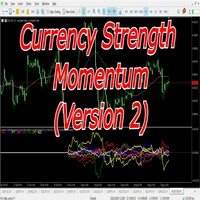
The currency strength momentum has a lot of similarities with currency strength meter presented in the previous page, but the difference are much more pronounced. You can try putting both in the same chart and see the difference in results. Currency strength momentum measures strength of a currency based on (you guess it) it's momentum relative to other currencies, while currency strength meter measures the strength of a currency based on pips it has moved in a certain direction.
FREE

Market Profile 3 MetaTrader 5 indicator version 4.70— is a classic Market Profile implementation that can show the price density over time, outlining the most important price levels, value area, and control value of a given trading session. This indicator can be attached to timeframes between M1 and D1 and will show the Market Profile for daily, weekly, monthly, or even intraday sessions. Lower timeframes offer higher precision. Higher timeframes are recommended for better visibility. It is als
FREE
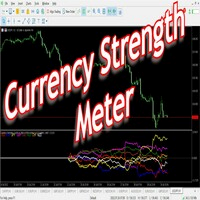
Have you ever wondered which currency is the strongest at any particular time? Or which currency pair is trending the most. Well, the currency strength meter helps with just that. It compares USD , EUR , AUD , CHF , GBP , CAD and NZD depending on the timeline you have chosen in settings, and ranks them on the number of pips each has moved compared to the rest. N/B: All currency charts of the above pairs must have loaded. You can do this by highlighting all major and minor currencies in
FREE
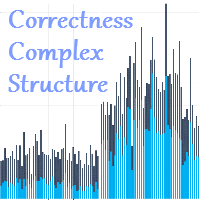
The Correctness Complex Structure indicator displays the complex structure of the bar, taking into account tick volumes in digital terms. How to interpret the information provided by the indicator. It's very simple, it's enough to analyze the chart. We will explain the work using an example, take the EURUSD instrument on the D1 timeframe, install this indicator and analyze the information provided by the indicator. The indicator works in the bottom of the chart and gives the result in the form
CalcFlat Creative is a flat indicator.
This is a more advanced version of the CalcFlat indicator. Three lines have been added for this indicator, which significantly improve the performance of the predecessor indicator. In addition to the two existing levels that the user reacted to and which were static, now the indicator has three dynamic lines on top of the main chart and interpreted as: signal line base, signal minimum, signal maximum.
These lines are formed due to the additional indicato

Presentation
Another indicator that makes scalping on tick charts easier, it displays an Heiken Ashi graph in Ticks.
It allows to detect entry points and trend reversals. Recommended number of ticks in a candle : 5, 13 or 21.
Parameters Ticks in candle: Number of ticks in a candle (default 5), Displays Trend arrows : displays a trend arrow based on EMA8 and EMA20 crossing, Displays MM50, Displays MM100, Max Candle (CPU): number of candles max to manage, low value will save ressources of your
FREE
** All Symbols x All Timeframes scan just by pressing scanner button ** ***Contact me to send you instruction and add you in "RSI scanner group" for sharing or seeing experiences with other users. + FREE Trading Utility MT5
Introduction RSI divergence is a main technique used to determine trend reversing when it’s time to sell or buy because prices are likely to drop or pick in the charts. The RSI Divergence indicator can help you locate the top and bottom of the market. This indicator finds
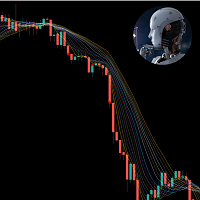
This indicator is very useful in observing the direction of the market. It allows users to enter multiple MA lines with specific display method. In addition, it is also possible to change the candle color same to color of the background of chart, so that we only focus on the MA lines. When a signal appears, represented by a red or green dot, we can consider opening a sell (red dot) or buy (green dot) order. Note: it need to set stoploss at the highest value of MA lines (with sell order) or lowe
FREE
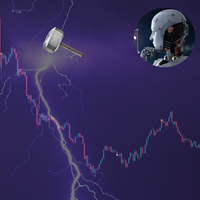
This indicator combines RSI(14) and ADX(14) to find out the signal that price moves strongly. When it appears signal (represent by the yellow dot), and price is going down, let consider to open a SELL order. Otherwise, let consider to open a BUY order. In this case, the strength of moving is strong (normally after sideway period), so we can set TP by 3 times of SL .
FREE

トレンドラインは、外国為替取引におけるテクニカル分析の最も重要なツールです。残念ながら、ほとんどのトレーダーはそれらを正しく描画していません。自動トレンドラインインジケーターは、市場のトレンドの動きを視覚化するのに役立つ本格的なトレーダー向けのプロフェッショナルツールです。
トレンドラインには、強気トレンドラインと弱気トレンドラインの2種類があります。
上昇トレンドでは、外国為替トレンドラインは価格変動の最低スイングポイントを介して描画されます。
少なくとも2つの「最低安値」を接続すると、トレンドラインが作成されます。
下降トレンドでは、トレンドラインは価格変動の最も高いスイングポイントを介して描画されます。
少なくとも2つの「最高値」を接続すると、トレンドラインが作成されます。
トレンドラインが壊れたとき?
弱気のろうそくが強気のトレンドラインの下で閉じ、ろうそくの高さがトレンドラインの上にあるとき、強気のトレンドラインは壊れます。
強気のろうそくが弱気のトレンドラインの上で閉じ、ろうそくの安値がトレンドラインの下にあるとき、弱気のトレンドラインは壊れます。
トレ

これは、トレンドしひょー指標は、あか赤とみどり緑のじっせん実線をはんえー反映して、しじょー市場かかく価格のへんか変化をはんえー反映して、じっせん実線のいろ色のへんか変化は、しじょー市場のへんか変化がはっせー発生しているかのー可能せー性がひじ ょー非常にたかい高いです!
みどり緑のせん線はしじょー市場かかく価格がうえ上ます升しているきかん期間をしめし示し、あか赤のせん線はしじょー市場かかく価格がげらく下落しているきかん期間をしめし示します。 この メトリクス を より よく しよー 使用 する ため に 、 この メトリクス を こーにゅー 購入 し て しよー 使用 する まえ 前 に 、 この メトリクス の むりょー 無料 デモ ばん 版 を ダウンロード し て テスト する こと を お すすめ 勧め し ます

Trading Direction is an indicator that will never go against a long trend, stable, accurate and without the slightest redrawing. The indicator goes through the whole story! You can find settings for any tool for which there is a free TDO utility .
Trade rules. When a signal appears (always at the bar opening price), we immediately close the opposite position, if it exists, despite the fact of a drawdown or profit. And we open a new position following the arrow in the right direction. And these

The Recuroid indicator shows very good entry points. Just look at the screenshots, then download the free version and look in the strategy tester and see for yourself.
The system is based on two key algorithms. The first algorithm (managed) creates a system of balanced transition from the buy zone to the sell zone and vice versa, draws arrows and lines, and forms entries. The second algorithm (managing) corrects the initial data for the first algorithm (managed) by measuring virtual windows, t

Introduction to Chart Pattern MT Chart Pattern MT is a chart pattern scanner to detect the triangle pattern, falling wedge pattern, rising wedge pattern, channel pattern and so on. Chart Pattern MT uses highly sophisticated chart pattern detection algorithm. However, we have designed it in the easy to use with intuitive user interface. Chart Pattern MT will show all the patterns in your chart in the most efficient format for your trading. You do not have to do tedious manual pattern detection an
Relative Volume or RVOL is an indicator that averages the volume of X amount of days, making it easy to compare sessions volumes.
The histogram only has 3 colors:
Green - Above average volume
Yellow - Average volume
Red - Below average volume
The default setting is 20 days, which corresponds more or less to a month of trading.
In this version is possible to choose between tick and real volumes (if you are using a broker which offers future contracts)
With the data obtained from this in
FREE

This is a buyer and seller aggression indicator that analyzes the shape of each candle and project this data in a histogram form. There are 4 histograms in one. On the front we have two: Upper - Buyer force. Lower - Seller force. At the background we also have two histogram, both with same color. They measure the combined strenght of buyers and sellers. This histograms can be turned off in Input Parameters. It is also possible to have the real or tick volume to help on this force measurement. IN
FREE
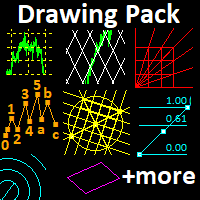
This indicator provides several drawing tools to assist in various methods of chart analysis.
The drawings will keep their proportions (according to their handle trendline) across different chart scales, update in real time, and multiple drawings are supported.
#
Drawing Option
Description
1 Grid box draggable boxed grid, user defines rows x colums, diagonal ray option 2 Grid partial or fullscreen grid, sized by handle line 3 Grid flex a diagonal grid, sized and sloped by handle line
4 Cyc

This indicator is designed for those people, who want to trade and earn on any instruments and timeframes .The indicator gives out very good points to enter the market,it's very easy to trade,the arrows will show when to open trades,set and trade without thinking about anything,stop loss and take profit,set each one yourself,it all depends on your trading style,someone scalps and someone holds trades on a few days..In the strategy tester, the indicator simply cannot physically show accurate res

This indicator provides common shapes as drawing object options. The shapes are rotatable, resizable, draggable, and will keep their proportions (according to their handle trendline) across different chart scales. Multiple drawings are supported.
Shapes: Square Rhombus
Triangle (quadrilateral & isosceles) Circle (grid, overlapped grid, flexi grid, rotatable grid, concentric circles) Features: rays (all object edges will be rays) show/hide each individual drawing type, or all delete last drawn ob
FREE
Divergence is one best ways to trade the financial market as it is a leading indicator of price action that detect high probability reversal and continuation setups. The AlgoKing Divergence Detector is an RSI and Stochastics Indicator with Divergence Detection. Features Hidden Divergence for trend continuation. Standard or Normal Divergence for trend reversal. Screen Alerts. MetaQuotes Notifications. Email Notifications. RSI Indicator built in. Stochastics Indicator built in. Types of Divergen
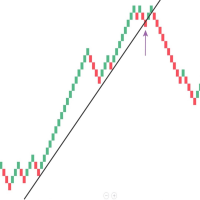
Mean Renko Bars are used for alternate price charting. Unlike the usual time framed chart – where every candle represents a fixed time interval – the goal of Renko chart is to display price movement in increments, called bricks. Best with the momentum strategies. Can make some Algo with this candel ---- ---- ---- ---- ---- ---- ---- ---- ---- ---- Support: primecapitalvn@ gmail. com
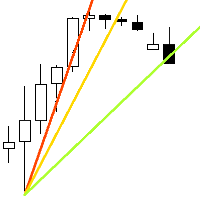
速度の抵抗ラインは傾向および抵抗ラインを定めるための強力な用具である。 この指標は、チャートの極値と特別な数式を使用して線を構築します。 指標は、トレンドの方向とピボットポイントを決定するために使用することができます。
<---------------------------->
指標パラメータ:
"Depth of search" -チャートの極端な検索の深さ(バー単位) "Back step of search" -極端な間の最小距離(バー単位) "Deviation of price" -同じタイプの両極端間の許容価格差 "Line color" -対応するインデックスを持つ線の色 "Line style"-対応するインデックスを持つラインスタイル "Line width"-対応するインデックスを持つ線幅 <---------------------------->
あなたは本の中でより多くの情報を見つけることができます"エドソン*グールドによる希少な著作のコレクション"またはプライベートメッセージで私
<---------------------------->
FREE
URトレンド枯渇
UR TrendExhaustion は、パラメータ値やその他の設定を扱いたくないトレーダーにとって最適なソリューションです。誰にとっても簡単で視覚的に理解できるものです。
UR TrendExhaustion を使用する利点:
パラメータなし チャートで何が起こっているかを最もよく表す 3 つの線があります: トレンド枯渇線、クジラ マネー ライン、リテール マネー ラインです。 インターフェイスは、両極端 (赤い領域) のいずれかのラインの枯渇を示しています。 最大の利点: 簡単で、すべてのアセットに合わせて調整できます。 ツールの最新情報を入手できる特別な電報チャットがあり、何か不足していると感じた場合はリクエストを送信することもできます!
なぜ UR TrendExhaustion なのか?
私はキャリアを通じて多くの種類のインジケーターをコーディングしてきましたが、チャート上の他のツールを必要とせずに取引するためのこのシンプルでありながら最高の (imo) ツールをコーディングするためにすべての知識を集めました。 分かりやすく、設定も簡単。
URの高値と安値
UR Highs&Lows は、価格の動きとそのボラティリティを詳細に分析し、価格が変動するチャネルを作成します。 そのチャネルは現在、オシレーターとして動き、価格の偏差と重ね合わされて、潜在的な枯渇と反転の可能性を示しています。
UR Highs&Lows を使用する利点:
パラメータなし 価格の動きを表す 3 本の線があります - 価格の平均である白線と、その極値である青線です。 ヒストグラムは、価格のコンテキストにおける最大偏差の視覚化です インターフェースは、両極端 (上部の赤と下部の青の領域) のいずれかの線の枯渇を示しています。 最大の利点: 簡単で、すべてのアセットに合わせて調整できます。 ツールの最新情報を入手できる特別な電報チャットがあり、何か不足していると感じた場合はリクエストを送信することもできます!
なぜ UR の高値と安値なのか?
このインジケーターは、スタンドアロンのエントリーまたはエグジット インジケーターとして使用できます。 価格に依存しているため、すべてのチャートに適用でき、偏差計算アルゴリズムは数年の経験と観察に基
MetaTraderマーケットはトレーダーのための自動売買ロボットやテクニカル指標を備えており、 ターミナルから直接利用することができます。
MQL5.community支払いシステムはMetaTraderサービス上のトランザクションのためにMQL5.comサイトに登録したすべてのユーザーに利用可能です。WebMoney、PayPal または銀行カードを使っての入金や出金が可能です。

取引の機会を逃しています。
- 無料取引アプリ
- 8千を超えるシグナルをコピー
- 金融ニュースで金融マーケットを探索