Volume Candlestick Bars
- インディケータ
- バージョン: 1.1

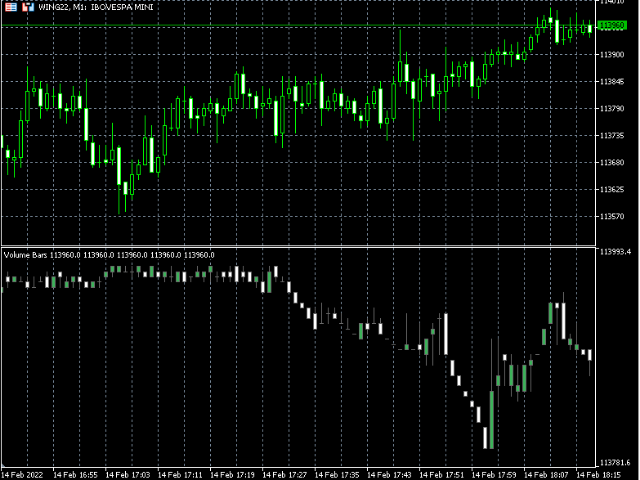
Indicator that show candlestick bars with an different sampling method than time fixed.
Real time data is sourced to the indicator and it may be used as substitute of the default graph.
Each bar is formed when a predefined volume of assets was dealt, showing in the graph the OHLC of this clustering.
The amount of bars is proportional to the amount of negotiations instead of a sample in a fixed amount of time.
If the broker doesn't show the real volume of the trades, this indicator won't work. This data is essential since it's the core of the sampling approach