 MetaTrader 5
 エキスパート
 インディケータ
 ライブラリ
ライブラリ
 ユーティリティ
 ウィジェット
 ルール
ルール
YouTubeにあるマーケットチュートリアルビデオをご覧ください
ロボットや指標を購入する
仮想ホスティングで
EAを実行
EAを実行
ロボットや指標を購入前にテストする
マーケットで収入を得る
販売のためにプロダクトをプレゼンテーションする方法
MetaTrader 5のための新しいテクニカル指標 - 176
 テクニカル指標からのシグナルは、株式および外国為替市場での取引の開始と終了に重要な役割を果たします。指標の本質は、将来の価格変動を予測することを目的とした金融銘柄価格の数学的変換です。
テクニカル指標をテストして、市場の動きとそれからの利益をより正確に予測します。
テクニカル指標からのシグナルは、株式および外国為替市場での取引の開始と終了に重要な役割を果たします。指標の本質は、将来の価格変動を予測することを目的とした金融銘柄価格の数学的変換です。
テクニカル指標をテストして、市場の動きとそれからの利益をより正確に予測します。 
Have you ever wondered which currency is the strongest at any particular time? Or which currency pair is trending the most. Well, the currency strength meter helps with just that. It compares USD , EUR , AUD , CHF , GBP , CAD and NZD depending on the timeline you have chosen in settings, and ranks them on the number of pips each has moved compared to the rest. N/B: All currency charts of the above pairs must have loaded. You can do this by highlighting all major and minor currencies in
FREE
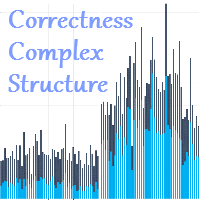
The Correctness Complex Structure indicator displays the complex structure of the bar, taking into account tick volumes in digital terms. How to interpret the information provided by the indicator. It's very simple, it's enough to analyze the chart. We will explain the work using an example, take the EURUSD instrument on the D1 timeframe, install this indicator and analyze the information provided by the indicator. The indicator works in the bottom of the chart and gives the result in the form
CalcFlat Creative is a flat indicator.
This is a more advanced version of the CalcFlat indicator. Three lines have been added for this indicator, which significantly improve the performance of the predecessor indicator. In addition to the two existing levels that the user reacted to and which were static, now the indicator has three dynamic lines on top of the main chart and interpreted as: signal line base, signal minimum, signal maximum.
These lines are formed due to the additional indicato

Market Profile 3 MetaTrader 5 indicator version 4.70— is a classic Market Profile implementation that can show the price density over time, outlining the most important price levels, value area, and control value of a given trading session. This indicator can be attached to timeframes between M1 and D1 and will show the Market Profile for daily, weekly, monthly, or even intraday sessions. Lower timeframes offer higher precision. Higher timeframes are recommended for better visibility. It is als
FREE

Presentation
Another indicator that makes scalping on tick charts easier, it displays an Heiken Ashi graph in Ticks.
It allows to detect entry points and trend reversals. Recommended number of ticks in a candle : 5, 13 or 21.
Parameters Ticks in candle: Number of ticks in a candle (default 5), Displays Trend arrows : displays a trend arrow based on EMA8 and EMA20 crossing, Displays MM50, Displays MM100, Max Candle (CPU): number of candles max to manage, low value will save ressources of your
FREE

** All Symbols x All Timeframes scan just by pressing scanner button ** ***Contact me to send you instruction and add you in "RSI scanner group" for sharing or seeing experiences with other users. + FREE Trading Utility MT5
Introduction RSI divergence is a main technique used to determine trend reversing when it’s time to sell or buy because prices are likely to drop or pick in the charts. The RSI Divergence indicator can help you locate the top and bottom of the market. This indicator finds
This indicator is very useful in observing the direction of the market. It allows users to enter multiple MA lines with specific display method. In addition, it is also possible to change the candle color same to color of the background of chart, so that we only focus on the MA lines. When a signal appears, represented by a red or green dot, we can consider opening a sell (red dot) or buy (green dot) order. Note: it need to set stoploss at the highest value of MA lines (with sell order) or lowe
FREE
This indicator combines RSI(14) and ADX(14) to find out the signal that price moves strongly. When it appears signal (represent by the yellow dot), and price is going down, let consider to open a SELL order. Otherwise, let consider to open a BUY order. In this case, the strength of moving is strong (normally after sideway period), so we can set TP by 3 times of SL .
FREE

トレンドラインは、外国為替取引におけるテクニカル分析の最も重要なツールです。残念ながら、ほとんどのトレーダーはそれらを正しく描画していません。自動トレンドラインインジケーターは、市場のトレンドの動きを視覚化するのに役立つ本格的なトレーダー向けのプロフェッショナルツールです。
トレンドラインには、強気トレンドラインと弱気トレンドラインの2種類があります。
上昇トレンドでは、外国為替トレンドラインは価格変動の最低スイングポイントを介して描画されます。
少なくとも2つの「最低安値」を接続すると、トレンドラインが作成されます。
下降トレンドでは、トレンドラインは価格変動の最も高いスイングポイントを介して描画されます。
少なくとも2つの「最高値」を接続すると、トレンドラインが作成されます。
トレンドラインが壊れたとき?
弱気のろうそくが強気のトレンドラインの下で閉じ、ろうそくの高さがトレンドラインの上にあるとき、強気のトレンドラインは壊れます。
強気のろうそくが弱気のトレンドラインの上で閉じ、ろうそくの安値がトレンドラインの下にあるとき、弱気のトレンドラインは壊れます。
トレ

これは、トレンドしひょー指標は、あか赤とみどり緑のじっせん実線をはんえー反映して、しじょー市場かかく価格のへんか変化をはんえー反映して、じっせん実線のいろ色のへんか変化は、しじょー市場のへんか変化がはっせー発生しているかのー可能せー性がひじ ょー非常にたかい高いです!
みどり緑のせん線はしじょー市場かかく価格がうえ上ます升しているきかん期間をしめし示し、あか赤のせん線はしじょー市場かかく価格がげらく下落しているきかん期間をしめし示します。 この メトリクス を より よく しよー 使用 する ため に 、 この メトリクス を こーにゅー 購入 し て しよー 使用 する まえ 前 に 、 この メトリクス の むりょー 無料 デモ ばん 版 を ダウンロード し て テスト する こと を お すすめ 勧め し ます

Trading Direction is an indicator that will never go against a long trend, stable, accurate and without the slightest redrawing. The indicator goes through the whole story! You can find settings for any tool for which there is a free TDO utility .
Trade rules. When a signal appears (always at the bar opening price), we immediately close the opposite position, if it exists, despite the fact of a drawdown or profit. And we open a new position following the arrow in the right direction. And these

The Recuroid indicator shows very good entry points. Just look at the screenshots, then download the free version and look in the strategy tester and see for yourself.
The system is based on two key algorithms. The first algorithm (managed) creates a system of balanced transition from the buy zone to the sell zone and vice versa, draws arrows and lines, and forms entries. The second algorithm (managing) corrects the initial data for the first algorithm (managed) by measuring virtual windows, t

Introduction to Chart Pattern MT Chart Pattern MT is a chart pattern scanner to detect the triangle pattern, falling wedge pattern, rising wedge pattern, channel pattern and so on. Chart Pattern MT uses highly sophisticated chart pattern detection algorithm. However, we have designed it in the easy to use with intuitive user interface. Chart Pattern MT will show all the patterns in your chart in the most efficient format for your trading. You do not have to do tedious manual pattern detection an

This is a buyer and seller aggression indicator that analyzes the shape of each candle and project this data in a histogram form. There are 4 histograms in one. On the front we have two: Upper - Buyer force. Lower - Seller force. At the background we also have two histogram, both with same color. They measure the combined strenght of buyers and sellers. This histograms can be turned off in Input Parameters. It is also possible to have the real or tick volume to help on this force measurement. IN
FREE
Relative Volume or RVOL is an indicator that averages the volume of X amount of days, making it easy to compare sessions volumes.
The histogram only has 3 colors:
Green - Above average volume
Yellow - Average volume
Red - Below average volume
The default setting is 20 days, which corresponds more or less to a month of trading.
In this version is possible to choose between tick and real volumes (if you are using a broker which offers future contracts)
With the data obtained from this in
FREE
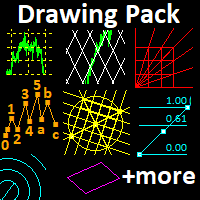
This indicator provides several drawing tools to assist in various methods of chart analysis.
The drawings will keep their proportions (according to their handle trendline) across different chart scales, update in real time, and multiple drawings are supported.
#
Drawing Option
Description
1 Grid box draggable boxed grid, user defines rows x colums, diagonal ray option 2 Grid partial or fullscreen grid, sized by handle line 3 Grid flex a diagonal grid, sized and sloped by handle line
4 Cyc

This indicator is designed for those people, who want to trade and earn on any instruments and timeframes .The indicator gives out very good points to enter the market,it's very easy to trade,the arrows will show when to open trades,set and trade without thinking about anything,stop loss and take profit,set each one yourself,it all depends on your trading style,someone scalps and someone holds trades on a few days..In the strategy tester, the indicator simply cannot physically show accurate res

This indicator provides common shapes as drawing object options. The shapes are rotatable, resizable, draggable, and will keep their proportions (according to their handle trendline) across different chart scales. Multiple drawings are supported.
Shapes: Square Rhombus
Triangle (quadrilateral & isosceles) Circle (grid, overlapped grid, flexi grid, rotatable grid, concentric circles) Features: rays (all object edges will be rays) show/hide each individual drawing type, or all delete last drawn ob
FREE
Divergence is one best ways to trade the financial market as it is a leading indicator of price action that detect high probability reversal and continuation setups. The AlgoKing Divergence Detector is an RSI and Stochastics Indicator with Divergence Detection. Features Hidden Divergence for trend continuation. Standard or Normal Divergence for trend reversal. Screen Alerts. MetaQuotes Notifications. Email Notifications. RSI Indicator built in. Stochastics Indicator built in. Types of Divergen
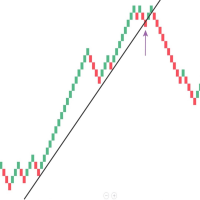
Mean Renko Bars are used for alternate price charting. Unlike the usual time framed chart – where every candle represents a fixed time interval – the goal of Renko chart is to display price movement in increments, called bricks. Best with the momentum strategies. Can make some Algo with this candel ---- ---- ---- ---- ---- ---- ---- ---- ---- ---- Support: primecapitalvn@ gmail. com
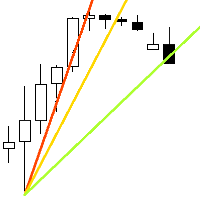
速度の抵抗ラインは傾向および抵抗ラインを定めるための強力な用具である。 この指標は、チャートの極値と特別な数式を使用して線を構築します。 指標は、トレンドの方向とピボットポイントを決定するために使用することができます。
<---------------------------->
指標パラメータ:
"Depth of search" -チャートの極端な検索の深さ(バー単位) "Back step of search" -極端な間の最小距離(バー単位) "Deviation of price" -同じタイプの両極端間の許容価格差 "Line color" -対応するインデックスを持つ線の色 "Line style"-対応するインデックスを持つラインスタイル "Line width"-対応するインデックスを持つ線幅 <---------------------------->
あなたは本の中でより多くの情報を見つけることができます"エドソン*グールドによる希少な著作のコレクション"またはプライベートメッセージで私
<---------------------------->
FREE
URトレンド枯渇
UR TrendExhaustion は、パラメータ値やその他の設定を扱いたくないトレーダーにとって最適なソリューションです。誰にとっても簡単で視覚的に理解できるものです。
UR TrendExhaustion を使用する利点:
パラメータなし チャートで何が起こっているかを最もよく表す 3 つの線があります: トレンド枯渇線、クジラ マネー ライン、リテール マネー ラインです。 インターフェイスは、両極端 (赤い領域) のいずれかのラインの枯渇を示しています。 最大の利点: 簡単で、すべてのアセットに合わせて調整できます。 ツールの最新情報を入手できる特別な電報チャットがあり、何か不足していると感じた場合はリクエストを送信することもできます!
なぜ UR TrendExhaustion なのか?
私はキャリアを通じて多くの種類のインジケーターをコーディングしてきましたが、チャート上の他のツールを必要とせずに取引するためのこのシンプルでありながら最高の (imo) ツールをコーディングするためにすべての知識を集めました。 分かりやすく、設定も簡単。
URの高値と安値
UR Highs&Lows は、価格の動きとそのボラティリティを詳細に分析し、価格が変動するチャネルを作成します。 そのチャネルは現在、オシレーターとして動き、価格の偏差と重ね合わされて、潜在的な枯渇と反転の可能性を示しています。
UR Highs&Lows を使用する利点:
パラメータなし 価格の動きを表す 3 本の線があります - 価格の平均である白線と、その極値である青線です。 ヒストグラムは、価格のコンテキストにおける最大偏差の視覚化です インターフェースは、両極端 (上部の赤と下部の青の領域) のいずれかの線の枯渇を示しています。 最大の利点: 簡単で、すべてのアセットに合わせて調整できます。 ツールの最新情報を入手できる特別な電報チャットがあり、何か不足していると感じた場合はリクエストを送信することもできます!
なぜ UR の高値と安値なのか?
このインジケーターは、スタンドアロンのエントリーまたはエグジット インジケーターとして使用できます。 価格に依存しているため、すべてのチャートに適用でき、偏差計算アルゴリズムは数年の経験と観察に基

LEVELS (extremes, stops, takeprofits)
The indicator visualizes the levels of recent price extremes. Such values are searched for by means of an internal algorithm. It does not redraw. It is used to change stop order placement levels (done manually by the user, the indicator only visualizes the level). It can also be used for taking partial profits at opposite levels of the movement. The indicator will allow you to take most of the strong movements. You don't have to worry about exiting a positi
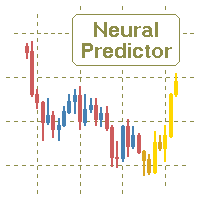
The indicator refers to the means of probabilistic analysis. Prediction is performed by the Monte Carlo method together with a mathematical model of a neuron. But, the modeling of samples for this method is made not artificially, but comes from the original "nature", that is, from history. The number of samples and the detail of their modeling is achieved using the lower (relative current) timeframe.
Indicator algorithm :
In general terms, the algorithm boils down to the fact that the indica
Impulse Creative is a more advanced indicator of impulses for making decisions (compared to the Impulse Change indicator). The main task of this indicator is to warn the trader about the moment of price changes and also to give a command to enter according to the current trend. To determine the trend, use any other tool, this development forms only an entry point but not the entry direction.
First, look at the screenshots and notice that we see clearly expressed figures that the indicator form

Shift Trend is an indicator of the formation of entry signals, entry points. The indicator must be selected to work for a sufficiently short period of time. But who works in short ranges, then this indicator is well suited.
Options: Length1 - The first parameter. Length2 - Second parameter; PointActivity - Parameter controlling peak levels. PointMinDist - The parameter that sets the minimum distance. AvgLengthBar - Bar averaging.
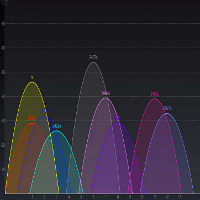
Change Analyzer - The indicator can be called an indicator of market balance. Since the indicator is on the zero line, then the market is balanced in a certain timeframe and a certain instrument.
Based on two virtual windows and their mutual placement, this graph is built. As a result of its work, the price chart normalizes relative to the zero line, which helps to draw conclusions about the price behavior. The indicator is somewhat reminiscent of the overbought and oversold system, but the al

For Nasdaq trading, the most important principle is to know the trend of the fund.
This indicator with 6 green and red lights provides you with the daily path of this important indicator.
This indicator has been tested for 6 months and has a win rate of over 85%.
Be sure to contact me before purchasing to get the necessary instructions on how to use and set up this indicator.
You should use a broker that has dollar index, vix, and commodities. MT4 Version
You can contact us via Instagram, Teleg
FREE

With Renko Plus you can use the features in the Indicator functionality, just add it to the Metatrader5 chart.
The Renko chart is a type of chart, developed by the Japanese, that is constructed using price movement rather than standardized prices and time intervals like most charts. It is believed to be named after the Japanese word for bricks, "renga", as the graphic looks like a series of bricks.
A new brick is created when the price moves a specified pri
Acceleration Force Meter Indicator - is a trend system that join market in trend phase and after trend pull-back. AFM indicator - is the system that watchs market phases from flat to extreme volatility and prefers to enter in market when it's active, more volatility, ignoring most flat places. This is 100% complete trading system including enter and exit points. It works well with profitable trades - maximizing take profit targets(analysis of recent market volatility, its pips range to adapt cur

Overlay indicator on chart between 2 pairs
The Timeframe Overlay indicator displays the price action of timeframes on a single chart, allowing you to quickly assess different timeframes from a single chart. The advantage is to observe and follow the correlations of price movements in real time to help you find potential trades at a glance.
---- Symbol 1 ----
Symbol = EURUSD
Correlation Inverse = false
Display = true
Ratio
FREE

Golden section price action indicator - is a trend-scalping complete system with enter and exit points. Indicator is based on most powerfull price action japan patterns that are filtered by volume, volatility, market phase. Pattern is not a simple combinations of candles. Patterns must have "weight" to move market in right direction. "Weight" - is the summary of pattern's volume, the size of pattern candles according to last average volatility and ofcourse pattern must appear in correct market p
Identification of support and resistance areas
A useful indicator for traders
completely free
Can be used in all symbols
Can be used in all time frames
It has three different trends: short term, medium term, long term
Settings:
Clr1,2: You can change the color of the lines
Type Trend: You can determine the trend
Message me for questions, criticism and suggestions
FREE
Multi-Timeframe Chart Overlay Indicator
The Timeframe Overlay indicator displays price action for multiple timeframes on a single chart, allowing you to quickly assess different timeframes from a single chart. The advantage is to observe and follow the correlations of price movements in real time to help you find potential trades at a glance.
---- Symbol 1 ----
Symbol = EURUSD
Correlation Inverse = false
Display = true
Ratio
FREE
AlgoKing Chandelier Exit Indicator (MT5)
The Chandelier Exit Indicator is a volatility based indicator that maximizes returns using the Average True Range (ATR) value and the highest high or lowest low of a period. Benefits Should be used as a trailing stop. Helps you exit a position when you have a respectable profit. Identifies a high probability of a trend reversal when the price moves against the prevailing trend by a distance equal to 3x the average volatility. Join the AlgoKing Lightning

Diagnosis of major and minor pivot
Trend detection
with many signals
Can be used in all symbols
Can be used in all time frames
Settings:
Back Show: The number of candles it displays
If you need any adjustments, or have any questions or suggestions, message me
How to trade:
Blue: sell signal
Red: buy signal
Blue and red at the same time: no signal
Exit signal: Opposite signal

Forecasting the future by combining trend and average price
with many signals
Can be used in all symbols
Can be used in all time frames
Settings:
BackShow: The number of candles displayed
Osi: Main setting, the larger the number, the longer the trend
If you need more settings, or have any questions or suggestions, message me
How to trade:
Blue: sell signal
Red: buy signal
Blue and red at the same time: no signal
UR ダイバージェンススポッター
UR DivergenceSpotter は、長年の経験の結果であり、時には最も簡単な方法が最善です。 いくつかの指標の間には良好な相関関係がありますが、それらが一致しない場合 (価格は「再調整」しようとします)、UR DivergenceSpotter でシグナルを受け取るのはその瞬間です。
UR Divergence Spotter を使用する利点:
パラメータなし ろうそくの作成後に再描画しません シグナルが有効でなくなった場合のシグナル (つまり、トレードをより長く保持し、ストップ ロスを BE に設定して乗り、部分的な利益を得るか、完全に閉じることができます!)。 この指標は、長年の経験と観察の結果です。 それはしっかりしていて、テスト済みです。 より良い結果とより安全な信号を得るには、より高い時間枠 (h1/h4) で使用するのが最適です。
加えて、UR TrendExhaustion や UR VolumeTrend などの私の他のインジケーターと一緒に使用して、シグナルの精度を高めることもできます。 ツールの最新情報を入手

UR ボリュームトレンド
UR VolumeTrend は、出来高の継続的な傾向を示す最も明確な出来高インジケーターです。 UR TrendExhaustion などの他のインジケーターと完全に連携して、ローカルのトップとボトムを示します。
パラメータは 2 つだけに制限されています。値が高いほど、トレンドが長く表示されます。 極端な勾配は、潜在的な反転を捉えるためにボリュームが枯渇する可能性を示しています。 2 本の線 - 出来高の傾向と平均です。 最大の利点: 簡単で、すべてのアセットに合わせて調整できます。 ツールの最新情報を入手できる特別な電報チャットがあり、何か不足していると感じた場合はリクエストを送信することもできます!
UR VolumeTrend を選ぶ理由
トレンドを捉えるには出来高が鍵となることは誰もが認めるところです。 このオシレーターは、1 つの使いやすいインジケーターに圧縮されたすべてのボリューム ツールの合計です。 見やすい方法で正/負のボリュームを示します。 背後にあるインターフェイスは、ボリュームが過去に比べて使い果たされている可能性があ

A Good , Easy , Readable and handy indicator for experienced and professional traders. It gives bounded signals between zero and one. Easy for investors to comprehend. It gives near and longer trading outlook to investors and helps them to find good opportunities. Indicator gives zero signal on price downturns and signal value equals to one on price upturns. Once again a new type of indicator and rangebound between zero and one .
Sales Sales for seasonal traders.A new type of indicator for Professional and Experienced Traders. Specifically designed for trend identification. A great tool for investors to invest at the right and suitable time for decent trading. You can present it to your potential clients and customers for their satisfaction. A very handy and trendy tool. Easy to read , comprehend and user friendly. By this tool you can easily identify the potential to enter in trading and low potential to exit.
It c

Impulse Change is an indicator of impulses for decision making. The main task of this indicator is to warn the trader about the moment of price changes.
Do you often doubt when to make a decision? Leave the market or wait? This indicator is for you, Impulse Change will help you and provide a clearly defined correct hint.
There are always moments in history in which the behavior of the market differs sharply from what happens for the longest periods of time, such uncharacteristic behavior can

In the Apple is a stable indicator of exit points, no signal will change or redraw.
The indicator displays buy and sell signals with recommended markers for exiting a position. Each exit marker is accompanied by an information mark about the profit from the operation. The label consists of two parts. The first label displays the profit from the last operation in instrument points, and the second label displays the total balance. The total balance starts to be calculated from the moment when th
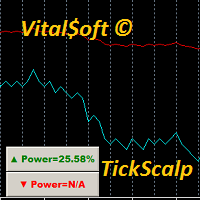
Free version of the TickScalper indicator. The Tick Scalp indicator is a trading assistant for a scalping trader. Works in a separate window. Tracks the momentary activity of the market, shows the graph of the movement of ticks and the strength of bulls or bears. Sometimes it can anticipate the beginning of a strong movement before any other indicators. Helps the trader to make a decision to open the desired order. Designed to work on any instrument. Used timeframes from M1 to M15. Has simple a
FREE
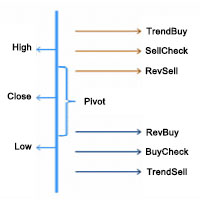
In the Forex trading system, the Pivot Points trading method is a classic trading strategy. Pivot Points is a very simple resistance support system. Based on yesterday’s highest, lowest and closing prices, seven price points are calculated, including one pivot point, three resistance levels and three support levels.
The resistance line and the support line are one of the tools that are often used in technical analysis, and the role of the support line and the pressure line can be mutually trans

!! FLASH SALE !! Over 80% off !! For ONE week only. Now only $47 - normally $297! >>> Ends on 30 June 2023 - Don't miss it!
Buy and Sell Arrows On The Chart According To Price Action Sends Alerts On MT5 To Your Phone To You Email
Does NOT repaint. Works on any pair, any timeframe.
10 Activations allowed so you are free from limitations. MT4 Version here . For spreads from a tiny 0.1 pips RAW/ECN Accounts, click here . Check out my Waka Esque EA signal here: >> High Risk Se
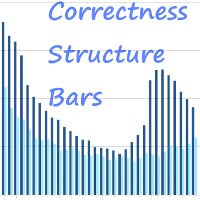
The Correctness Structure Bars indicator displays the bar structure in digital terms. How to Interpret the Information Provided by the Indicator It is very simple, all you have to do is analyze the chart. We will explain the work using an example, take the EURUSD instrument on the D1 timeframe, install this indicator and analyze the information provided by the indicator. The indicator works in the bottom of the chart and gives the result in the form of a histogram, that is, each bar (when a bar
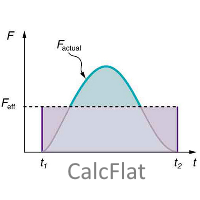
CalcFlat is a flat indicator.
At first glance, a simple indicator, but if you look at the screenshots for people who are not specialists, it may seem that the indicator is not very informative. But in fact, the indicator is very informationally active. It needs to be adjusted for each instrument and each timeframe. Very flexible in the settings there are two key settings, but they can significantly change the results of the display of the indicator. In addition to the main histogram, the indic
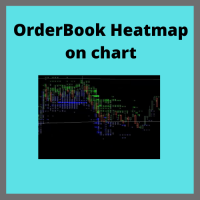
Ever needed a Boomap-like indicator for you MT5? Here you are!!
FULL WORKING DEMO VERSION available on Channel:
https://www.mql5.com/en/channels/011107AFAAE3D801
With this indicator you will see all the important levels, in which the largest bid and ask order are sitting. This indicator will show show all the history on limit order planed on the book. It will work only for futures broker who support level 2 order book. You can visualize the orders with colors and or with a text indicating the
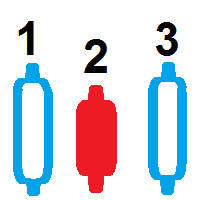
キャンドルカウンター このインジケーターはキャンドルをカウントし、 より長い時間枠に基づいてキャンドルの画面に数字を表示します 。 長期間 毎日の時間枠を「 BIgger Timeframe 」として選択し、時間枠が短い任意のグラフ内で実行できます。カウンターは 日足チャート に基づいてバーをカウントします。 時間枠「 H1 」をパラメーターとして渡すと、インジケーターはH1チャート内のバーをカウントする方法を認識します。これは、時間枠が短いチャートで実行する必要があります。 主なパラメータは「 大きい時間枠 」です。これは、使用している時間枠よりも長い時間枠であり、キャンドルカウントの基準となります。 番号を表示 このパラメーターに加えて、数字を表示するかどうかを指定するパラメーターがあります。画面の中央に数字を表示する必要はないため、 CTRL+D を押すとカウントを表示できます。 およびインジケーター「 BarIn(時間枠) 」を監視します。 マウス この領域は、画面上で マウスを動かす ときにも非常に便利です。そのため、マウスカーソルが通過している正確なバーを確認できます。画像
FREE

LT Support Resistance - サポート&レジスタンスを100%自動で識別 手動でサポートラインやレジスタンスラインを引く作業に、時間を取られて疲れていませんか?あるいは、重要なレベルをいつも見落としてしまい、悔しい思いをしていませんか?LT Support Resistanceは、そのような煩わしい作業をなくすために開発されました。複数のタイムフレーム(時間足)を同時に分析し、取引しているアセットの最も重要なゾーンを自動的に識別してチャート上に描画します。 == 重要レベルのスマート自動化 == 主観的で時間の Gann(ガン)かかる手動のライン引きとは異なり、このインジケーターは価格の履歴を分析し、重要な反転ポイントを特定して、価格が「実際に」意識しているサポート・レジスタンスラインを描画します。その結果、客観的で素早い、データに基づいた分析が可能になります。 == 主な特徴 == 100% 自動検出: 手動による分析なしでサポート/レジスタンスを識別 マルチタイムフレーム (MTF): M5(5分足)チャート上に、H1、H4、D1、W1のレベルを同時に表示可能 ス

Volatility Vision: Essential for Forex and Stock Markets
Volatility Visionを発見:あなたの取引革命 初心者とエキスパートトレーダーに最適 簡単スタートガイド: 当社の ユーザーマニュアル で効果的な使い方を学びましょう。
Volatility Vision インディケーターは、チャート上に正確なボラティリティレベルをマッピングする強力なツールです。この多用途なツールは、取引戦略に統合するために不可欠で、すべての通貨ペアおよび株式市場に対応しています。 ボラティリティの閾値 を活用して、一週間の取引を自信を持って管理しましょう。 Volatility Visionの利点 精度向上: ストキャスティクスオシレーターで一般的な誤検知を大幅に減少させます。 早期シグナル: RSIよりも早く取引シグナルをキャッチし、見逃した機会を捉えるのに役立ちます。 市場のリーダー: MACDが反応する前に積極的なインサイトを提供します。 信頼性: CCIからの誤信号の一般的な問題を回避します。 簡単な設定 開始するにはATR値を入力
Indicator developed by the Brazilian and analyst Odir Aguiar (Didi), consists of "Moving Averages", famously known as "Didi needles", where it allows the viewing of reversal points.
The concept is very simple, when you enter 3 Moving Averages on display, a period equal to 3, one equal to 8 and the other equal to 20, then the formation of the indicator that works in axis or line center equal to 0 (zero) appears. ). Moving averages must intersect when approaching line 0.
The scanner monitors 10
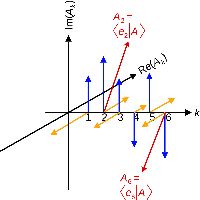
ComplexVectorHL is an indicator that characterizes the change in short-term market trends. The indicator is based on market analysis using the mathematical apparatus of complex numbers. The essence of the indicator is that it, with clear impulses, indicates the points in time when it is necessary to make decisions. The impulses are like a cardiogram showing the heartbeat of the market. The indicator has pulses only in one direction (unlike the previous development of ComplexVector), the pulses
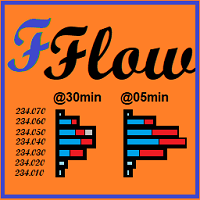
Tape Reading, flow monitoring.
FabFlowInPrice is a powerful indicator for those who like Tape Reading (Times & Trades). It presents the volumes traded at each price level, considering the purchase, sale and direct aggressions for each level. Excellent tool for market flow analysis. Thought of flow so monitor who is attacking the most, buyers, sellers or direct exchanges, thought FabFlowInPrice. The indicator displays information in 4 distinct and fixed periods, on any timeframe: @Day - All t
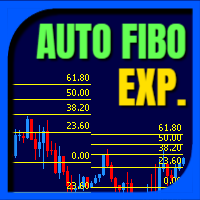
Auto Fibo Expansion is an indicator that projects the Fibonacci expansion levels above and below the opening price of the day. It does the calculation based on the previous day and projects the levels on the current day. It is very efficient to find "psychological" zones of support and resistance. Its appearance is all configurable and you can set up to 30 different levels. Enjoy! This is a free indicator, but it took hours to develop. If you want to pay me a coffee, I appreciate a lot <3 PayP
FREE
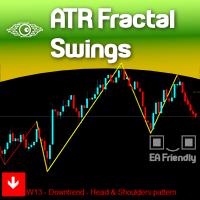
The concept of Fractals is everywhere in the respected Technical Analysis teaching and for a good reason: It Makes Sense! It is not a "self-fulfilling prophecy" like Fibonacci levels which we totally respect but we didn't explore yet, but this concept of Fractals can only be seen visually on your chart if we really SHOW that to you on your chart, right?
There are dozens of Zig-zag and Swing Legs indicators out there so you probably would be wondering: Why our indicator is different? Because we a

This is the famous Sunflower indicator for Metatrader5. This indicator marks possible tops and bottoms on price charts. The indicator identifies tops and bottoms in the asset's price history, keep in mind that the current sunflower of the last candle repaints, as it is not possible to identify a top until the market reverses and it is also not possible to identify a bottom without the market stop falling and start rising. If you are looking for a professional programmer for Metatrader5, please
FREE

Klinger Volume Oscillator (KVO) - A Powerful Trend & Momentum Indicator This is an enhanced version of the Klinger Volume Oscillator (KVO) , a widely used indicator designed to help traders identify momentum shifts, trend direction, and overbought/oversold conditions in the market. How the KVO Indicator Works: Volume-Based Trend Identification – Unlike traditional oscillators that rely solely on price movements, the KVO uses both price and volume to detect market trends and momentum shifts .
FREE

HEIKEN PLUS is the only indicator you really need to be a successful trader , without in depth knowledge of the forex trading or any tools.
Also there is automatically trading EA available now: https://www.mql5.com/en/market/product/89517? with superb SL/TP management! and sky high profit targets !!!
Very suitable tool for new traders or advanced traders too. This is MT5 version. For MT4 version visit : https://www.mql5.com/en/market/product/85235?source=Site
HEIKEN+ is a combination of 2 i

Numa folha qualquer
Eu desenho um sol amarelo
E com cinco ou seis retas
É fácil fazer um castelo
Corro o lápis em torno da mão e me dou uma luva
E se faço chover com dois riscos, tenho um guarda-chuva
Se um pinguinho de tinta
Cai num pedacinho azul do papel
Num instante imagino uma linda gaivota a voar no céu
Vai voando, contornando
A imensa curva norte-sul
Vou com ela viajando
Havai, Pequim ou Istambul
Pinto um barco à vela
Branco navegando
É tanto céu e mar num beijo azul
Entre as nuvens vem
FREE
SSLは「Semaphore Signal Level(セマフォ信号レベル)」の略です。このインジケーターは、ローソク足の高値と安値にそれぞれ適用された2本の移動平均線から構成されており、価格に追従するバンド(エンベロープ)を形成します。 買いシグナル: 価格が上側の移動平均線を終値で上抜けたとき。 売りシグナル: 価格が下側の移動平均線を終値で下抜けたとき。
特徴 すべての時間足に対応するマルチタイムフレームスキャナーを搭載し、新たなシグナルを自動検出します。 クラシックなSSLチャンネルをシンプルに実装しており、トレンド方向を簡単に見極められます。 MetaTraderのすべてのアラート機能に対応しています。
SSLの計算式 上側ライン: ローソク足の高値に基づく移動平均線。 下側ライン: ローソク足の安値に基づく移動平均線。
買いエントリー: 価格が上側SSLラインを終値で上抜けたとき。 買いエグジット: 価格が下側SSLラインを終値で下回ったとき。
売りエントリー: 価格が下側SSLラインを終値で下抜けたとき。 売りエグジット: 価格が上側SSLラインを終値で上回った

回帰取引を意味する専門的かつ定量的なアプローチを実装する独自の指標。これは、価格が予測可能かつ測定可能な方法で迂回して平均に戻るという事実を利用しており、非定量的な取引戦略を大幅に上回る明確な出入りルールを可能にします。 [ Installation Guide | Update Guide | Troubleshooting | FAQ | All Products ]
明確な取引シグナル 驚くほど簡単に取引できます カスタマイズ可能な色とサイズ パフォーマンス統計を実装します ほとんどの取引戦略を上回ります 適切なSLおよびTPレベルを表示します 電子メール/音声/視覚アラートを実装します
使い方
インディケータは、より高い時間枠からの完全にカスタマイズ可能な移動平均の周りの標準偏差を測定し、トレンドフォローアプローチを使用して正確に取引を見つけます。取引は、現在のチャートの価格アクションに飛び込むことによって見つけられ、価格が選択したより高い時間枠から計算された平均価格帯に戻ったときに閉じられます。それがコード化される方法のために、指標は高ボラティリティと強いトレンドの市場か

テクニカルインジケーターでこのようなフォームを使用すると、インジケーターの感度と安定性の間の妥協点を見つけることができます。それはそのアプリケーションで追加の可能性を与えます。 インジケーターパラメーター: iType -ogiveフォームのタイプ。 iPeriod -インジケーター期間。 iFactor は、放物線および指数形式で使用される追加のパラメーターです。有効な値は0〜255です。iFactor= 0の場合、インジケーターは単純な移動平均に縮退します。 iChannel -価格が変動する上位および下位チャネルを構築できるようにするパラメーター。有効な値は-128〜127です。値が正の場合は上部チャネルが描画され、値が負の場合は下部チャネルが描画されます。 これらのパラメーターを組み合わせることにより、さまざまな結果を得ることができます。このインジケーターは、市場のトレンド価格の動きを追跡するために使用できます。チャネルを構築することにより、価格が移動できる最も近いターゲットを取得できます。チャネル境界値は、利益を取り、損失を止めるために使用できます。 iFactorを使用す

DYJ ChameleonTrend funciona com base no sistema Trend Following e Counter Trend. DYJ ChameleonTrend é um indicador de alta probabilidade. Este indicador usa um indicador Mix exclusivo que combina indicador sofisticado com discrição do usuário. Este indicador é um algoritmo de variância e ATR cruzado de adn Ma mais avançado. O indicador exibe duas setas direcionais coloridas e bolas de rolagem de tendência, indicando as melhores posições de entrada e saída para os traders. Entrada InpPeriod = 50
このインジケーターは、クラシックなZigzagインジケーターによって形成される各価格スイングに上下の矢印を描画します。Zigzagが新しいスイングの安値を形成すると、緑色の矢印が表示されます。同様に、新しいスイングの高値が形成されると赤色の矢印が表示されます。
特徴
クラシックなZigZagと比較して、より効果的にスイングポイントをマークします。 形成中のチャートパターンを事前に識別するのに役立ちます。 Zigzagの方向を複数の時間足で表示するマルチタイムフレームスキャナーを搭載。 すべてのMetaTraderアラートが含まれています。
入力パラメーター Depth(深さ): Zigzagの転換点で使用するバーの数を決定する整数値。 Deviation(乖離): 方向を変える前のパーセンテージ乖離。 Back Step(バックステップ): Zigzagの高値・安値間の最小バー数。 MTFスキャナー: 複数時間足にわたってZigZagの方向を表示します。 アラート設定
欠点 Zigzagはリペイントされる遅延型インジケーターであるため、それに基づいて描画された矢印も同様にリ

このインジケーターは、RSIの買われ過ぎ/売られ過ぎの領域を上回るまたは下回るバーの数を使用して、市場の強気/弱気の状態を表示します。緑のヒストグラムは強気の力を示し、赤のヒストグラムは弱気の力を示します。
特徴
新しいトレードのエントリーに使用することも、他の戦略やインジケーターのトレードを確認するために使用することもできます。 複数の時間軸をスキャンするマルチタイムフレームスキャナーが搭載されており、各時間軸の強気/弱気の勢力を分析します。 初心者トレーダーが強気/弱気の勢力を利用してエントリーを確認できるため、自信を持ってトレードできるようになります。 MetaTraderの全アラート機能を搭載。
入力パラメーター 期間: RSIの買われ過ぎ/売られ過ぎレベルを特定するための期間。 バー期間: RSIの買われ過ぎ/売られ過ぎレベルを上回る/下回るバーの数。 売られ過ぎレベル: RSIで売られ過ぎの水準を決定する値。 買われ過ぎレベル: RSIで買われ過ぎの水準を決定する値。 MTFスキャナー: すべての時間足からシグナルを取得するマルチタイムフレームスキャナー。 アラ

これは、2005年にAlan Hullが開発したクラシックなHMAを改良したバージョンです。3つの加重移動平均(WMA)を組み合わせることで、従来の移動平均線よりも遅延を効果的に減らしています。 ロングエントリー: HMAが赤から青に変わり、上向きの傾きになるとき。 ショートエントリー: HMAが青から赤に変わり、下向きの傾きになるとき。
特徴 すべての時間足で新しいシグナルをスキャンするマルチタイムフレームスキャナーを搭載。 HMAは、従来の移動平均でよく見られるラグ(遅れ)を効果的に軽減します。 新たに発生するトレンドの開始と終了を識別します。 すべてのMetaTraderアラートに対応。
HMAの計算式 Hull移動平均は、以下の3つのWMAを使って計算されます: WMA1 = P × WMA WMA2 = P/2 × WMA Raw HMA = (2 × WMA1) - WMA2 Final HMA = Raw HMAのWMA(√P) P = 期間 WMA = 加重移動平均
プロのヒント
HMAは単体でも使用可能ですが、他のインジケーターと組み合わせることで精度が向上
MetaTraderマーケットは、開発者がトレーディングアプリを販売するシンプルで便利なサイトです。
プロダクトを投稿するのをお手伝いし、マーケットのためにプロダクト記載を準備する方法を説明します。マーケットのすべてのアプリは暗号化によって守られ、購入者のコンピュータでしか動作しません。違法なコピーは不可能です。

取引の機会を逃しています。
- 無料取引アプリ
- 8千を超えるシグナルをコピー
- 金融ニュースで金融マーケットを探索