 MetaTrader 5
 专家
专家
 指标
指标
 程序库
程序库
 实用工具
实用工具
 窗口小部件
窗口小部件
 规则
规则
适用于MetaTrader 5的新技术指标 - 176
 技术指标的信号外汇和股票市场的开仓交易和平仓交易起着至关重要的作用。指标的本质就是一种交易品种的数学转换,旨在预测未来的价格变化。
测试技术指标可以更有利于预测市场行为并从中获利。
技术指标的信号外汇和股票市场的开仓交易和平仓交易起着至关重要的作用。指标的本质就是一种交易品种的数学转换,旨在预测未来的价格变化。
测试技术指标可以更有利于预测市场行为并从中获利。 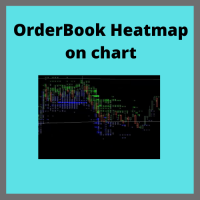
Ever needed a Boomap-like indicator for you MT5? Here you are!!
FULL WORKING DEMO VERSION available on Channel:
https://www.mql5.com/en/channels/011107AFAAE3D801
With this indicator you will see all the important levels, in which the largest bid and ask order are sitting. This indicator will show show all the history on limit order planed on the book. It will work only for futures broker who support level 2 order book. You can visualize the orders with colors and or with a text indicating the
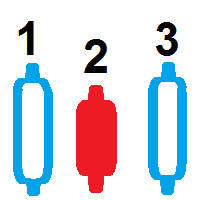
蜡烛计数器 此指标计算蜡烛并 将数字显示在屏幕上 基于更长的时间框架 较大的时间范围 您可以将每日时间范围选择为“ Bigger Timeframe ”,并在具有较小时间范围的任何图表中运行它。计数器将根据 每日图表 计算条形。 如果您将时间帧“ H1 ”作为参数传递,那么该指标将知道如何计算 H1 图表内的柱线,您只需在具有较小时间帧的图表上运行它即可。 主要参数是“ Bigger Timeframe ”,它比您使用的时间范围更大,是蜡烛计数的基础。 显示数字 除了这个参数之外,还有一个显示数字的参数,因为你不一定需要在屏幕中间看到数字,你可以通过按 CTRL+来看到计数D 并观察指标“ BarIn(大体时间) ”。 鼠标 当您在屏幕上 移动鼠标 时,该区域也非常有用,因此您将能够看到鼠标光标经过的确切栏,在图像中查看如何这行得通。 可分 有一个参数叫做“ Divisible ”这个参数是用来让你只看到能被这个参数整除的条数,这样屏幕就不会那么脏了这么多数字。 总和 还有参数“ Sum ”,它与参数 Divisible 一起使用,在图像中我留下了一个使用 Divisible 5 和
FREE

采用专业和量化方法进行均值回归交易的独特指标。它利用了价格以可预测和可衡量的方式转移并返回均值这一事实,这允许明确的进入和退出规则大大优于非量化交易策略。 [ Installation Guide | Update Guide | Troubleshooting | FAQ | All Products ]
清晰的交易信号 非常容易交易 可定制的颜色和尺寸 实现性能统计 优于大多数交易策略 显示合适的止损和止盈水平 它实现了电子邮件/声音/视觉警报
这个怎么运作
该指标从更高的时间范围测量完全可定制的移动平均线的标准偏差,并使用趋势跟踪方法精确地找到交易。交易是通过深入当前图表的价格行为发现的,并在价格返回到平均价格区间时关闭,根据您选择的更高时间范围计算。由于其编码方式,该指标将远离高波动性和强劲趋势市场,并且仅在可预测的情况下进行交易,在可接受的波动性与方向性比率范围内,回归均值是可行的。
指标剖析 绿线是更高时间范围内的移动平均线(也就是平均值) 虚线区域是移动平均线周围的典型价格区间 蓝线是看涨交易的突破价格 红线是看跌交易的突破价格 交易是针对均值进行的,并在典型的价格

Volatility Vision: Essential for Forex and Stock Markets
发现Volatility Vision:您的交易革命 完美适合初学者和专业交易者 简单入门指南: 通过我们的 用户手册 ,学习如何有效使用它。
Volatility Vision 指标是一个强大的工具,可以在您的图表上精确描绘波动率水平。这个多功能工具是整合到您的交易策略中必不可少的,兼容所有货币对和股票市场。 利用 波动率阈值 ,自信地管理您在一周内的交易。 Volatility Vision的优势 增强准确性: 显著减少了常见于随机振荡器的误报。 早期信号: 比RSI更早捕捉交易信号,帮助您抓住错失的机会。 市场领先: 在MACD响应之前提供前瞻性见解。 可靠性: 避免了CCI常见的误信号陷阱。 轻松配置 输入ATR值以开始(默认值为15)。所有级别都是固定的,以保持一致的分析;切换时间框架以刷新数据。 指标指南 蓝线: 每日波动率。 红线: 每周波动率。 橙线: 每月波动率。 将Volatility Vision与传统的ATR结合使用,以获得更多战略机会。今天就增强

LT Support Resistance - 100% 自动识别支撑位与阻力位 您是否厌倦了在手动绘制支撑线和阻力线上浪费时间?或者因为总是错过某个关键位置而感到沮丧?LT Support Resistance 的开发正是为了消除这一繁琐的工作,它能同时在多个时间周期(Timeframe)内,自动识别并标注出对您交易资产最具价值的区域。 == 关键位置的智能自动化 == 相比手动绘制线条(既主观又耗时),该指标能够通过分析历史价格,识别出显著的反转点,并绘制出价格“真实”尊重的支撑线与阻力线。为您带来更客观、更高效且基于数据支撑的盘面分析。 == 核心特性 == 100% 自动检测: 无需手动分析,自动识别支撑/阻力 多时间周期 (MTF): 直接在 M5 图表上直观查看 H1、H4、D1、W1 的关键位置 智能警报: 当价格触及、突破或在某一水平位盘整时发送通知 动态区域: 创建的是“区域”而非简单的“线条”,更加贴合价格行为(Price Action)的真实市场 兼容任何资产: 外汇、指数、股票、加密货币、大宗商品 视觉完全自定义: 颜色、样式、粗细、透明度均可自由配置 == 运

该指标基于椭圆形。这种形状用于空气动力学和空间技术。甚至子弹也有某种椭圆形。 在技术指标中使用这种形式可以在指标的灵敏度和稳定性之间实现折衷。这为其应用提供了额外的可能性。 指标参数: iType - ogive 表单的类型。 iPeriod - 指标周期。 iFactor 是用于抛物线和指数形式的附加参数。有效值为 0 - 255。如果 iFactor = 0,则指标退化为简单移动平均线。 iChannel - 一个允许您建立价格变动的上下通道的参数。有效值为-128到127。如果值为正,则绘制上通道,如果值为负,则绘制下通道。 通过组合这些参数,可以获得不同的结果。该指标可用于跟踪市场中的趋势价格变动。通过建立渠道,您可以获得价格可以移动的最近目标。通道边界值可以作为止盈止损。使用 iFactor,您可以实现金融时间序列所需的平滑程度。

该指标通过计算 RSI 超买/超卖区域上方和下方移动的柱数来显示市场的多头/空头趋势。绿色柱状图表示多头力量,而红色柱状图表示空头力量。
功能特点
可用于开启新交易,或验证来自其他策略或指标的交易信号。 配备多时间框架扫描仪,可扫描所有时间框架内的多头/空头力量。 是验证交易信号的完美工具,可增强新手交易者的信心。 包含所有 MetaTrader 4/5 预警功能。
输入参数 周期: 用于确定超买/超卖水平的 RSI 周期。 柱周期: 计算 RSI 超买/超卖区域上方/下方的柱数。 超卖水平: 用于确定 RSI 超卖水平的参数。 超买水平: 用于确定 RSI 超买水平的参数。 MTF 扫描仪: 多时间框架扫描仪,可从所有可用时间框架中获取信号。 预警设置
SSL 是 Semaphore Signal Level(信号等级通道)的缩写。该指标由两个分别应用于最高价和最低价的移动平均线组成,从而形成一个贴近价格走势的包络通道。 买入信号: 当价格收盘于上方移动平均线之上时。 卖出信号: 当价格收盘于下方移动平均线之下时。
功能特点 内置多周期扫描器,可跨所有时间周期扫描新信号。 经典 SSL 通道的简洁实现,轻松判断趋势方向。 支持所有 MetaTrader 提供的警报类型,包括弹窗、声音、电子邮件和推送通知。
SSL 公式 上轨线: 应用于最高价的移动平均线。 下轨线: 应用于最低价的移动平均线。
买入入场: 当价格收盘于上轨线之上时。 买出离场: 当价格收盘于下轨线之下时。
卖出入场: 当价格收盘于下轨线之下时。 卖出离场: 当价格收盘于上轨线之上时。

这是经典 HMA 的改良和增强版本,最初由 Alan Hull 于 2005 年开发。它结合了三种加权移动平均(WMA)来减少滞后,提高信号响应速度。 做多入场: 当 HMA 由红色变为蓝色并向上倾斜时。 做空入场: 当 HMA 由蓝色变为红色并向下倾斜时。
功能特点 附带多时间框架扫描器,可扫描所有时间周期中的新信号。 HMA 显著减少了传统移动平均线常见的滞后问题。 能够有效识别新趋势的开始与结束。 支持所有 MetaTrader 类型的警报,包括弹窗、声音和通知。
HMA 计算公式 Hull 移动平均线是通过以下三种加权移动平均线计算得出: WMA1 = P × WMA WMA2 = P/2 × WMA Raw HMA = (2 × WMA1) - WMA2 Final HMA = Raw HMA 的 WMA(√P) P = 周期 WMA = 加权移动平均值
专业建议
虽然你可以单独使用 HMA,但我们建议与其他指标配合使用,以提高信号的准确性。多时间框架扫描器是确认 HMA 信号的实用工具。
Indicator developed by the Brazilian and analyst Odir Aguiar (Didi), consists of "Moving Averages", famously known as "Didi needles", where it allows the viewing of reversal points.
The concept is very simple, when you enter 3 Moving Averages on display, a period equal to 3, one equal to 8 and the other equal to 20, then the formation of the indicator that works in axis or line center equal to 0 (zero) appears. ). Moving averages must intersect when approaching line 0.
The scanner monitors 10
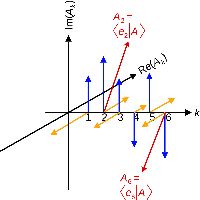
ComplexVectorHL is an indicator that characterizes the change in short-term market trends. The indicator is based on market analysis using the mathematical apparatus of complex numbers. The essence of the indicator is that it, with clear impulses, indicates the points in time when it is necessary to make decisions. The impulses are like a cardiogram showing the heartbeat of the market. The indicator has pulses only in one direction (unlike the previous development of ComplexVector), the pulses

This is the famous Sunflower indicator for Metatrader5. This indicator marks possible tops and bottoms on price charts. The indicator identifies tops and bottoms in the asset's price history, keep in mind that the current sunflower of the last candle repaints, as it is not possible to identify a top until the market reverses and it is also not possible to identify a bottom without the market stop falling and start rising. If you are looking for a professional programmer for Metatrader5, please
FREE

Klinger Volume Oscillator (KVO) - A Powerful Trend & Momentum Indicator This is an enhanced version of the Klinger Volume Oscillator (KVO) , a widely used indicator designed to help traders identify momentum shifts, trend direction, and overbought/oversold conditions in the market. How the KVO Indicator Works: Volume-Based Trend Identification – Unlike traditional oscillators that rely solely on price movements, the KVO uses both price and volume to detect market trends and momentum shifts .
FREE
The indicator measures the buying and selling force between the buyers and sellers in the form of a histogram/oscillator by using a BOP equation:
BOP = Moving Average of [close – open)/(high – low)]
Igor Levshin first introduced the Balance of power in the August 2001 issue of Technical Analysis of Stocks & Commodities magazine.
Features
Quickly find the buying and selling pressure among the traders. It comes with simple inputs and an interface. All Metatrader alerts included.
Applications

Back to the Future это индикатор который определяет направление тренда. Определяет четыре уровня для роста и падения 1-й уровень флета 2 -й уровень коррекции 3-й уровень продолжения тренда и 4-й уровень возможного разворота. Индикатор рисует трендовые линии краткострочного и долгострочного тренда. Так же индикатор определяет динамические сел и бай зоны в виде прямоугольников. От ближайшего максимума или минимума рисует фибо уровни для определения целей движения. В меню индикатора отключа
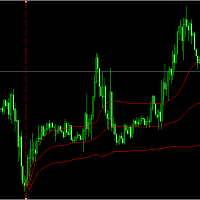
place a vwap line starting from the line placed on the chart parameters: tick_mode: enable to use ticks instead of bars. this uses a lot more cpu processing power prefix: prefix to add for line created by indicator line_color: set the color of the line created line_style: set the line style of the line created applied_price: set the price of bar to use of the bar std_dev_ratio: set the multiplier for the std dev channel

HEIKEN PLUS is the only indicator you really need to be a successful trader , without in depth knowledge of the forex trading or any tools.
Also there is automatically trading EA available now: https://www.mql5.com/en/market/product/89517? with superb SL/TP management! and sky high profit targets !!!
Very suitable tool for new traders or advanced traders too. This is MT5 version. For MT4 version visit : https://www.mql5.com/en/market/product/85235?source=Site
HEIKEN+ is a combination of 2 i

Numa folha qualquer
Eu desenho um sol amarelo
E com cinco ou seis retas
É fácil fazer um castelo
Corro o lápis em torno da mão e me dou uma luva
E se faço chover com dois riscos, tenho um guarda-chuva
Se um pinguinho de tinta
Cai num pedacinho azul do papel
Num instante imagino uma linda gaivota a voar no céu
Vai voando, contornando
A imensa curva norte-sul
Vou com ela viajando
Havai, Pequim ou Istambul
Pinto um barco à vela
Branco navegando
É tanto céu e mar num beijo azul
Entre as nuvens vem
FREE

DYJ ChameleonTrend基于趋势跟踪和反趋势系统工作。 DYJ ChameleonTrend是一种高概率指标。该指标使用独特的混合指标,将复杂的指标与用户的判断力相结合。 该指标是一种最先进的Ma交叉和ATR和方差算法。 该指示器显示两个彩色方向箭头和趋势滚动球,指示交易者的最佳进入和退出位置。
参数
InpPeriod=50--指标周期 InpPrice=指标价格方法有7种:1.收盘价格 方法 ,2.开盘价格 方法 . 3. 最高价格 方法 , 4. 最低价格 方法 , 5.中间价格 方法 , 6. 典型价格 方法 ,7. 加权方法 InpAtrDevPeriod = 5 —— 标准偏差指标或者ATR指标周期 InpUseWhat = 使用atr计算方法
该指标在每次由经典Zigzag指标形成的价格波动中绘制向上和向下的箭头。当Zigzag形成一个新的波谷时,会绘制一个绿色箭头。同样,当Zigzag形成一个新的波峰时,会绘制一个红色箭头。
功能特点
相比经典的ZigZag指标,该指标能更有效地标记转折点。 有助于提前识别正在形成的图表形态。 内置多周期扫描器,可显示每个时间周期中的Zigzag方向。 包含所有Metatrader预警提醒功能。
参数设置 深度: 一个整数值,用于决定Zigzag转折点的K线数量。 偏差: 在方向改变前的百分比偏差。 回撤步长: Zigzag高低点之间的最小K线数量。 多周期扫描器: 显示多个时间周期中ZigZag的方向。 提醒设置
局限性 Zigzag是一个会重绘且滞后的指标,因此基于它绘制的箭头也会存在重绘和延迟的问题。在历史数据上看起来很完美,是因为它会根据新的高点和低点不断调整自身的位置。这意味着它的表现不能代表实时交易效果,仅适合用作辅助判断工具。
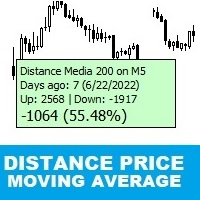
Distance Price Moving Average
This is an indicator that calculates in real time the distance from the price to the moving average.
With it you can monitor the maximum deviation of the price from the moving average in a certain period of time chosen by you, for example, monitor the distance according to the maximum deviation of the last 30 days.
It is possible to choose the period and type of the moving average.
To make it even better, we have added the possibility of two alert levels if th
FREE

描述。 Renko图表形成的基础是价格范围。 如果价格超出其限制,图表显示一个框高于或低于前一个。 因此,我们看到价格走势没有额外的"噪音"和重要的支撑和阻力水平。 特征。
为了与专家顾问一起使用,实现了一个额外的缓冲区-一个盒子计数器. 为了方便和提高测试速度,用户可以使用"新框"事件,指示器在出现新框时生成该事件。 您可以设置"反转"框的大小。 无论测试开始点如何,指标始终构建相同。 没有"重绘"。 一旦到了那里,拳击就不会再改变了。 无论从哪里启动,它都将被绘制相同。 输入参数:
RenkoBoxSize = 20; //Box size ReversBcnt = 2; //Box's for reverse RenkoBoxDrawCNT = 100; //Box's for draw Price = bid; //bid, ask, (ask+bid)/2 RenkoBoxEventId = 123; //Box's event
FREE
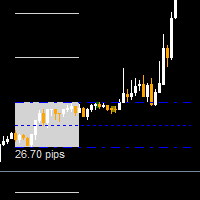
The worktime indicator helps you identify the most important times to day to trade the currency pairs. It was created based on the ICT day trading free tutorials that are freely vailable on his youtube channel. You can use this indicator together with my other indicators that i have shared freely with you like the true day, custom periods, daily month, weekly open lines - they together complement each other very well.
Nuggets from this indicator: 1. Draws the asian session box showinng you the
FREE
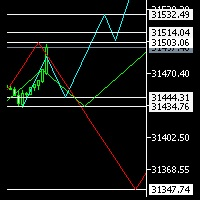
Hello Everyone ,
I am not an Elliot pro , but I promise to let you see it in a different way , have you ever considered to see 3 probabilities of different time frames on same chart ? this will not only enhance your trades entry , but will give you confidence and certainty when everything is not clear.
in my indicator you will be able to select 3 time frames of your choice , define number of candles per each time frame , give the color per each trend (Bearish or Bullish), not only that , you
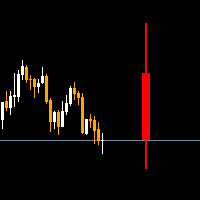
The Higher timeframe candle tracker is used to get a glimpse of what the selected higher time frame candle is like. It plot the candle after the current price. It can come in handy for day traders and short term traders that often worry about how the current higher timeframe candle may look like. You can select the higher time frame or lower time frame from the options provided: By default the color for bears is red and for bulls is green. You are able to change the width of the candle, its wick
FREE
Excellent tracking performance and minimal noise! This trend detection indicator that avoids whipsaws and uncertain market noise and is also agile enough to react to changes in trend.
It is also designed to adapt to dynamic markets.
Functions mainly as a filter to help you trade in the direction of the trend.
Features.
Simple and easy to use. Low load and easy to try out The excellent tracking performance and smooth lines that make it ideal for market analysis Can be used as a trend filter for
FREE
AIS MT5 INDICATOR 5 ALL INCLLUSIVE SET
GUIDE
CHAPTER 1 IMPORTANT INFORMATION <1> THIS INDICATOR IS ONE OF THE SERIES OF NEW AIS INDICATORS AIS MT5 INDICATOR 1 =ADVANCED CLASSIC= AIS MT5 INDICATOR 2 =MULTIFRAMES= AIS MT5 INDICATOR 3 =LINES= AIS MT5 INDICATOR 4 =MARKET PROFILES= AIS MT5 INDICATOR 5 =ALL INCLUSIVE SET
CHAPTER 2 GENERAL FEATURES OF THE SERIES
<1> AIS MT5 INDICATOR 1 =ADVANCED CLASSIC= < DEVELOPMENT PAUSED > DISPLAYS MAIN TIME POINTS AND PRICE LEVELS OF THE CHART SUCH

该指标使用所谓的“邪恶”数字作为权重系数。它们的对立面是“可憎”的数字,也出现在该指标中。将数字划分为这两类与汉明权重有关,汉明权重由特定数字的二进制表示法中的单位数确定。 使用这些数字作为加权因子会产生趋势跟踪指标。此外,可恶的数字给出了更敏感的指标,而邪恶的数字给出了保守的指标。它们之间的差异不是很大,只有在市场价格剧烈波动时才能注意到。使用该指标可以帮助确定新趋势的开始。这使得可以更准确地确定开仓时刻。 指标参数: Type numbers - 选择数字类型,Evil 或 Odious; iPeriod - 指标周期。指标的灵敏度取决于此参数。它越小,对价格变化和市场趋势变化的敏感度越高。 图中显示了指标操作的示例。
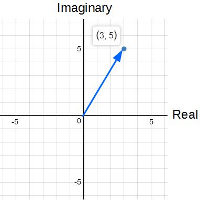
ComplexVector is an indicator based on market analysis using the mathematical apparatus of complex numbers. The essence of the indicator is that it, with clear impulses, indicates the points in time when it is necessary to make decisions. The impulses are like a cardiogram showing the heartbeat of the market.
For example: it may be the moment of planning a new entry. this may be the moment to exit the position. if you work with a series that is in a drawdown, you are recommended to close it in
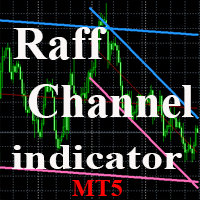
The indicator plots a trend channel using the technique by Gilbert Raff. The channel axis is a first-order regression. The upper and lower lines show the maximum distance the Close line had moved away from the axis line. Therefore, the upper and lower lines can be considered as resistance and support lines, respectively. A similar version of the indicator for the MT4 terminal
As a rule, most movements of the price occur within a channel, going beyond the support or resistance line only for a sh
FREE

ADX 指标(平均方向指数)是一种旨在衡量市场趋势强度的技术工具。 ADX 指标用于各种目的,例如测量趋势强度、寻找趋势和交易范围,以及作为各种外汇交易策略的过滤器。
一些最好的交易策略是基于跟随市场趋势。还有一些策略可以让交易者通过逆势交易来获利。无论如何,如果你能及时发现新出现的趋势,你赚钱的机会就会明显增加。
对于交易者来说,好消息是现代交易软件会自动为您进行这些计算。 在这种情况下,您无需单独下载 ADX 指标:ADX 会自动包含在平台指标列表中
如您所知,ADX 指标用于确定市场是否呈趋势。 但是你怎么知道趋势何时发生? 因此,ADX 的范围从 0 到 100。Wilder 认为高于 25 的值表明市场存在趋势,而低于 20 的值表明趋势较弱或根本没有趋势。 出于这个原因,许多现代技术分析师认为 25 的值是市场中“趋势”和“无趋势”之间的关键点。

本指标的目的是识别反转点. 蓝色箭头是做多信号,它对应的黄色星是止损. 红色箭头是多空信号,它对应的黄色星是止损.
报警功能: 如果产生了信号,指标会发送三种报警:弹窗,邮件,或者手机推送 Inputs: Popup Window Alert: 弹窗报警,默认是关闭的 Email Alert : 邮件报警,默认是关闭的 Mobile Push Alert: 手机推送报警,默认是关闭的. MetaTrader 4 Version : Reversal Point 请注意,这个信号是逆势的,可能会连续失败. 请注意,这个信号是逆势的,可能会连续失败. 请注意,这个信号是逆势的,可能会连续失败. 请注意,这个信号是逆势的,可能会连续失败. 请注意,这个信号是逆势的,可能会连续失败. 请注意,这个信号是逆势的,可能会连续失败.
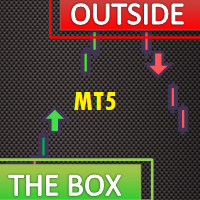
The Outside The Box (OTB) is a complete trading system that provides the user with immense trading ability by highlighting on the chart areas where the trader should prepare to Re-enter the trend after pullbacks (Pullback trading strategy) Take partial/complete profit(Profit taking strategy), and Trade breakouts (Stock breakout strategy) - We have updated the indicator to show/hide Micro breakout areas around the major breakouts (Micro Breakouts). The above is supported by an alert system to no
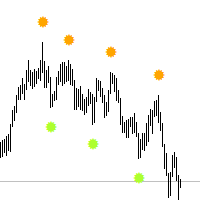
Think of the Super Fractal Indicator as the Bill WIlliams Indicator on Steroids. Indicator Abilities: 1. Adjust Candle around Fractal High or Low. 2. Adjust Lookback period and only plot for a specific number of history candles avoiding cluttering your trading desk. 3. The Indicator uses buffers so you call and use it from any EA.
Note : The higher the candles around Fractal, the stronger the Turning point anfd viceversa is true.
FREE

Investment Castle Spots — Candlestick Patterns, Spotted for You
The Spots Indicator watches for the candlestick patterns traders rely on — engulfing, hanging man, doji and more — and marks them on your chart for cleaner entries and exits.
What it does for you Key patterns detected: engulfing, hanging man, doji and other classic candlestick signals. Entry & exit help: use the patterns to time your trades with more confidence. On-chart and clear: no manual pattern-hunting candle by candle. Works
FREE

Indicator alerts for Dual Relative strength index rsi. Large rsi preset at 14 is below 30 small rsi preset at 4 is below 10 for buy bullish signals .
Large rsi preset are 14 is above 70 small rsi preset at 4 is above 90 for sell bearish signals . Includes mobile and terminal alerts. draws lines when alerts.
This indicator can help identify extremes and then the tops or bottoms of those extremes .
FREE

Funciona como bandas de bollinger normais. Criado por Joe Ross, é um setup de maior risco por ser contra-tendência. Pode ser usado para Day Trade, Swing Trade e Position. Para identificar, é necessário inserir no gráfico as Bandas de Bollinger, com uma Média Móvel Simples de 20 períodos e largura (desvio) 2. Verifica-se um fechamento de determinado candle abaixo da banda inferior de Bollinger. Se o próximo candle fechar dentro das Bandas, marca-se a máxima dele. O rompimento dessa máxima será o
FREE
Tool converted from tradingview indicator. Modified version with pivot points calculated in a more intuitive way.
This tool displays relative volatility and directional trend. Excellent way to pickup diversions and reversals. Length can be lowered to 11 or 13 in settings to show price range.
Can be used to identify patterns such as parallel channels and likely direction of price action.

Very powerful indicator! converted from TradingView with upgraded alerts and added notifications. Ideal use in EAs.
Use as a supplementary Indicator to confirm your entries, but it is as good on it's own.
The indicator consists of 3 different Trend Meters and a 2 Trend Bars which are used to confirm trend
How to Use:
The more Trend meters are lit up the better =>>
-more GREEN COLOR at one bar means more confirmation to open buy trade,
- more RED COLOR signals for one bar = more confirmat

The TickCounter indicator counts up and down ticks on each new bar.
The calculation starts from the moment the indicator is placed on the chart.
Histogram bars represent: Yellow bars - total number of ticks; Blue bars - ticks UP; Red bars - ticks DOWN. If the blue bar is not visible, then there are more down ticks and the red bar is displayed on top of the blue one (the red layer is above the blue one). MT4 version: https://www.mql5.com/en/market/product/82548
Each reinitialization of the i

WA_PV_BOX_EFFORT X MT5 的结果 WAPV Box Effort x Result Indicator 是 Package Indicators 组(Wyckoff Academy Wave Market)的一部分。 MT5 的 WAPV Box Effort x Result Indicator 可帮助您阅读价格和交易量。它的阅读包括协助识别努力x结果 在图表创建的波浪中。 当方框为绿色时,MT5 的 WAPV Box Effort x Result Indicator 表示交易量有利于需求,而当方框为红色时 量有利于供应。 方框越大,成交量相对于价格的位移越大。如果价格的上升波与 Box 的大小不成比例,则 努力x结果。 以一种非常直观的方式,我们可以识别出数量和价格之间的这种差异。 MT5 的 WAPV Box Effort x Result Indicator 还允许您通过将指标置于零轴下方来改善可视化。 以即时交易量和实际交易量在市场上运作 看图片:


The WAPV ADH Supply and Demand indicator is part of a set of indicators called (Wyckoff Academy Wave Market)
The WAPV ADH Supply and Demand indicator for MT5 is intended to identify the winning side between buyers and sellers.
Its reading is very simple, when the green line is above the red line the demand is in charge, when the red line is above the green line the supply is in charge.
The more positive the green and red lines, the greater the volume input, the closer to zero or negative, th

The WAPV ADH Supply and Demand Forex Indicator is part of a set of Indicators called (Wyckoff Academy Wave Market) The WAPV ADH Forex Supply and Demand Indicator for MT5 is intended to identify the winning side between buyers and sellers. Its reading is very simple, when the green line is above the red line demand is in command, when the red line is above the green line supply is in command. The more positive the green and red lines, the higher the volume input, the closer to zero or negative, t

The Weis Wave Bouble Side Indicator for MT5 is part of the toolkit (Wyckoff Academy Wave Market) The Weis Wave Bouble side Indicator for MT5 was created based on the already established Weis Wave created by David Weis. The Weis Wave Double Side indicator reads the market in waves as it was done by R. Wyckoff in 1900. It helps in the identification of effort x result, cause and effect, and Supply and demand Its differential is that it can be used below the zero axis, further improving plus operat

The Weis Wave Bouble Side Indicator for MT5 is part of the toolkit (Wyckoff Academy Wave Market) The Weis Wave Bouble side Indicator for MT5 was created based on the already established Weis Wave created by David Weis. The Weis Wave Double Side indicator reads the market in waves as R. Wyckoff did in 1900. It helps in the identification of effort x result, cause and effect, and Supply and demand Its differential is that it can be used below the zero axis and has a breakout alert showing Who is s
The VSA Candle Signal for MT5 is part of the toolset (Wyckoff Academy Price and Volume). Its function is to identify the correlation of Price and Volume in the formation of the candle. Its creation is based on the premises of R.Wyckoff , a precursor in the analysis of Price and Volume. VSA Candle Signal for MT5 assists in decision making, leaving your reading clearer and more fluid. See the images below.

The Force and Weakness Indicator for MT5 Real Volume is part of the (Wyckoff Academy Price and Volume) toolset The Force and Weakness Indicator for MT5 Real Volume was developed to identify the Strength and Weakness of volume in an accumulated way. Enabling the vision of a panorama between price and volume. The Indicator can be used as an oscillator and as a histogram. As a fantasy it has all the premises of R. Wyckoff's three laws when put together with the price: Cause and Effect, Effort x Res

The Force and Weakness Indicator for MT5 Forex is part of the (Wyckoff Academy Price and Volume) Toolkit The Force and Weakness Indicator for MT5 Forex was developed to identify the Strength and Weakness of volume in an accumulated way. Enabling the vision of a panorama between price and volume. The Indicator can be used as an oscillator and as a histogram. As usual it has all the premises of R. Wyckoff's three laws when put together with the price: Cause and Effect, Effort x Result and Supply a

The idea of a Value Chart indicator was presented in the very good book I read back in 2020 , " Dynamic Trading Indicators: Winning with Value Charts and Price Action Profile ", from the authors Mark Helweg and David Stendahl. The idea is simple and the result is pure genius: Present candlestick Price analysis in a detrended way!
HOW TO READ THIS INDICATOR
Look for Overbought and Oversold levels. Of course, you will need to test the settings a lot to find the "correct" one for your approach. It
FREE

Resistance and Support is an easy to use indicator to apply horizontal lines of resistance and support. There are two windows for adding levels. When you press the button, a line appears on the price chart. It is possible to move this line with the mouse, thereby changing the indicator readings. In the indicator menu there is a choice of possible alerts - no alert, alert on touching the level and an alert for closing the candle after the level.
FREE

Everyone knows how to analyze the market , which level to buy / sell this is an easy job , which leads to unusual horrible loses , very little few people knows WHEN then enter the market , time is Money , this is the key!!!
This version is a Proof of concept limited version of ZamanCYcles founded here: https://www.mql5.com/en/market/product/81883?source=Site +Market+Product+Page This works Only on 3 Minutes Time frame for 45 Candles Get rest of planets and more than 10 other algorithms to pred
FREE
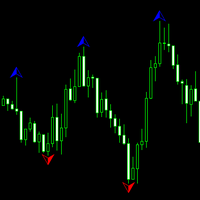
An indicator for all timeframes with a configurable number of bars for calculating fractals. Suitable for determining extremes of both lower and higher order, by which it is possible to determine the patterns of technical analysis, as well as divergences.
The indicator has one adjustable parameter - the number of bars for extremum calculation. It is also possible to change the color characteristics.

The idea behind this indicator is very simple , First it contains 2 mechanisms to place your trades:
1- Enter the Pips you want to duplicate to price levels. 2- Automatically let the indicator specify the largest Buy / Sell Volume Candle and place duplicated levels based on the candle itself.
How it works: 1- Enter the Pips you want to duplicate to price levels: 1- once the indicator is loaded you will need first to Specify the number of pips in the indicator Configuration window ,you can g

John Bollinger created this indicator in 2010 as a way to read the original indicator (Bollinger Bands) in a more "technical" way, shown as an oscillator. The typical range of the Bollinger Bands %B is 0 - 0.5 - 1.0, where "0" represents the lower band, the "0.5" the middle band, and "1" the upper band. The line on the indicator represents the Closing prices. As simple as that.
SETTINGS
Bollinger Bands period of analysis Standard Deviation multiplier Shift Price type to be analyzed
If you like
FREE
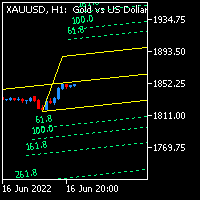
Andrew Pitch fork is one of the most interesting string trend & Channel & Fibo technical analysis , it's like ALL in ONE tool would be very enough for you.
Using 2 Andrew pitch Forks with 2 different time frames on same chart is really very hard working and might be impossible , but with this indicator is possible now , moreover , using this method as Candle Volume based analysis give strong trust for your trade.
I assume if you are having 1 daily pith fork lets say with 22 Candle value , and
FREE

Ichimoku Trend Finder is a multi symbol multi timeframe trend dashboard that helps traders to monitor and identify potential market trends from one chart. This panel scans the Ichimoku Kinko Hyo indicator in 28 configurable instruments and 9 timeframes for classic Ichimoku trend signals with a deep scan feature to scan all market watch symbols (up to 1000 instruments!).
Download Demo here (Scans only M2 and M10) Settings description here MT4 version here
After the purchase, don't for
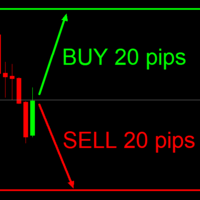
This indicator is very useful for day traders or short term traders. (MT5 version) No need to calculate the number of pips manually, just look at the chart and you will see the Virtual Take Profit / Virtual Stop Loss target line and evaluate whether the entry point is feasible to reach the intended target or not.
Enter the intended Take Profit / Stop Loss pips for your trade. The indicator will display Virtual Take Profit / Virtual Stop Loss lines for you to easily see if the target is
FREE

A ideia do indicador é mudar de cores assim que o candle viole a banda; Caso o candle viole a banda superior, pinta o candle de vermelho, Caso o candle viole a banda inferior , pinta o candle de verde, Se o candle passar em algum momento pela média, ele assume uma cor acinzentada; Os candles que não passem pela média, nem violem a banda, apresentarão cor verde fraca, se for de alta e cor vermelha fraca se for de baixa. Projeto concebido no canal Aprenda a programar, keltner cores.
FREE
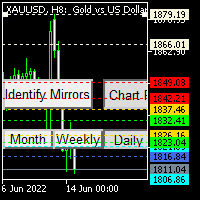
I always wondered if I can have multiple time frame Moving average on same chart , it is not possible , now with my Indicator is possible , As you know Moving average is lagging not leading indicator , but how can I predict future levels of it ?
I came with this idea , I hope you will like it , I made a Mirror of Moving average , the other side of specific time will be shown in the other side of the chart where the price didnt reach yet , that will help you to know the levels you can start sell
FREE
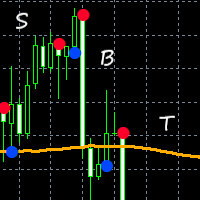
This indicator combines input from two trend filters and the ADX. You can change the trend line on chart to your preference. Great for scalping and channels. Features alert function and parameter TrendLinePeriod.
How to use: Simply attach to any chart. Sell on red bullets, with trend line above price. Enter on bullets closest to this line. Buy on blue bullets, with trend line below price. Enter on bullets closest to this line. Best results when checking the higher time frames before entering tr
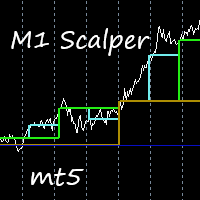
This indicator is excellent for scalping on the M1 or M5 chart. Uses a special algorithm for the lines. No need to set up the indicator. Does not feature any alerts and is best used manually after visually confirming the line displays. NB: Make sure to download M1 history before testing and use.
How to use: Simply attach to M1 or M5 chart. Zoom chart out completely. Sell when all lines above the white line (PriceLine). Sniper line crosses above white line. Buy when all lines below the white lin
The Price Elevator indicator is developed to help you figure out the general long-term trend of the market. If the price is above the Green separator line, this is a clear indication the bulls are in control. Similarly, the bears are in control if the price continues to trend below the red separator line. Download Price Elevator MT4
Trend Re-entry In this case you would plan your buy entries above the green dotted box (make sure to set the Buy / Sell Retracement Floor=30). The SL should be

使用 WolfeWaveBuilder 指标加入交易! 这是专门为获得最成功和最有利可图的投资决策而创建的独特工具。 它是真实账户的理想选择,并受益于经过全面测试和几乎有保证的交易策略。 不要错过你的机会! 开始使用 WolfeWaveBuilder 指标赚钱交易!
MT5版本 https://www.mql5.com/ru/market/product/8920
指标特点
为 Wolfe Waves 策略提供信号。 显示趋势。 自 1980 年以来一直使用的行之有效的策略! 简单的进入信号。 不重绘也不滞后。 有声音信号,E-Mail 和电话上的通知。
操作说明
等到箭头出现,终端中出现消息或通知邮件,电话。 你打开一个交易。 建议在价格越过 1-4 线时出场。 为了更好地理解策略,建议阅读理论。
基本设置
High_period - 用于计算高周期模型的最小柱数 Low_period - 用于计算低周期模型的最小柱数 Trigger_Sens - 计算分形的最小柱数
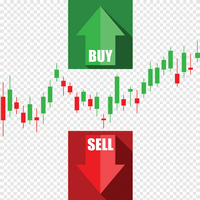
该指标使用价格序列的局部高点和低点。突出极值后,对它们的值进行平滑处理。因此,建立了两个通道 - 外部和内部。如果价格走势严格遵循线性趋势,则内部通道显示限制。外部通道以对数趋势显示价格变动的边界。 在计算通道后,该指标分析实际价格走势并提供开仓和平仓建议。蓝点 - 建立买入头寸,红色点 - 建立卖出头寸。相应的交叉盘建议关闭某些头寸,如果有的话。应该记住,并非所有信号都具有相同的强度和准确性。在某些情况下,正确方向的价格变动会很快结束,因此不可能获得大笔利润。在某些情况下,信号会导致损失(最后一张图片显示了此类信号的示例)。鉴于这些特点,我们可以推荐以下方法 - 使用浮动止盈,其值可以根据当前市场情况进行更改。还需要选择一个止损值,以便在出现关闭它们的信号之前关闭无利可图的头寸。 指标设置使用以下参数进行: iChannel - 调整通道的宽度。狭窄的通道会提供更多的信号,但也会增加误报的风险。 iSignal - 允许您配置信号的显示。默认情况下,仅显示最佳进入和退出信号。 iPeriod - 指标周期。该参数越大,通道宽度越大。因此,它也会影响信号的数量。 iFac

ROC 价格直方图警报是一种基于动量的技术指标,用于衡量当前价格与一定时期前价格之间的价格百分比变化。 ROC 以直方图对零绘制,如果价格变化向上,则指标向上移动到正区域,如果价格变化向下,则指标移动到负区域。
计算 ROC 周期的主要步骤是“计算周期”输入设置。短线交易者可能会选择一个较小的值,例如 9 或 12。长期投资者可能会选择更高的值,例如 200。“计算期”是与当前价格相比的多少个时期。较小的值将使 ROC 对价格变化的反应更快,但这也可能意味着更多的错误信号。较大的值意味着 ROC 反应较慢,但信号在出现时可能更有意义。 这种技术指标既有积极的一面,也有消极的一面
积极的 ROC 价格振荡器是技术分析中使用的无界动量指标,以零水平中点为基准 ROC 上升高于零通常确认上升趋势,而 ROC 下降低于零则表明下降趋势 五种警报类型,包括视觉买卖箭头 任何品种和时间框架 消极的 当价格整合时,ROC 将徘徊在零附近。在这种情况下,观察整体价格趋势很重要,因为 ROC 除了确认整合之外几乎不会提供任何洞察力。 指标菜单类别 主要配置 - ROC 计算周期/警报设置 - 应用
Watermark Centralized
Adds a watermark centered with the asset name and chosen period.
It is possible to override the font type, font size, font color and separator character.
The watermark is positioned behind the candles, not disturbing the visualization.
It has automatic re-centering if the window is resized.
Hope this indicator helps you, good trading ;)
FREE

The Market Entropy indicator was created to measure the order of price changes over time. consists of two lines and a histogram where the lines are responsible for measuring the price movement and the histogram measures the strength of the analyzed movement. It can be used to find a trend (Image 2) or price reversal (Image 3).
Blue Line: Buy Entropy Red Line: Sell Entropy Historgram: Market Entropy
Interpretation: Buy Line above the Sell Line indicates that in the analyzed period buyers were

Moving Average Trend Scanner is a multi symbol multi timeframe triple MA crossover dashboard that helps traders to monitor, and identify potential market trends from one chart. This panel scans 3 moving averages in up to 28 configurable instruments and 9 timeframes for triple moving average alignment and moving average crossover with a deep scan feature to scan all market watch symbols (up to 1000 instruments!).
Download Demo here (Scans only M2 and M10) Settings description here MT4 v

Informações Importantes sobre o ArrowHacker (Não repinta! Não gera sinais atrasados!)
Se você está procurando um indicador que cumpre aquilo que promete, você acabou de encontrar! O ArrowHacker irá superar todas as suas expectativas com certeza! E o melhor de tudo, é só colocar na sua conta, ligar e já começar a lucrar!
O ArrowHacker é um sistema profissional de trade criado para as plataformas MT4 & MT5 e otimizado para trabalhar com qualquer ativo na plataforma MetaTrader 5, sejam moedas, m
学习如何在MetaTrader AppStore上购买EA交易,MetaTrader平台的应用程序商店。
MQL5.community支付系统支持通过PayPay、银行卡和热门付款系统进行交易。为更好的客户体验我们强烈建议您在购买前测试EA交易。
