 MetaTrader 5
 エキスパート
 インディケータ
 ライブラリ
ライブラリ ユーティリティ
 ウィジェット
 ルール
ルール
YouTubeにあるマーケットチュートリアルビデオをご覧ください
ロボットや指標を購入する
仮想ホスティングで
EAを実行
EAを実行
ロボットや指標を購入前にテストする
マーケットで収入を得る
販売のためにプロダクトをプレゼンテーションする方法
MetaTrader 5のための新しいテクニカル指標 - 172
 テクニカル指標からのシグナルは、株式および外国為替市場での取引の開始と終了に重要な役割を果たします。指標の本質は、将来の価格変動を予測することを目的とした金融銘柄価格の数学的変換です。
テクニカル指標をテストして、市場の動きとそれからの利益をより正確に予測します。
テクニカル指標からのシグナルは、株式および外国為替市場での取引の開始と終了に重要な役割を果たします。指標の本質は、将来の価格変動を予測することを目的とした金融銘柄価格の数学的変換です。
テクニカル指標をテストして、市場の動きとそれからの利益をより正確に予測します。 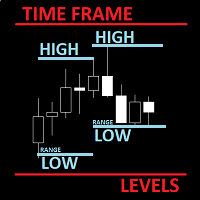
The utility helps to locate in the lower time frames the maximum and minimum of the upper time frame. The length of time frame level line represents the temporal length of the upper time frame. It's possible to OnOff the levels with a button or keys
The indicator draws lines that delimit the upper time frames candle and highlights his high-low price and the pips candle range. How it works:
Firstly . Choose which time frames levels to represent in the lower ones : monthly, weekly, daily

The Commissioner indicator is very sensitive to current price activity and displays signals quite well. Reacts quickly to trend changes, clearly shows the price movement. The colored version of the indicator signals a trend change. The indicator allows you to see a rising or falling trend.
In addition to the direction of the trend, the indicator shows the change in the slope, the analysis of which allows you to filter signals using filters by angle, this can be used when building a bot with th
This indicator demonstrates the probable dynamic support and resistance levels of EMA, Ichimoku lines, and Key OHLC levels for different timeframes on one chart. This can drastically reduce the time and effort needed for switching between different timeframes.
EMA and Ichimoku Levels are drawn for the M1, M5, M15, M30, H1, H4, and D1 timeframes, and the Key OHLC levels of the last periods are drawn for the H4, D1, W1, and MN1 timeframes.
FREE

このインジケーターは、現在の時間枠でより高い時間枠の予測を作成します。色付きのキャンドルの形での視覚化。市場内のプロセスとその規模およびダイナミクスをよりよく理解するのに役立ちます。これらすべてがインスピレーションの源となり、成功する取引戦略を見つけるための正しい道につながる可能性があります。インジケーターはローソク足パターンの検索を簡素化します。異なるパラメーターで複数のインジケーターを有効にして、同時に多くの時間枠を表示することができます。設定では、各方向のキャンドルの色と幅を変更できます。インディケータは、トレーディングアドバイザーと組み合わせてツールとして使用できます。時間枠オプション-現在の時間枠より大きくする必要があります。大きくしないと、インジケーターが起動せず、エラーが報告されます。以下は、さまざまなモードとテスターでの作業方法を示すビデオです。 重要!インジケーターに何も表示されない場合は、時間枠パラメーターが正しく選択されていないか(現在のパラメーターよりも大きい必要があります)、端末に選択した時間枠の履歴がありません。それをロードするには、この時間枠でチャートを
スタイルが重要だから
キャンドルの色や背景の明暗を変えたり、グリッドを付けたり消したりするために、いちいちプロパティをクリックするのが面倒なのはよくわかります。ここでは、1つのクリックで解決策です。 トレーダーが望むキャンドルのスタイルを選択するための3つのカスタマイズ可能なボタン。 昼と夜のモードを切り替えるには、1つのボタン。 チャート上のグリッドを表示または非表示にするには、1つのボタン。 ***** 設定で、ボタンを画面上のどこに表示するかを選択できます*****。 私の他の製品をチェックすることを検討してください https://www.mql5.com/en/users/javimorales.fer/seller
ストキャスティックRSIとは何ですか?
ストキャスティックRSI(StochRSI)は、テクニカル分析で使用される指標で、ゼロから1(または一部のチャートプラットフォームではゼロから100)の範囲で、標準の価格データではなく、相対強度指数(RSI)の値の集合にストキャスティックオシレーター式を適用して作成されたものです。
執筆者
ハビエル・モラレス
FREE

The Urgently indicator is designed to quickly determine the situation in the market, reflect the state of the market and signal profitable levels for opening trades. Market conditions change quickly enough, requiring constant calibration of trading strategies. Recommended for use in conjunction with any of the oscillators. The Urgently forex market trend indicator shows the trend direction and entry points. It smooths out price fluctuations when generating a signal by averaging the data and the

'Circle Rising Point' is an indicator based on the cycle theory. No matter whether your trading cycle is short or long, you can use this indicator to find the rise and fall points of different cycles and different bands. Therefore, the signals displayed to you on charts of different cycles are different, and applicable to left side transactions. This indicator is recommended to be used together with the multi cycle window for analysis. Indicator introduction Applicable products This indicator is
FREE
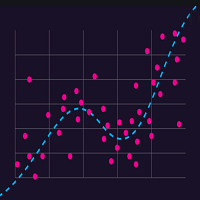
The Regression Channel consists of two lines equidistant above and below the regression trend line. The distance between the channel boundaries and the regression line is equal to the deviation of the maximum closing price from the regression line, only this definition corresponds to the most recent regression points.
The term regression refers to the field of statistics. The center line of the channel is the trend line. To calculate it, the method of least squares is used. The line above the

Investment Castle Chances — Clear Buy & Sell Signals
The Investment Castle Chances indicator marks buy and sell opportunities right on your chart, with two strengths of signal so you can weigh each setup at a glance.
What it does for you Two signal strengths: Buy / Sell on orange candles, and Strong Buy (green) / Strong Sell (red) for higher-conviction setups. On-chart and obvious: act when you see the signal — no scanning or second-guessing. Flexible: trade the signals directly, or use them t
FREE

Mega Spikes Max is a specialized indicator for Boom and Crash synthetic indices that generates trading signals with automatic alert notifications. Features The indicator analyzes market conditions using proprietary algorithms and displays buy/sell arrows directly on the chart. It works specifically with Boom and Crash indices on M5 timeframe. Signal generation combines multiple technical analysis methods to identify potential trading opportunities. The system provides two TP levels and SL calcu

Este poderoso indicador analisa o gráfico e mostra zonas de Rejeição de Preços! Isto é, locais onde o preço foi, mas não foi aceito pelo mercado! A visualização desta zona de Rejeição, facilita o entendimento do trader na tomada de decisões de onde operar e como operar!
O indicador é composto por 4 linhas, sendo classificadas em 2 grupos: Linhas Vermelha e Amarela: Denotam os extremos onde o preço conseguiu chegar, mas não foi aceito! Linhas Laranja e Azul: A partir delas, denotam o Início da z
FREE

The Pirates MACD is a Momentum Indicator that shows us not just the Classical MACD, it also shows us high priority trades. the user has an option of selecting among several options the best settings that suits their trading style, even if one has no trading style, Pirates always find a way to survive hence the Pirates MACD is equipped with easy to understand tools. that reduce the strain on ones analysis giving them visual advantages over classical MACD techniques.
This product is made as an e
FREE
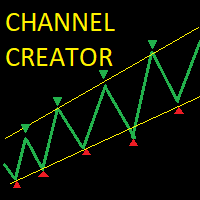
The auto-channel indicator creates a top line and bottom line that encloses a channel within which the symbol has been trading. The channel is created by finding high points for the top line and low points for the bottom line, these points are shown with arrows. A line of best fit is then plotted through these points and extended until the end of the chart. This indicator is useful for trading both within the channel and for breakouts. Inputs: MAPeriod - The moving average period over which the

価格チャネルは、現在の市場状況を分析するためのトレーダーの主要なツールです。その助けを借りて、あなたは将来の価格行動をうまく予測することができますが、利益を上げる主な要因はタイムリーな決定です。モニターを常に見ることは不可能であるため、これはしばしば問題になります。
このインジケーターは、異なる期間(高速と低速)の2つのトレンドチャネルを自動的に構築および更新します。傾向は線形回帰を使用して決定されます。自分で作成できるカスタムチャネルを1つ使用することもできます。
インジケータは、チャネルをパーセンテージゾーンに分割します。関心のある領域をパーセンテージで指定できます。価格がこのゾーンに達すると、通知が届きます。
このインジケーターの興味深い機能は、発散シグナルの受信です。これは、価格が異なる期間の反対のチャネルゾーンにある場合です。これは強いシグナルです。
「shift」パラメータは、チャネルを構築するときのスモールフォワードを定義します。
次の種類の通知を使用できます:電子メール、プッシュ通知、アラート、および任意のサウンドをwav形式で再生します。

移動平均 (MA) インジケーターのマルチ通貨およびマルチタイムフレームの変更。ダッシュボードでは、インジケーターの現在の状態 (Fast MA と Slow MA のブレイクアウトとタッチ (価格別)、および MA ライン同士の交差 (移動平均クロスオーバー)) を確認できます。パラメーターでは、任意の通貨とタイムフレームを指定できます。また、インジケーターは、価格がラインに触れたことやラインが交差したことについて通知を送信できます。ピリオド付きのセルをクリックすると、このシンボルと期間が開きます。これは MTF スキャナーです。チャート上で複数のダッシュボードを実行できます。
インジケーターは、現在のチャートに Fast MA と Slow MA ラインを表示します。チャートの MA タイムフレームを選択し、他のタイムフレーム (MTF MA) から MA を監視できます。2 セットの MA のホットキーは、デフォルトでは「1」と「2」です。
ダッシュボードをチャートから非表示にするキーは、デフォルトでは「D」です.
パラメーター Fast MA Averaging pe
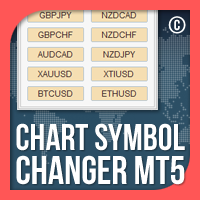
MT5のチャートシンボルチェンジャーは、パネルのシンボルボタンをクリックするだけでアタッチされている現在のチャートシンボルを変更するオプションを提供するインジケーター/ユーティリティです。 MT5のチャートシンボルチェンジャーは、あなたが注目して最もトレードしたいペアを追加することにより、あなたの個人的な好みに合わせて32のシンボルボタンを設定するオプションを提供します。このようにすると、数回クリックするだけでチャート上で市場をより速く表示できるため、チャンスを逃すことはありません。
MT5インストール/ユーザーガイド用チャートシンボルチェンジャー | 購入した製品の更新
特徴 パネル上の32のカスタマイズ可能なシンボル。これにより、同じチャートでお気に入りの機器を監視できます。 あらゆるシンボル/金融商品、口座タイプ、ブローカーでスムーズに機能します
MT5のチャートシンボルチェンジャーは、トレードとリスク管理、および一般的な手動トレードを支援するために、トレードパネルの形式でも提供されます。 手動トレードパネルMT5: https://www.m
FREE

Golden_Star MT5 は、プロのトレーダーのグループによって開発されたMT5プラットフォームのプロのトレンドインジケーターです。 その作業のアルゴリズムは、元の著者の方法に基づいています。これにより、潜在的なトレンド反転ポイントを高い確率で見つけ、トレンド形成の開始時に市場に参入するためのシグナルを受信できます。 このインジケーターは、外国為替で金、暗号通貨、通貨ペアを処理するのに適しています。 アラートシステム(アラート、電子メール、モバイル通知)は、複数の取引商品を同時に監視するのに役立ちます。 チャートにインジケーターをインストールするだけで、インジケーター信号が表示されるとアラートがトリガーされます。 私たちのアラートシステムを使用すると、ポジションを開くためのシグナルを見逃すことはありません! Golden Starインジケーターを使用して取引するのは非常に簡単です。インジケーターラインが緑色の場合、買いポジションを開きます。 インジケーターラインが赤の場合は、売りポジションを開きます。
このインジケーターを購入すると、次のようになります。
優れたインジケーター信
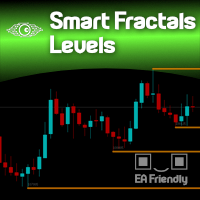
Support & Resistance taken to the next level. The Smart Fractals Levels indicator is based on Bill Williams' theory of identifying Support & Resistance levels through the use of the so-called "fractals". The difference between common Support and Resistance regions drawn on chart and the Smart Fractals Levels is that only NEW and untouched levels will still stay drawn on the chart (if you decide so), and also based on your own set of rules, totally configurable from the "settings" menu of the ind
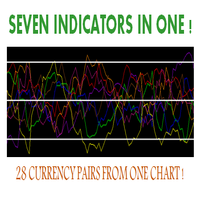
Hello, This indicator is a unique high reliability 7-in-1 multicurrency indicator comprising these sub-indicator’s: A Trend Power Crossover Indicator. A Percent Change Crossover Indicator. A Currency Overbought/Oversold Indicator. A Currency Deviation Indicator. A Currency Impulse Signal Indicator. A Trend Power Indicator. A Currency Volatility Indicator. The main advantage of this indicator is that it's reasoning by currency and not by currency pair. The values of each sub-indicator are calcula
FREE
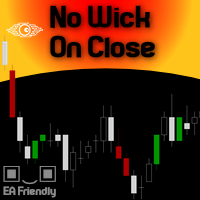
We at Minions Labs love to study, challenge and discover new facts about Price Behavior in current markets. We would NOT call it Price Action because today this is a word totally overused and means, thanks to the False Prophets out there, absolutely NOTHING.
The study hypothesis we propose is this: Some Assets, in certain Timeframes, present a behavior of Price continuity when the candlesticks close without a Wick on them... So the purpose of this indicator is to "color" those candlesticks who
FREE
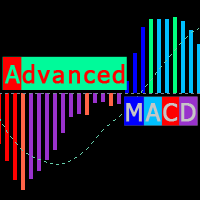
Modified MACD, for technical analysis of charts, with color backlight of histogram signals. The indicator highlights, the direction of the histogram movement, the change in the direction of the histogram movement, the histogram peaks, the interaction of the histogram and the signal curve. Also, the indicator makes it easier to find convergences / divergences between bars and the histogram (which serve as a powerful signal in some trading systems using the MACD indicator). Color designation of Ad

Clear Dom
This Indicator shows a pressure color box based on depth of market of the current symbol. Notice that it only works when book information is received.
You decide weather you want or not to display higher (ask) and lower (bid) levels of book.
The proportion ratio is calculated using volumes read from the book. You can read the actual pressure in the market any time.
Indicator parameters: color_Ask -> ASK box color and ASK value line color color_Bid -> BID box color and BID value li
1. What is this Rising volatility and falling volatility are not the same, whether it is academic research or actual testing has shown this point. The original ATR indicator is calculated by putting up and down fluctuations together. This indicator is to calculate separately the upward volatility and the downward volatility, which can better help you study the market.
2. Indicator description There are two modes for the calculation of this indicator, as shown in the fo

This indicator shows supports and resistences calculated form historical data when market was swing. When market was swing ? When ADX was below 25 for some bars. In fact market can be considered without a trend. I mean and suggest timeframes H4 and Daily. Using that lines in the present you see resistance and support. More lines are distant and best is possible profit. Every ADX parameters can be set, so colors, swing market bars number.
I am available to get feedback or modify code. Thanks Ale

The Bolliger Bands On-Off let you control the indicator using the keyboard or a button . You can choose if you want the indicator always shown or always hided while switching among different time frames or financial instruments . ---> This indicator is part of Combo Indicator OnOff
The Bollinger Bands identify the degree of real-time volatility for a financial instruments . A lower amplitude corresponds to a low volatility, conversely a greater bandwidth corresponds to high volatility.
FREE
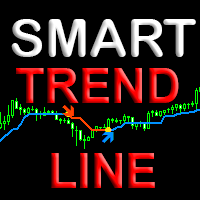
Индикатор с уникальным авторским алгоритмом определения направления тренда. Показывает лучшие результаты определения тренда на любых валютных парах, акциях, криптовалюте без перерисовки результата. Имеет встроенную статистику, что поможет сразу определить прибыльность текущей пары и таймфрейма. Использует паттерны Price action в связке с уникальным алгоритмом фильтрации. Подходит как новичкам так и профессионалам для всех видов торговли. Как выбрать прибыльный таймфрейм и оптимизировать индикато
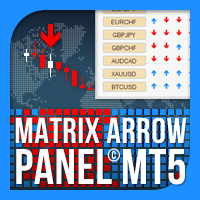
マトリックスアローインジケーターマルチタイムフレームパネルMT5 は無料のアドオンであり、マトリックスアローインジケーターMT5の優れた資産です。これは、5つのユーザーがカスタマイズした時間枠と合計16の変更可能なシンボル/機器の現在のマトリックスアローインジケーターMT5信号を示しています。ユーザーは、マトリックスアローインジケーターMT5で構成される10の標準インジケーターのいずれかを有効/無効にするオプションがあります。マトリックスアローインジケーターMT5のように、10の標準インジケーター属性もすべて調整可能です。マトリックスアローインジケーターマルチタイムフレームパネルMT5には、16個の変更可能なシンボルボタンのいずれかをクリックすることで、現在のチャートを変更するオプションもあります。これにより、異なるシンボル間ではるかに高速に作業でき、取引の機会を逃すことはありません。
この無料の マトリックスアローインジケーターマルチタイムフレームパネルMT5 アドオンを使用する場合は、ここでマトリックスアローインジケーターMT5を別途購入する必要があります: https://w
FREE

これは、フィボナッチから派生したハーモニックパターンのユーザーが利用できる最も完全なツールです。
完全にカスタマイズ可能:レベル、色、線種、太さ。
研究に応じて使用されるフィボナッチレベルを選択してください。
デフォルトでは、ツールには、尊重されることが証明されているフィボナッチレベルがすでにありますが、ユーザーはこれを自由に変更できます。
フィボナッチレベル、長方形(塗りつぶしありまたは塗りつぶしなし)、および境界のある水平線の描画方法の色、線種、太さを選択します。
フィボナッチ撤回:4セット(最大25レベル、最大26レベル、最大27レベル、最大28レベル)、それぞれ異なるショートカットで実行可能。
フィボナッチプロジェクション:最大10レベルの1セットで、特定のショートカットで実行できます。
長方形:長方形が自動的にプロットされる間隔を定義し、特定のショートカットで実行可能にします。
制限された水平線、特定のショートカットで実行可能。
ショートカットを修正しました:プロットされたすべてのオブジェクトを削除し、オブジェクトをさかのぼって削除し、長方形のみを削除し、
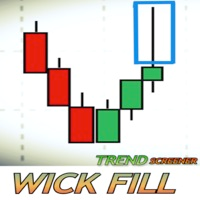
トレーディングにおけるウィックとは何ですか?このスクリーナーはどのように機能するのですか? ローソク足におけるウィックは、価格の拒否反応を反映しています。このスクリーナーは埋められる大きな可能性を持つウィックを識別しようとしています。このスクリーナーは、トレンド市場で発生するウィックに焦点を合わせています。
このスクリーナーは、ライブで取引されている潜在的なウィックの全体像を提供するダッシュボードを表示します。それは、時間枠によって整理されたすべてのペア/インスツルメンツを示しています。買いのチャンスは「UP-W」と名付けられます。彼らはダッシュボード上で緑色に表示され、売りの機会は、''DN-W''と名付けられ、赤で表示されます。トレーダーは画面に表示されたダッシュボード上で希望のウィック機会をクリックする必要があり、スクリーナーはその特定のトレードを表示します。スクリーナーは、トレーダーが選択したインプットに基づき、機会を表示します。金やUS30などの商品は、通常、ブローカーによって契約サイズが異なることに注意してください。同じコントラクトサイズのペアまたは商品を使用するように

Investment Castle トレンドライン — プライスアクションを自動描画
優れたトレードはトレンドを読むことから始まります——需給、上昇・下降チャネル、トレンドライン、包み足。Investment Castle トレンドラインは、そのプライスアクションの全体像をチャート上に自動でまとめ、推測とストレスを減らしてトレンドを捉えられるようにします。
このインジケーターができること 自動トレンドライン: 主要なトレンドラインを自動描画。手動作図は不要です。 プライスアクションの文脈: 構造・方向・重要な転換点がひと目で分かります。 ストレス減・判断が速い: 描画ではなく判断に時間を使えます。 実証済みのプライスアクションに基づく: プロがトレンドを捉えるのと同じ手法。 どこでも動作: あらゆる銘柄・あらゆる時間軸。
対象: エントリー前にトレンドを把握したいプライスアクション・トレーダー。
リスク警告: 取引には大きな損失リスクが伴います。必ずまずデモ口座でテストし、ご自身が許容できるリスク設定を使用してください。過去の成績は将来の結果を保証するものではありません。
FREE

The intelligent algorithm of the Ikiru indicator accurately detects the trend, filters out market noise and generates input signals and exit levels. Functions with advanced statistical calculation rules improve the overall performance of this indicator. A convenient indicator for technical analysis and is suitable for trading binary options. All entry points are ideally optimal points at which movement changes. Entry points should be used as potential market reversal points.
It is a hybrid tre
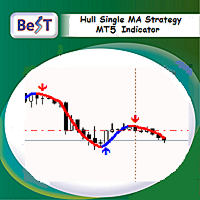
BeST_Hull Single MA Strategy is an Metatrader Indicator based on the famous indicator Hull Mov.Average . This indicator can display the Single HMA Strategy of just 1 Hull MAvg. It uses added internal filters locating the most likely Entries while it can be used as a standalone system or as an add-on to other ones.
Generally the Hull Moving Average (HMA - developed by Alan Hull) is a directional trend indicator . It captures the current state of the market and uses recent price action to determin

This indicator recognizes all support and resistance levels. A number of unique high-performance techniques have been applied, which made the existence of this indicator possible.
All formed channels are naturally visible: horizontal linear linear parabolic cubic (Polynomial 3 degrees - Wave) This is due to a bundle of approximating channels. The formed channels form "standing waves" in a hierarchical sequence. Thus, all support and resistance levels are visible.
All parameter management is i

The indicator connects the price in a cyclical-wave relationship. Thus, all intersection points will be optimal points at which the movement changes taking into account the indicator period. Crossing points can be used as potential market reversal points. But do not forget that the approach must be complex, the indicator signals require additional information to enter the market.
Suitable for forex, futures and binary options without redrawing. It gives a lot of signals, which requires additio

Investment Castle Engulfing — Never Miss an Engulfing Candle
Whether you scalp or trade the daily, bullish and bearish engulfing candles are some of the most reliable signals — but spotting them across timeframes is tedious and easy to miss. This indicator finds them for you, including an engulfing candle forming on a higher timeframe while you trade a lower one.
What it does for you Automatic engulfing detection: bullish and bearish engulfing candles are flagged for you. Multi-timeframe aware
FREE
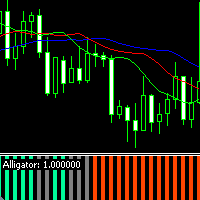
The modified Alligator indicator is designed as an oscillator. Facilitates the analysis of the Alligator indicator values by signaling the trader about market changes using a colored histogram. Histogram color values
Medium Spring Green - uptrend Orange Red - downtrend Gray - lateral movement (flat) Parameter values jaw_period - jaw period teeth_period - teeth period lips_period - lips period jaw_shift - jaw shift teeth_shift - teeth shift lips_shift - lips shift ma_method - method for calculat

Price reach indicator. It also serves as the perfect term for supports and resistance. I use it in two experts. The basic tool for professional trading. The indicator analyzes the last 500 bar and uses this to determine the levels ( but it doesn't predict the future ) . Personally, I use it on TF H1. It is very simple. Four lines on chart and that's all. Only two input parameters. Thousands of indicators. Why this? Is good ? No! Is very good. Please test the indicator prior to purchasing. You

Know exactly how much time remains before the current candle closes. HMS Candle Timer MT5 is a lightweight and customizable candle countdown indicator designed for traders who want a clear view of the remaining time on the active candle. The countdown is displayed directly near the current candle, keeping important timing information visible without turning your chart into a complicated dashboard. Whether you trade lower timeframes or monitor longer market structures, HMS Candle Timer provides a
FREE
53% OFF until December 31 (Normal price $125)! Don't miss the opportunity to have this invaluable tool!
This is a totally automated multi timeframe support and resistance levels finder on every MT5 chart. No manual work! Just drop this indicator on a chart and you will have the S/R levels always up to date. It is very convenient and helps the trader to anticipate possible stalls and reversions in price movements. The levels are displayed as lines and each timeframe has a different color. The i

Это классический вариант реализации экспоненциальной скользящей средней с коррекций ошибки, какой используется в индикаторах DEMA и TEMA. Соответственно названию, глубина коррекции ошибки увеличена до 33. Индикатор оптимизирован. Потребляет минимально возможные ресурсы. Достаточно быстр, учитывая объёмность вычислений. Может накладываться на другие индикаторы. Как и обычные скользящие средние, nEma_33 не перерисовывается (за исключением нулевого бара). Требуется история > Период*33*33. Согласно
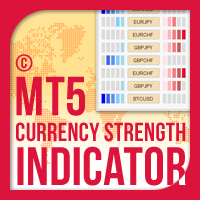
MT5の通貨強度インジケーター は、初心者またはエキスパートトレーダーにとって革新的なソリューションです!通貨の強さの概念は、価格アクションと組み合わされ、8つの主要通貨の通常の28の組み合わせを除いて、任意のシンボル/ペアに適用できるため、まったく新しいレベルになります。つまり、すべての通貨、メジャー、マイナー、エキゾチック、コモディティ、クリプト(インデックスではない)を含む、任意のペアの長所または短所をトレードできます。これは、複雑な強度線を解読したり、複雑な強度線を解読したりすることなく、任意のペアの2つの部分の強度/弱さのバランスを視覚的に通知する色付きのバーを使用することにより、32個のシンボルを一目で明確に把握できる画期的な製品です。他の従来の通貨強度ソリューションと同様に、ヒストグラム。
MT5の通貨強度インジケーター は、あなたが注目し、最も取引したいペアを追加することにより、あなたの個人的な好みに合わせて32のシンボルボタンを構成するオプションを提供します。このように、あなたは一目であなたのチャート上で現在の市場の全体像を見ることができるので、あなたは機会を逃す

Trend Everest MT5 indicator is a trend following indicator that aids in decision making. It is based on the calculation of ATR that assist and the average hull. A key issue is that the Trend Everest MT5 nominee does not repaint, so you can backtest with greater confidence. When it is Green, UpTrend When it is a Red downtrend. Not that the Market is fractal, so the longer the graphic time, the greater its degree of assertiveness.

-ウィックフィルトレンドの考え方
市場のボラティリティが高い時、ローソク足はその移動の途中で芯を作る傾向があります。ローソク足の芯は、価格の反発を反映しています。これらのウィックは、その方向に押す巨大なボリュームを持っているので、時間の大半は満たされています。Wick Fill Trendは、トレンド相場に焦点を当て、そのチャンスをスキャンします。
エントリーポイント、利益確定、損切りなどのライブシグナルを表示する成功率シミュレーターダッシュボードを備えています。この成功率シミュレーターはバックテストとして使用することができ、過去にどのインプットがより良い利益を上げたかを確認することができます。この成功率シミュレーターは、バックテストとして使用することができ、過去にどの入力がより良い利益を上げたかを確認することができます。
-インプット
-トレンドウィック。この入力は、インディケータがスキャンしなければならないウィックの大きさを決定します。この値は%で測定されます。デフォルトでは20%です。
-シグナル数 シグナル数:成功率シミュレーターでスキャンするシグナルの数を指定しま
マルチタイムフレーム対応、カスタマイズ可能なビジュアルシグナル、設定可能なアラートシステムを備えたMoney Flow Index(MFI)インジケーター。
フリーランスのプログラミングサービス、アップデート、その他のTrueTL製品は MQL5プロフィール でご利用いただけます。
フィードバックとレビューを大変感謝いたします!
MFIとは? Money Flow Index(MFI)は、特定の期間にわたって証券に流入・流出するマネーフローの強さを測る、ボリューム加重モメンタムオシレーターです。RSIと同様に機能しますが、ボリュームを組み込むことでより包括的なモメンタム指標となっています。値は0から100の範囲で変動します。 MFI値が80を超えると買われすぎ状態を、20を下回ると売られすぎ状態を示します。価格上昇時にMFIが上昇すればトレンドを確認し、MFIと価格の乖離は差し迫った反転を警告する可能性があります。ボリューム要素により、MFIはトレンドの燃え尽きを検出するのに特に効果的です。 機能: ボリューム加重モメンタム計算 矢印と垂直線によるビジュアルシグナルマーカー 設定
FREE

Looking for a quality pivot point indicator? So Prosecution is what you need! To identify pivot points, the Prosecution indicator analyzes many conditions, as the aggregate analysis provides a more accurate picture of the market situation.
What are pivot points? Pivot point analysis is often used in conjunction with the calculation of support and resistance levels, as is the case with trend line analysis. When analyzing pivot points, the first support and resistance levels are calculated u
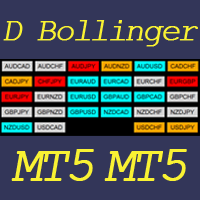
This indicator helps to visualize the Bollinger Band status of 28 pairs. With the feature of color panel, alert, and notification features, user can catch the potential Bollinger Bounce opportunities from 28 main pairs on one Dashboard quickly. Dashboard Bollinger Band is an intuitive and handy graphic tool to help you to monitor all 28 pairs and provide trading signals based on the Bollinger Bounce Rules (Overbought/Oversold and Bollinger Band Cross).
Color legend clrOrange: price is above the
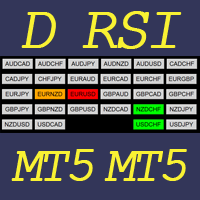
This indicator helps to visualize the RSI status of 28 pairs. With the feature of color panel, alert, and notification features, user can catch the potential buy and sell opportunities when the 28 main pairs cross the oversold/overbought area on one Dashboard quickly. Dashboard RSI is an intuitive and handy graphic tool to help you to monitor all 28 pairs and provide trading signals based on the RSI Rules (Overbought/Oversold and Stochastic Cross).
Color legend clrOrange: RSI signal is above th
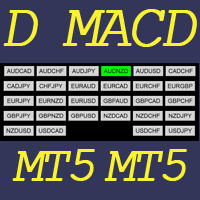
This indicator helps to visualize the MACD status of 28 pairs. With the feature of color panel, alert, and notification features, user can catch the potential buy and sell opportunities when the 28 main pairs’ fast EMA cross the slow EMA on one Dashboard quickly. Dashboard MACD is an intuitive and handy graphic tool to help you to monitor all 28 pairs and provide trading signals based on the MACD Rules (Fast EMA Cross Slow).
Color legend clrRed: MACD fast EMA down cross MACD slow EAM and MACD f
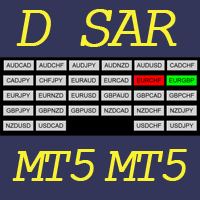
This indicator helps to visualize the SAR status of 28 pairs. With the feature of color panel, alert, and notification features, user can catch the potential buy and sell opportunities when the 28 main pairs’ SAR dots are switching between the above/below of candles on one Dashboard quickly. Dashboard SAR is an intuitive and handy graphic tool to help you to monitor all 28 pairs and provide trading signals based on the SAR Rules (SAR dots are switching between the above/below of candles).
Color
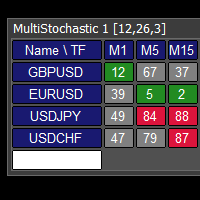
This tool monitors Stochastic indicators on all time frames in the selected markets. Displays a table with signals to open a BUY trade (green) or SELL trade (red). You can set the conditions for the signal. You can easily add or delete market names / symbols. If the conditions for opening a trade on multiple time frames are met, you can be notified by e-mail or phone message (according to the settings in MT5 menu Tools - Options…) You can also set the conditions for sending notifications. The li
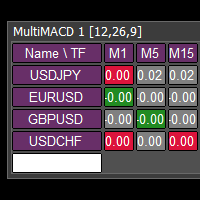
This tool monitors MACD indicators on all time frames in the selected markets. Displays a table with signals to open a BUY trade (green) or SELL trade (red). You can set the conditions for the signal. You can easily add or delete market names / symbols. If the conditions for opening a trade on multiple time frames are met, you can be notified by e-mail or phone message (according to the settings in MT5 menu Tools - Options…) You can also set the conditions for sending notifications. The list of
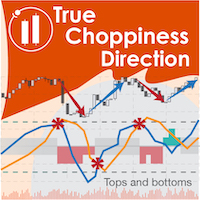
True Choppiness Direction determines if the market is choppy (trading sideways) or if it is trending, as well as the trend direction and strength (green=up, red=down, grey=no trend) . The underlying algorithm is designed to detect trend movements even in the presence of noisy market data, please see screenshots. Trend strength is indicated by taller or shorter red/green fill. Choppiness index is range-bound between -50 (very trendy) and +50 (very choppy). This is a custom algorithm designed
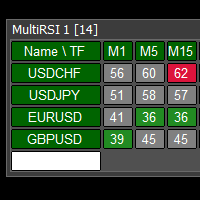
This tool monitors RSI indicators on all time frames in the selected markets. Displays a table with signals to open a BUY trade (green) or SELL trade (red). You can set the conditions for the signal. You can easily add or delete market names / symbols. If the conditions for opening a trade on multiple time frames are met, you can be notified by e-mail or phone message (according to the settings in MT5 menu Tools - Options…) You can also set the conditions for sending notifications. The list of s
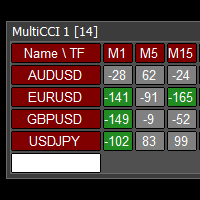
This tool monitors CCI indicators on all time frames in the selected markets. Displays a table with signals to open a BUY trade (green) or SELL trade (red). You can set the conditions for the signal. You can easily add or delete market names / symbols. If the conditions for opening a trade on multiple time frames are met, you can be notified by e-mail or phone message (according to the settings in MT5 menu Tools - Options…) You can also set the conditions for sending notifications. The list of s
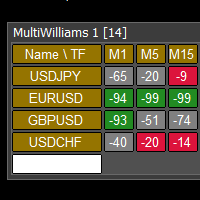
This tool monitors WilliamsPR indicators on all time frames in the selected markets. Displays a table with signals to open a BUY trade (green) or SELL trade (red). You can set the conditions for the signal. You can easily add or delete market names / symbols. If the conditions for opening a trade on multiple time frames are met, you can be notified by e-mail or phone message (according to the settings in MT5 menu Tools - Options…) You can also set the conditions for sending notifications. The li
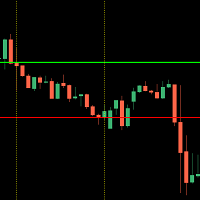
This indicator shows you the higher high and lower low of a certain period of time.
It is easy to use - select your desired time frame (current, 15Min, 1H, 1D) and the corresponding number of candles.
The indicator measures the highest and lowest point within the specified range and automatically draws the two corresponding lines.
The design of the lines is up to you!
Should the trend break one of the drawn lines with a closed candle, a message will be sent to you by the built-in alarm funct
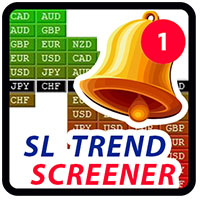
HI guys this my developing indicator 1st version alert logic work well.. this indicator using can you stronger currency and top weaker currency find well,this;s indicator multy MTF time frame strength work.very good for SL trend screener intraday trader and long time trader, very easily can you watch stronger and weaker index.I hope to more improve this future further,thank you if you want more information please pm me
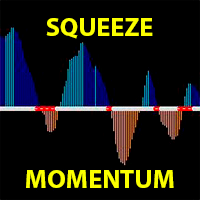
TTM Squeeze Momentum is a volatility and momentum indicator introduced by John Carter of Trade the Markets (now Simpler Trading), which capitalizes on the tendency for price to break out strongly after consolidating in a tight trading range.
This derivative Squeeze Momentum indicator attempts to identify periods of consolidation in a market. In general, the market is either in a period of quiet consolidation or vertical price discovery. By identifying these calm periods, one has a better oppor

ボリューム方向MT5
通常、現在の音量が前の音量よりも大きい場合、音量インジケーターにはデフォルトの色の変化があります。これは重要ですが、あまり役に立ちません。
このため、このインジケーターは、通常のボリュームに加えて、ろうそくが強気または弱気の場合、異なる色をペイントするように作成されました。デフォルトでは、強気の場合は青、弱気の場合は赤ですが、これらの色は トレーダーの好み。
あなたがあなたの取引を改善するのを助ける私の他の指標をチェックすることを忘れないでください。 ボリューム方向MT5
通常、現在の音量が前の音量よりも大きい場合、音量インジケーターにはデフォルトの色の変化があります。これは重要ですが、あまり役に立ちません。
このため、このインジケーターは、通常のボリュームに加えて、ろうそくが強気または弱気の場合、異なる色をペイントするように作成されました。デフォルトでは、強気の場合は青、弱気の場合は赤ですが、これらの色は トレーダーの好み。
あなたがあなたの取引を改善するのを助ける私の他の指標をチェックすることを忘れないでください。

Auto Point of Control Indicator for those who use the Market/Volume Profile in their trading, who are familiar with the concepts of POC and VAH/VAL. I often noticed that it is inconvenient to change the zone of POC level calculation. Also it is not always convenient to use periodic areas, such as Day, Hour, etc. So I decided to develop a fully automated POC, where the zones change each other through the algorithm in the script. How to use POC - everyone decides for himself. They can be stop-loss

Bollinger Prophecy is a multicurrency trending tool for technical analysis of financial markets. Draws 3 lines on the chart that show the current price deviations of the currency pair. The indicator is calculated based on the standard deviation from a simple moving average. The parameters for the calculation are the standard double deviation and the period of the moving average, which depends on the settings of the trader himself. A trading signal is considered when the price exits the trading c
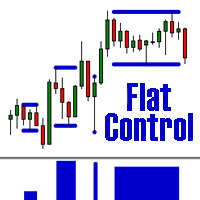
The indicator defines a trading corridor, a flat market, and corrections.
Allows you to compare the significance of different flat and trend areas (by time of existence and by volatility). This makes it possible to assess the market cycle and its mood at a glance.
That is, how long does the flat last on average, and how long is the trend and what kind of volatility they have in points.
As a rule, the longer the flat lasts, the more likely it is to accumulate the potential for a strong movement

Laguerre SuperTrend Clouds adds an Adaptive Laguerre averaging algorithm and alerts to the widely popular SuperTrend indicator. As the name suggests, Laguerre SuperTrend Clouds (LSC) is a trending indicator which works best in trendy (not choppy) markets. The SuperTrend is an extremely popular indicator for intraday and daily trading, and can be used on any timeframe. Incorporating Laguerre's equation to this can facilitate more robust trend detection and smoother filters. The LSC uses the
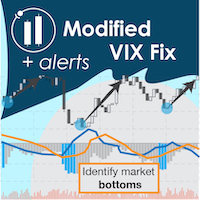
"The VIX Fix is a powerful indicator that detects market bottoms for any asset " The VIX (volatility index) is a ticker symbol of implied volatility of the S&P 500, calculated by the Chicago Board Options Exchange. VIX is a popular measure of market risk, and is one of the best measures of market bottoms that currently exists. Unfortunately, it only exists for the S&P 500... The VIX Fix was published by Larry Williams in 2007, and it synthesizes a VIX volatility index for any asset (not j
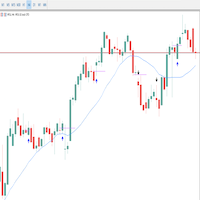
Multset This is inte_plays indicator, which helps the trader to enter the trades appropriately it plots an arrow when there is appropriate environment which permits trading
Features 1. Sends push notification on mobile devices 2. Plots arrow on chart when the setting is found
TimeFrame Is suggested to be used on higher time frames only, especially starting 15min and above for proper moves
For more informations please Visit: https://t.me/Tz_Fx_Lab Subscribe to our Youtube channel: https:
FREE

Welcome to the Minions Labs' reinterpretation of the Classic Bulls & Bears Power , developed by Alexander Elder a long ago. Since the 2 indicators: Bull Power and Bear Power were histogram-based indicators and having 2 indicators in the same chart and occupy too much screen, we decided to mix them into ONE Line and Color-based indicator, which give us all the information we need. The Bull & Bear Power indicators help you determine the strength of BUYERS (Bulls) vs. SELLERS (Bears). Basically, it
FREE

A powerful oscillator that provide Buy and Sell signals by calculating the investor liquidity. The more liquidity the more buy possibilities. The less liquidity the more sell possibilities. Please download the demo and run a backtest!
HOW IT WORKS: The oscillator will put buy and sell arrow on the chart in runtime only . Top value is 95 to 100 -> Investors are ready to buy and you should follow. Bottom value is 5 to 0 -> Investors are ready to sell and you should follow. Alert + sound will appe

Institutional Pivot is a result of 5 years of research on order flow analysis in the Forex market and Nasdaq, seeking mounting and defense positions. The one of the best support and resistance points you can have right now available to everyone. You can opt for the Forex, CME and Brazilian markets in the settings
Choosing the market just plot on the chart to make your trades
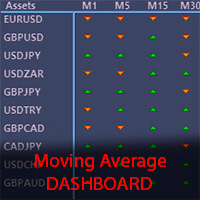
The Moving Average Dashboard indicator allows you to see the relationship between a fast and a slow moving average.
This indicator is working on multiple symbols and up to 21 timeframes. It's allows you to configure the fast and slow moving averages to whatever period, method or price is appropriate
The Moving Average Dashboard saves you time as you can use the indicator to scan multiple currency pairs or other symbols in just one window.
Installation Download the Indicator in your MT5 termi
MetaTraderプラットフォームのためのアプリのストアであるMetaTraderアプリストアで自動売買ロボットを購入する方法をご覧ください。
MQL5.community支払いシステムでは、PayPalや銀行カードおよび人気の支払いシステムを通してトランザクションをすることができます。ご満足いただけるように購入前に自動売買ロボットをテストすることを強くお勧めします。

取引の機会を逃しています。
- 無料取引アプリ
- 8千を超えるシグナルをコピー
- 金融ニュースで金融マーケットを探索