Best trend indicator
- インディケータ
- バージョン: 1.10
- アップデート済み: 4 8月 2022
- アクティベーション: 10
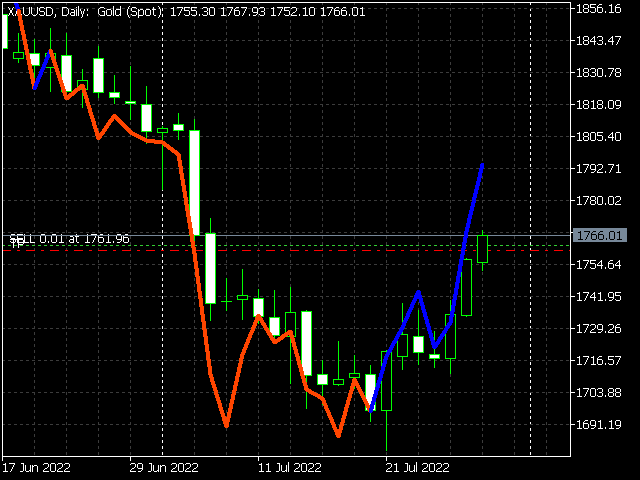
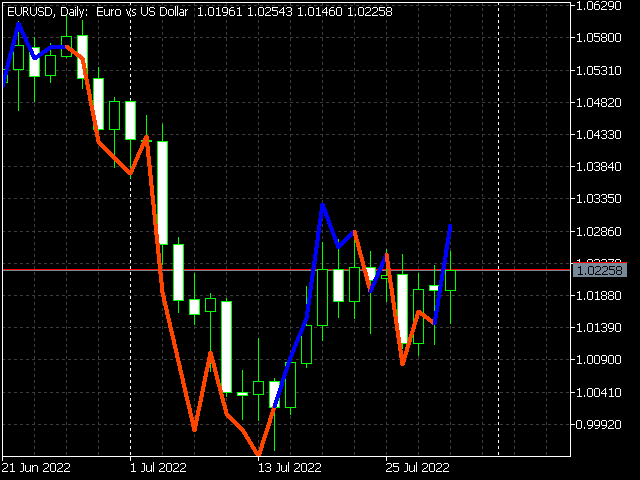
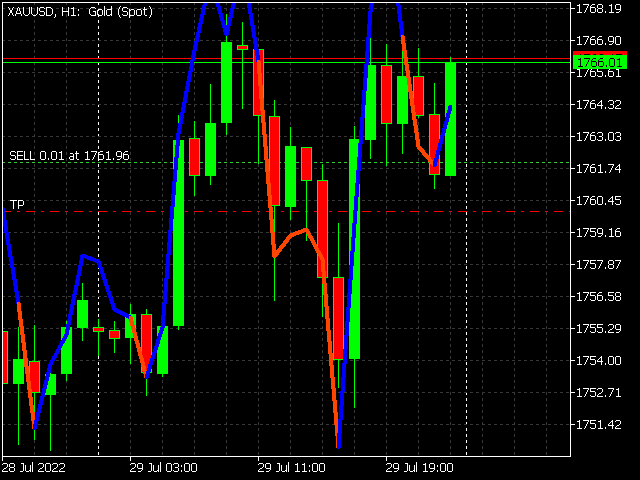
これは、トレンドしひょー指標は、あか赤とみどり緑のじっせん実線をはんえー反映して、しじょー市場かかく価格のへんか変化をはんえー反映して、じっせん実線のいろ色のへんか変化は、しじょー市場のへんか変化がはっせー発生しているかのー可能せー性がひじょー非常にたかい高いです!
みどり緑のせん線はしじょー市場かかく価格がうえ上ます升しているきかん期間をしめし示し、あか赤のせん線はしじょー市場かかく価格がげらく下落しているきかん期間をしめし示します。
このメトリクスをよりよく しよー使用するために、このメトリクスを こーにゅー購入して しよー使用する まえ前に、このメトリクスの むりょー無料デモ ばん版をダウンロードしてテストすることをお すすめ勧めします