 MetaTrader 5
 Эксперты
 Индикаторы
 Библиотеки
 Утилиты
 Виджеты
 Правила
Смотри обучающее видео по маркету на YouTube
Как купить торгового робота или индикатор
Запусти робота на
виртуальном хостинге
виртуальном хостинге
Протестируй индикатор/робота перед покупкой
Хочешь зарабатывать в Маркете?
Как подать продукт, чтобы его покупали
Новые технические индикаторы для MetaTrader 5 - 176
 На основании сигналов технических индикаторов принимаются решения относительно открытия или закрытия сделки на фондовом и форекс-рынках. Суть индикаторов заключается в математическом преобразовании цены и/или объемов финансового инструмента для прогнозирования изменений цен в будущем.
Протестируйте технические индикаторы, чтобы лучше предсказывать поведение рынка и зарабатывать на этом.
На основании сигналов технических индикаторов принимаются решения относительно открытия или закрытия сделки на фондовом и форекс-рынках. Суть индикаторов заключается в математическом преобразовании цены и/или объемов финансового инструмента для прогнозирования изменений цен в будущем.
Протестируйте технические индикаторы, чтобы лучше предсказывать поведение рынка и зарабатывать на этом. 
Xtrade Trend Detector is an indicator capable of finding the best opportunities to take a position in any stock market. Indeed, it is a great tool for scalpers but also for Daytraders. You could therefore use it to identify areas to trade, it fits easily on a chart. I use it to detect trends on Big timeframes and take positions on Small timeframes. Don't hesitate to give me a feedback if you test it.

Pivot Point Super trend it can be used to catch price turning points and can show arrows for buying and selling. calculations are based on price peaks . you can control the price turning points by increasing the Pivot point period input on the indicator the ATR factor is for how far apart do you want the bands to be spread apart price break outs are also spotted in their early stages which will make trading much better
FREE
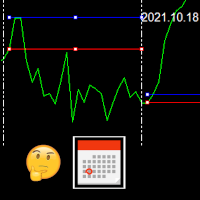
This indicator draws the high intraday price and the low intraday price of the first n minutes of the day. The chart shows the days with vertical lines and two horizontal lines to indicate the max and the min close price of the n first minutes of the day. The max/min lines start and end with the day calculated. With this indicator you can see how starts the day compared with the previous days. It is valid for any market inasmuch as the start time is calculated with the data received.
Parameter
FREE
MACros is based on Exponential Moving Average Crossover:
It can be used for: All Pairs: Forex, Cryptocurrencies, Metals, Stocks, Indices. All Timeframe All Brokers All type of Trading Style like Scalping, Swing, Intraday, Short-Term, Long-Term etc. Multiple Chart
*** MT4 Version-->> https://www.mql5.com/en/market/product/87538
Notification Setting: All type of notifications and Pop-Up available with this Indicator. (Can manually ON/OFF the notification as per requirements.)
Special Note: It

This Indicator analyses the Trend and shows signals. When you open the Chart , Indicator shows you Buy or Sell Signal as Alert. Usage: Activate Algo Trading , Activate the Indicator and drag new currencies into chart. Indicator shows you Buy or Sell Signal as Alert.
Results
- Buy Signal
- Sell Signal
- No Signal For any question please don't hesitate to contact.
FREE
Абсолютная волатильность цены для каждого дня за последние 4 недели Моя #1 многофункциональная утилита: включает 66+ функций, включая этот индикатор | Свяжитесь со мной если у вас есть вопросы | Версия для MT4 Индикатор отображается в отдельном окне, его можно переместить в любое место на графике. В настройках ввода вы можете настроить: Тема интерфейса : темная / белая; Метод расчета: цена, пункты, проценты изменения;
Размер панели Размер шрифта
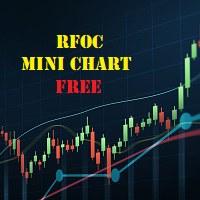
The RFOC Mini Chart was created to project a macro view of the market, which the option to select the timeframe of interest other than the main chart, it is possible to include 2 indicators: 1 - Moving average channel On the mini chart, the moving average will be created based on the prices of the selected time frame for the RFOC Mini Chart. The moving average period must be selected in the indicator settings pannel.
2 - Boillinger Band In the mini chart, a boillinger band will be created based
FREE

The purpose of the Combo OnOff indicator is combine differerent tecniques and approachs to the market in order to spot signals that occur simultaneosly. A signal is more accurate if it is validate from more indicators as the adaptive expectations can be used to predict prices.The On-Off feature and alarms help to look for the better prices to enter/exit in the markets
Moving Averages are statistics that captures the average change in a data series over time
Bollinger Bands is formed by upper
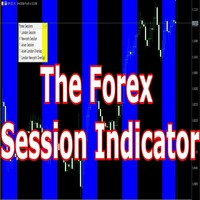
Having trouble marking where the various forex sessions start and end? Or perhaps your strategy requires you trade only in a specific session, then this is for you.
The session indicator shades the session you require in a certain color so that you can identify it easily. The sessions shown include: London session, New York session, Asian Session, Asian - London overlap and London - New York Overlap.
Difference source give varying time ranges for the various session, mostly differing by not m
FREE
The RFOC Mini Chart was created to project a macro view of the market, which the option to select the timeframe of interest other than the main chart, it is possible to include 2 indicators:
In the full version it is possible to include 2 indicators: 1 - Moving average channel On the mini chart, the moving average will be created based on the prices of the selected time frame for the RFOC Mini Chart. The moving average period must be selected in the indicator settings pannel. 2 - Boillinger Ban
FREE
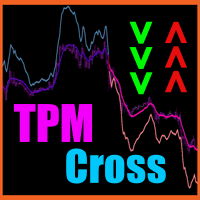
TPM Cross (trend power moving cross) - is a trend following strategy based on custom signal points. Indicator consists from main custom moving chart line and trend power line. Indicator defines up and down movements by it's trend power and custom moving direction. When current market's trend looses it's power and opposite trend starts - power trend line crosses moving and indicator plots an arrow. Main indicator's adjustable inputs : movingPeriod - period of moving line trendPeriod - period

Impulse fractals indicator - is counter-trend oriented complex market fractal pattern. Market creates bull/bear impulse, trend starts, fractals on impulsed wave are an agressive pullback signals. Buy arrow is plotted when market is bearish and it's impulse showed up-side fractal, and sell arrow is plotted when market is bullish and it's impulse showed dn-side fractal. Main indicator's adjustable inputs : impulsePeriod - main period of impulse histogram filterPeriod - smoothes impulse accordi
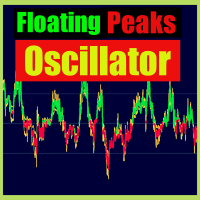
Floating peaks oscillator - it the manual trading system. It's based on Stochastik/RSI type of oscillator with dynamic/floating overbought and oversold levels. When main line is green - market is under bullish pressure, when main line is red - market is under bearish pressure. Buy arrow appears at the floating bottom and sell arrow appears at floating top. Indicator allows to reverse signal types. Main indicator's adjustable inputs : mainTrendPeriod; signalTrendPeriod; smoothedTrendPeriod; tre
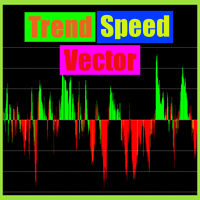
Trend speed vector - is the oscillator for manual trading. System measures trend direction and it's speed. Histogram shows 4 colors: Lime --> Strong up movement with good gain speed; Green --> Up movement with low gain speed Red --> Strong down movement with good gain speed; Orange --> Down movement with low gain speed Green and Orange histograms show weak market's movements and thуese places excluded from signal points. Buy arrow is plotted during strong down movement when bearish gain speed i
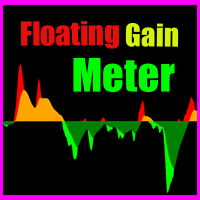
Floating gain meter is the manual trading system that works with local trends and it's scalping. Histogram represents bull/bear floating trend gain. Green color histogram shows choppy market with bullish pressure, Orange - shows choppy market with bearish pressure. Lime and Red colors shows "boiled" places in market. As a rule buy arrow is placed after strong Down movement when it's power becomes weak and choppy market starts. And sell arrow is plotted after strong Up movement when it's power

Pullback points indicator - is the manual trading system, that shows most popular market prices. Indicator measures bull/bear waves pressure and looks for "consensus" prices. As a rule these points are crossed up and down very often and opened trade has several chances to be closed in positive zone. Mainly, such points is the good base for "common profit" types of strategies. Indicator also represents "common profit" scalping method of trading as default one. Main Indicator's Features Signals
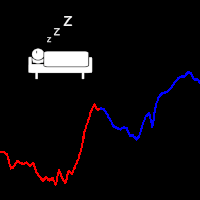
An easy indicator that simply shows the moment we connect to the market. We can easily see what has happened while we were gone because the line has two different colors that show the start time. It is only that, a visualization aid that allow us to mark the market behavior while it was night time in our country, or if we have stopped several hours. Input: Server start working date: Day of month Month Year Hour Minutes
FREE

Fast Trade Detector (FTD) - Самый правдивый индикатор, который показывает истинное
настроение Большого Игрока.
На бирже есть Игрок, у которого есть всё для того, чтобы быть в первых рядах в книге торговых
приказов (биржевом стакане). Эти сделки как индикатор рыночного настроения сильного игрока.
Вы поймёте, что всё не совсем так, как представляли раньше. Вам откроются алгоритмы и стратегии
крупного участника рынка. Исполнение индикатора в виде гистограммы в подвале графика. Гистограмма п

MAC_iCHIMOKU is an Indicator best for Scalping and Swing Both. It can be used for: All Pairs: Forex, Cryptocurrencies, Metals, Stocks, Indices. All Timeframe All Brokers All type of Trading Style like Scalping, Swing, Intraday, Short-Term, Long-Term etc. Multiple Chart This Indicator is based on Upcoming Trend Probability made with an unique Combination of Moving average, Ichimoku Cloud, Price Action and Support Resistance zones. If you are a Scalper or Swing Trader, then this Indicator will
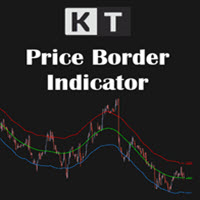
Оценивайте положение цены с помощью трех адаптивных полос KT Price Border строит на графике три плавные полосы, показывающие положение цены внутри меняющейся рыночной оболочки. Цвета по умолчанию помогают легко различать ориентиры, а дополнительные ценовые метки отображают текущее значение каждой полосы. Верхняя полоса: отмечает верхнюю границу активной ценовой оболочки. Средняя полоса: служит центральным ориентиром тренда и направления. Нижняя полоса: отмечает нижнюю границу активной ценовой об

Когда рынок меняет направление, по одной цене этот переход не всегда заметен сразу. KT XMaster Formula превращает расчет тренда и импульса в понятную пунктирную линию, желтые стрелки смены направления и мульти-таймфреймовую панель. Вы видите текущее направление, место последнего разворота показаний и можете сопоставить сигнал со структурой цены на графике. В расчете сочетаются сглаживание скользящей средней и информация на основе RSI и MACD. Вместо набора из нескольких индикаторов вы получаете о

В MetaTrader построение нескольких горизонтальных линий и отслеживание их ценовых уровней может быть утомительным. Этот индикатор автоматически строит горизонтальные линии на равных интервалах для установки ценовых оповещений, отображения уровней поддержки и сопротивления и других ручных целей. Этот индикатор идеально подходит для начинающих трейдеров на рынке Форекс, стремящихся быстро заработать на покупке и продаже. Горизонтальные линии помогают определить возможные зоны для входа в рынок
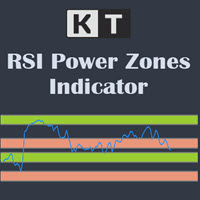
KT RSI Power Zones делит движение RSI на четыре разные силовые зоны, чтобы выявить потенциальные уровни поддержки и сопротивления с помощью индекса относительной силы (RSI).
Бычья поддержка Зона бычьей поддержки находится в диапазоне от 40 до 50. Ожидается разворот цены вверх из этой зоны.
Бычье сопротивление Зона бычьего сопротивления находится в диапазоне от 80 до 90. Ожидается разворот цены вниз из этой зоны.
Медвежья поддержка Зона медвежьей поддержки находится в диапазоне от 20 до 30. О
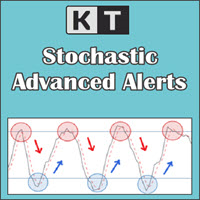
Следите за важными для вас событиями Stochastic KT Stochastic Alerts превращает привычный осциллятор Stochastic в практичный инструмент наблюдения за графиком. Индикатор отображает основную и сигнальную линии в отдельном окне и отмечает выбранные события, помогая отслеживать изменения импульса без постоянного просмотра каждой свечи. Бычьи и медвежьи пересечения Stochastic. Вход в зону перекупленности и выход из нее. Вход в зону перепроданности и выход из нее. Каждый из шести типов событий можно
Мониторинг текущей силы 8 основных валют Моя #1 многофункциональная утилита: содержит более 66 функций, включая этот индикатор | Свяжитесь со мной если у вас есть вопросы | Версия MT4 Индикатор отображается в отдельном окне, его можно переместить в любое место на графике. В настройках ввода вы можете настроить: Тема интерфейса : тёмная / белая; Префикс и суффикс, если валютные пары у вашего брокера их имеют:
(например, если символ "EURUSD .pro ", пожалуйста, установите " .pro " как
Зоны спроса / предложения: важные области, откуда цена неоднократно отскакивала в прошлом Многофункциональная утилита: 66+ функций , включая этот индикатор | Напишите мне по любым вопросам | Версия для MT4 Индикатор показывает, где цена может потенциально развернуться снова. Как правило, чем чаще цена отклонялась от уровня, тем более значимым он является. В настройках вы можете: Включить или отключить слабые зоны; Показать или скрыть описание зон; Настроить размер шрифта; Выбрат

XFlow показывает расширяющийся ценовой канал помогающий определять тренд и моменты его разворота. Используется также при сопровождении сделок для установки тейк-профит/стоп-лосс и усреднений. Практически не имеет параметров и очень прост в использовании - просто укажите важный для вас момент истории и индикатор рассчитает ценовой канал. это демонстрационная версия, ограниченная валютными парами CHF. Предназначена для ознакомления с интерактивным использованием XFLow ОТОБРАЖАЕМЫЕ ЛИНИИ
ROTATE - т
FREE

XFlow показывает расширяющийся ценовой канал помогающий определять тренд и моменты его разворота. Используется также при сопровождении сделок для установки тейк-профит/стоп-лосс и усреднений. Практически не имеет параметров и очень прост в использовании - просто укажите важный для вас момент истории и индикатор рассчитает ценовой канал. ОТОБРАЖАЕМЫЕ ЛИНИИ
ROTATE - толстая сплошная линия. Центр общего вращения цены. Цена делает широкие циклические движения вокруг линии ROTATE. Положение цены окол

Индикатор Envelopes M основан на популярном техническом индикаторе Envelopes, применяемом для создания гибких каналов, внутри которых цены пребывают большую часть времени. Границами этих коридоров являются две скользящие средние. Но заявка на то, что цена в канале находится большую часть времени, не является до конца корректной, поскольку часто происходит пробой канала и цена вывалится далеко за пределы канала. Главное отличие данного индикатора состоит в том что при каждом новом пробитие канал

Trend TD – индикатор трендовый. Благодаря алгоритму данного индикатора, сигнал никогда не будет идти против тренда. Благодаря двум линиям формирующих узкий канал алгоритм анализа точек входа, алгоритм контролирует моменты разворота в тот момент когда верхняя линия канала развернулась и можно визуально нарисовать линию пересекающую верхнюю линию с самой собой в прошлом, при этом пересечив в одной точке нижнюю линию. Если данное правило будет зафиксировано, тогда будет четко указан сигнал на граф

Средний дневной диапазон (ADR) - это индикатор, который показывает, как далеко валютная пара может продвинуться за день. Автоматически отображает верхний и нижний уровни ADR. Автоматически рассчитывает процент и расстояние ADR, достигнутый валютной парой за день. Меняет цвет и толщину линии ADR, при достижении его ценой. Расчет производится за 14 дней. Отображается на таймфреймах от М1 до М30.
The Indicator assists in decision making along with the user's market reading. By drawing the trend, this indicator becomes very useful on days of high volatility in the market, that is, it offers strategic insights on days of economic data, news or pronouncements. On flat market days it becomes usual to identify possible market reversals. Follow Youtube to understand the most suitable scenarios for its use.
FREE

Session Killzone Indicator
Indicator that helps you to identify the killzone times of both London and NewYork sessions which usually is the most times for high volatility and taking liquidity from the market. Killzone times are configurable through indicator parameters. The indicator adjusts the range of the killzones based on the daily trading range.
FREE
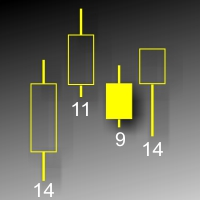
Данный индикатор показывает объем каждого бара (видимый диапазон) в пунктах. Гибкие настройки отображения значений. Возможна настройка параметров показа. Индикатор создавался для личного пользования, анализа графиков. Параметры: Color - цвет текстовых меток; Position - позиция метки: 0 - снизу, 1 - сверху; FontSize - размер шрифта; Angle - угол наклона текста; GapPoints - отступ по вертикальной оси.
FREE

The KT Trend Angle helps to identify ranging and trending markets. The idea is to only enter a trade following the market trend if the slope is steep enough.
An angle is the ratio of the number of bars to the number of points: The bars mean the time offered by standard (M1, M5, etc.) and non-standard time frames. Points represent the unit of price measurement with an accuracy of 4 or 5 decimal places.
Input Parameters Period: An integer value to define the intensity of angled trendlines. Angl
A very good indicator for experienced and professional traders . A practical approach to trading. Easy to understand. A helping tool for traders looking for price movements .
Signals: Signal Number 1: When yellow line which is a signal line crossing the zero line towards downward direction is a selling opportunity. Signal Number 2:
When yellow line which is a signal line crossing the zero line towards upward direction is a buying opportunity.

KT Forex Blau Balance combines elements of momentum and volatility. It helps you identify entry and exit points.
Blau Balance consists of two moving averages (a slow-moving average and a fast-moving average) intersecting key transition points in market price. The indicator turns green or red when one is above or below the other, signaling to buy or sell trade signals.
It can be used in currency pairs and other markets that your MT4 or MT5 platform supports. Both short-term and long-term trade

The KT De Munyuk is a trend-based indicator that uses Parabolic SAR to identify the market direction. The indicator shows the PSAR in the form of green/red dots using a separate window. Buy Signal: When a green dot appears after a series of at least three red dots. Buy Exit: When a red dot appears on the current or next higher time frame. Sell Signal: When a red dot appears after a series of at least three green dots. Sell Exit: When a green dot appears on the current or next higher

KT Forex Trend Rider uses a trend following algorithm developed specifically for the Forex market to provide reliable buy & sell signals across the major currency pairs. It works best on major FX pairs and all time-frames.
Features
It comes with a Multi-Timeframe scanner that can search for upcoming signals across all the time-frames. It comes with four preset profiles to facilitate trading for scalpers, tick-trend, swing, and trend traders. It marks the potential reversal points in the market.

The BSI stands for Bar Strength Index. It evaluates price data using a unique calculation. It displays readings in a separate window. Many financial investors mistake this indicator for the Relative Strength Index (RSI), which is incorrect because the BSI can provide an advantage through its calculation method that the RSI indicator does not. The Bar Strength Index (BSI) is derived from the Internal Bar Strength (IBS), which has been successfully applied to many financial assets such as commodit

The KT Tether Line is a trend-following tool consisting of three indicators that work together to generate trading signals. It can correctly identify market trends while signaling trade entries. It was first introduced by Bryan Strain in the Stock & Commodities magazine in 2000 in "How to get with the trend and out at the end."
The Concept
When a market trend is confirmed, the most challenging part is determining the timing of the entries. This indicator alerts you to potential trend reversals

Um Inside Bar é um dos principais sinais de continuidade de uma tendência existente e as vezes reversão, pois nos mostra locais especiais de entrada, possibilitando uma boa taxa de Risco x Retorno. É simples visualizar um Inside Candle. Esse padrão é formado por apenas dois candles. O primeiro deve ser, preferencialmente grande, e o segundo deve estar integralmente contido dentro dos limites de máxima e mínima do primeiro.
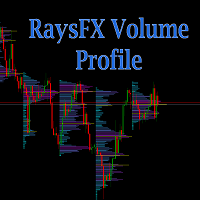
Calculation method The calculation method is summing the number of deals performed at a certain price. Alternatively, the volumes at a certain price can be summed if the real volume type is set in the parameters. The trade data is interpolated based on the most accurate terminal data available (М1 timeframe data). Each bar is divided into several trades based on the estimated price movement inside the bar. This is a distinguishing feature of the product setting it apart from other ones that hav

Ichimoku Aiko MTF is a collection of technical indicators that show support and resistance levels, as well as momentum and trend direction. It is a multi-timeframe indicator so you don't need to change the chart timeframe when you want to see the ichimoku clouds on a higher timeframe. eg. The chart timeframe is M15 and you want to see on the M15 timeframe chart the H1 ichimoku indicators (the ichimoku in Metatrader can't do that) that's why you need to use Ichimoku Aiko MTF.

Об индикаторе: DALA Forecast - универсальный инструмент предсказания динамики временных рядов любой природы. Для предсказания используется модифицированные методы анализа нелинейной динамики, на основе которых строится предсказательная модель с применением методов машинного обучения. Для получения ознакомительной версии индикатора вы можете связаться со мной в личных сообщениях.
Как пользоваться индикатором: Примените индикатор к выбранному вами финансовому интрументу или индикатору с нужными
FREE

Профессиональный инструмент для торговли - индикатор дивергенции между RSI и ценой, позволяющий своевременно получать сигнал о развороте тренда или ловить движения откатов цены (в зависимости от настроек). Настройки индикатора позволяют регулировать силу дивергенции за счет угла наклона пиков RSI и процентного изменения цены, что даёт возможность тонко настроить силу сигнала. Код индикатора оптимизирован и в составе советника очень быстро тестируется. Индикатор не перерисовывает, стрелки для н
FREE

Индикатор работает с объектами "Трендовая линия", "Прямоугольник", "Текст" и позволяет их создавать и копировать с одного графика на другой. Является более удобной альтернативой автоматическим копировщикам, т.к. позволяет более гибко выбирать что и куда должно быть скопировано. Горячие клавиши: '1,2,3,4,5,6' - создание тонких горизонтальных линий (цвет задается в настройках), тоже самое с SHIFT - толстая линия ' ~ ' - создание линии со случайным цветом ))) '7,8,9' - создание закрашенных прямо

Профессиональный инструмент для торговли - индикатор дивергенции между AO и ценой, позволяющий своевременно получать сигнал о развороте тренда или ловить движения откатов цены (в зависимости от настроек). Настройки индикатора позволяют регулировать силу дивергенции за счет угла наклона пиков AO и процентного изменения цены, что даёт возможность тонко настроить силу сигнала. Код индикатора оптимизирован и в составе советника очень быстро тестируется. Индикатор не перерисовывает, стрелки для на
FREE

Here’s the problem: the default zigzag indicator given in MT5 trading platform does not really capture the most of the highs and lows on chart do draw zigzags. On chart below, notice that some of ther high, low of price have been missed to draw zigzags by this default zigzag indicator (picture 1). It is not so apparent until you compare default zigzag indicator to this SwingZZ indicator. Have a look on picture 2 and 3. The swing zigzag indicator is best because it captures most of the swing high
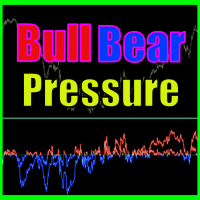
Bull bear pressure indicator - is the manual system which defines bull/bear market. When lines is above zero level - market is strong bullish, and when lines below zero level - market is bearish. First line represents global trend and second one are smoothed and shows local market's mood. Main inputs are : MainPeriod- main indicator's period for global trend calculation; SignalPeriod - period for smoothed and shows local market's trend; Main Indicator's Features Signals are not repaint,non-late
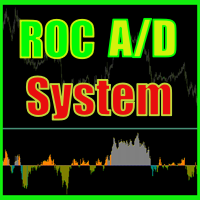
ROC acceleration-deceleration is the manual system for medium-term scalping. Indicator based on custom ROC system which defines bullish/bearish market and especially acceleration-deceleration of tendention in the market's main direction. Buy arrow is plotted during bearish market when current trend decelerates and sell arrow is plotted during bullish market when current trend decelerates. Main Indicator's Features Signals are not repaint,non-late or disappear(exept cases when system recalculat

ASI fractals with DPO filter - is the manual trend-following system. ASI fractals are the base of every trend. System plots an arrow when fractal pattern appears on ASI indcator and DPO direction is same as incomming signal. System has several ways of usage : simply indicator, indicator with suggested arrows, arrows with single targets and arrows with common profit targets. User can simply switch indicator's modes directly from chart. Main Indicator's Features Signals are not repaint,non-late or
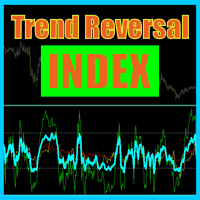
Trend reversal index - is the manual trading system that works with overbought , oversold levels and reversal patterns. Sell arrow is plotted when indicator is higher than overbought level and here forms reversal pattern, all pattern points located higher than overbought level. Opposite with buy arrow : ndicator is lower than oversold level and here forms reversal pattern, all pattern points located lower than overbought level. Main Indicator's Features Signals are not repaint, late or disapp

Theoretical Foundation The Keltner Channels are channels ploted using volatility deviations above and bellow a moving average. The indicator is an excellent tool to help the trader build trend and mean-reversion strategies. Parameters The Orion Dynamic Keltner allows the user to select the Volatility Calculation Type, being ATR or Average Range (not considering price gaps). Also, the user can select the Calculation Period, Number of Deviations, Moving Average Mode and the Moving Average Ca

Theoretical Foundation Similar to the well-known Average True Range (ATR), the Average Range indicator is a volatility measure that is calculated using only the range of the bars (high – low), not considering the Gaps, as with the ATR. The Average Range can be very useful for day traders as it allows one to get the measure of the volatility of the last N bars. Parameters You can select the calculation period of the indicator.

Demarker pullback system - is the manual trading system for choppy markets. It show 2 colored histogram. When histogram is blue - market is quite bullish, when histogram ir orange - market is more bearish. Up arrow is plotted when histogram is in oversold zone but blue color. Down arrow is plotted when histogram is in overbought zone but orange color. These patterns shows false breakout and possible soon reverse(price is overbought but shows bearish signs and price is oversold but shows bullis

Early WPR divergence - is the manual system to define trend reverse. Green histogram shows main trend, Orange one - shows "short"/local trend. System is looking for clear divergence between both trends and pick up position(plot buy/sell arrows). When main trend is up, but local trend reverses to bearish trend and get's big power - sell arrow is plotted; When main trend is down, but local trend reverses to bullish trend and get's big power - buy arrow is plotted; Main inputs are : mediumTrendPe

Normal Parabolic SAR with label of long or short state. Tells also "Parabolic long" and "short". Can be used in multitimeframe layouts together with Swiss HolyGrail indicator or in different timeframes. So, if all the indicators show "long" or "short" you can be sure that the risk of a wrong direction is small. The standard values for Parabolic SAR are 0.02 for step and 0.2 for maximum. You may experiment with changing the maximum to get smother curves. Note that changes in parabolic SAR are la
FREE
Индикатор отображает изменение баланса В правом нижнем углу окна.
Отображаются следующие периоды Сегодня Вчера 3 дня Неделя 10 дней Месяц 3 месяца Полгода Год Все время Есть возможность выставить расчетное время. Удобно пользоваться для расчетов прибыли/убытков с определенного часа.
Будет полезен например ночным скальперам. Данные совпадают с расчетами отчета в терминалее.
FREE

Анализатор волатильности — это индикатор импульса, который извлекает выгоду из тенденции к сильному прорыву цены после консолидации в узком торговом диапазоне. Индикатор также использует осциллятор импульса, чтобы показать ожидаемое направление движения, когда происходит сжатие. Эта гистограмма колеблется вокруг нулевой линии, увеличение импульса выше нулевой линии указывает на возможность покупки длинной позиции, а падение импульса ниже нулевой линии может указывать на возможность продажи.
П

DESCRIÇÃO O indicador EasyFollowerTrader-Bot2-DayTrade opera apenas a favor da tendência. Assim, o indicador, em primeiro momento, observar a tendência de três médias síncrona com o time-frame selecionado. Em seguida, o indicador observar a tendência do gráfico diário. Quando estes dois gráficos estiverem se movimentando na mesma direção, teremos a maior probabilidade de ganhos. Chamaremos esta região como região de alta probabilidade de ganho. Na região de alta probabilidade de ganho, o ind

Индикатор Roll the Field отображает сигналы в простой и доступной форме в лтний двух цветов (когда покупать и когда продавать определяется при перемене цвета). Знание о точке входа каждой из валют очень важно для каждого трейдера, торгующего на рынке форекс. Интеллектуальный алгоритм индикатора с точностью определяет тренд, отфильтровывает рыночный шум и генерирует входные сигналы.

Point discussion - это фундаментальный технический индикатор - алгоритм, который позволяет получать данные о будущих ценах с помощью данных о котировках за определенный промежуток времени заданный в настройках индикатора. В основе индикатора технического анализа Point discussion лежит специальная формула. Именно с ее помощью и происходит расчет. Индикатор хорошо подходит для определения разворота или большого резкого рывка в одну из сторон благодаря ему вы будете знать когда такое произойдет он

фундаментальный технический индикатор Informative Trend,который позволяет дать оценку текущей рыночной ситуации,чтобы в войти в рынок выбранной валютной пары в тренд и с минимальным риском. Использует в своей основе процесс выявления скорости изменения роста цены и позволяет найти точки входа и выхода с рынка.
Индикатор создан на основе оригинальных индикаторов поиска экстремумов и хорошо подходит для определения разворота или большого резкого рывка в одну из сторон благодаря ему вы будете зна

Одним из главных определений для мониторинга рынка валют является тренд именно по этому создан индикатор Megan, для того чтобы отображать тренд в наглядном виде. Форекс индикатор Megan – настоящая торговая стратегия, с помощью которой можно добиться нужных результатов. Как только индикатор будет установлен, сразу начнется пересчитываться основные показатели по цене торгуемой пары, опираясь на постулаты технического анализа. Помимо этого в терминал, при обнаружении потенциальных точек входа, пока

Всё просто. Обычный Информационный индикатор. Показывает на графике: Текущий спред, своп на покупку, своп на продажу, время до закрытия свечи, время брокера. Индикатор можно расположить справа вверху или справа внизу графика. Чаще всего спредом называют разницу между ценой продажи и покупки. Своп - это стоимость переноса позиции на следующие сутки.

The movement exhaustion is a color rule that helps indicate when the movement will revert its direction. The darker the color, the greater the probability to revert. The indicator is based on the price statistic. Works on every timeframe, every instrument. Five color options: 0. Natural movement. (Gray) 1 - 4. Movement exhaustion (Yellow to maroon) The trader can use it as reversal or exhaustion signal. In a trend following trade it can be used as an exhaustion signal, indicating the movement ca
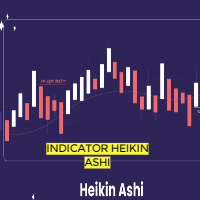
In this indicator, Heiken Ashi candles are calculated with the most optimal method. You can also customize the results by adjusting the amount of period and method input. But the most important advantage of this indicator is the adjustment of the time frame value. You can use this to calculate the Heiken Ashi chandels to See in time frames with lottery in the lower time chart. In this case, you get the best signal to buy or sell using two or more Heiken Ashi indicators with different timeframes
FREE

Precision Trading with the Inside Bar Pro Indicator for MT5 The Inside Bar Pro indicator by @Billyenaire is a powerful tool designed for traders who rely on clean, price-action-based setups. It automatically detects inside bar formations—candlestick patterns where the current candle is completely contained within the high and low of the previous candle. Key Features: Automatically identifies inside bars in real-time Highlights inside bars directly on the chart using customizable candle colors W
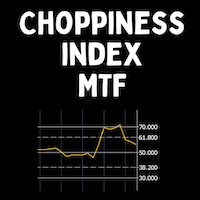
The Choppiness Index was created by Australian commodity trader E.W. Dreiss. It is designed to determine if the market is choppy (trading sideways) or not choppy (trading within a trend in either direction). A basic understanding of the indicator would be; higher values equal more choppiness, while lower values indicate directional trending. The values operate between 0 and 100. The closer the value is to 100, the higher the choppiness (sideways movement) levels. The closer the value is to 0,
MetaTrader Маркет позволяет максимально безопасно покупать программы для платформы MetaTrader. Вы можете скачать демо-версии понравившихся роботов и индикаторов прямо из терминала и проверить их в тестере стратегий.
Протестируйте программы в различных режимах перед покупкой для получения максимального представления о продукте и оплатите понравившийся продукт через платежную систему MQL5.community.
Платежная система MQL5.community обеспечивает оплату продавцам, а возможность тестирования программ в различных режимах позволяет покупателям получить максимальное представление о продукте.

Вы упускаете торговые возможности:
- Бесплатные приложения для трейдинга
- 8 000+ сигналов для копирования
- Экономические новости для анализа финансовых рынков
Регистрация
Вход
Вы принимаете политику сайта и условия использования
Если у вас нет учетной записи, зарегистрируйтесь