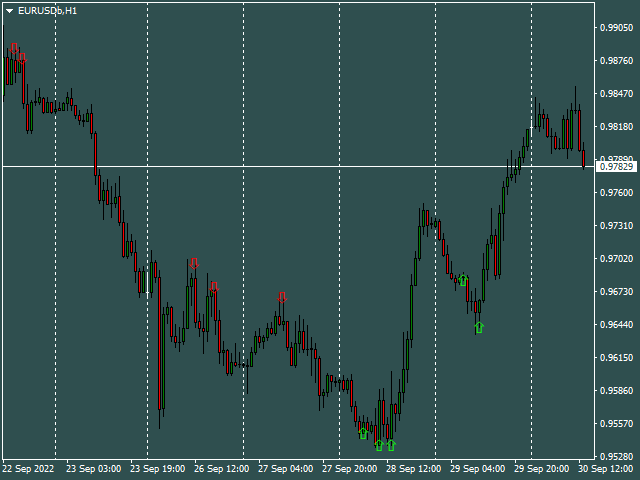
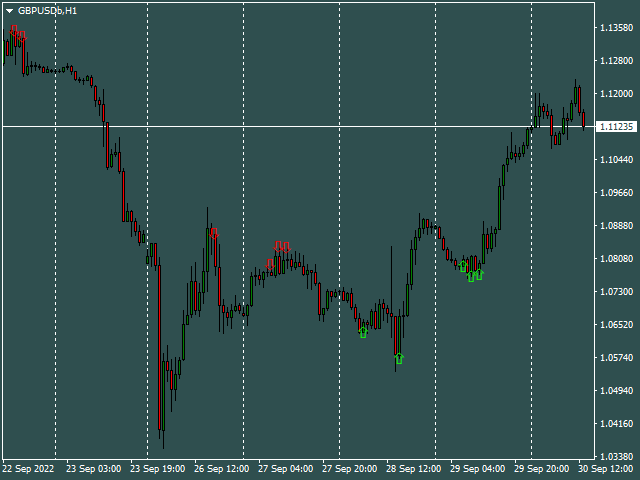
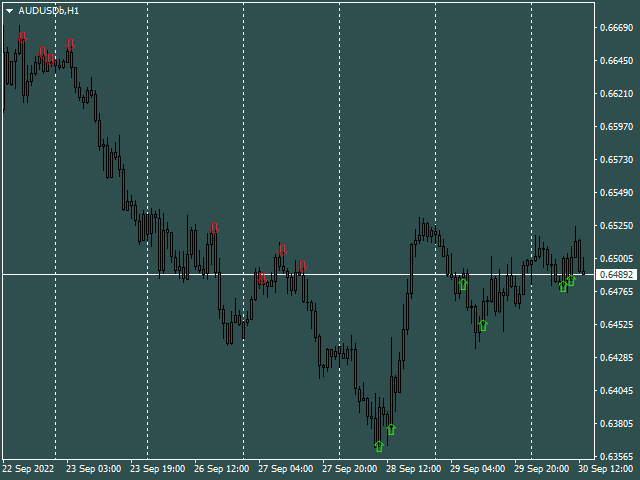
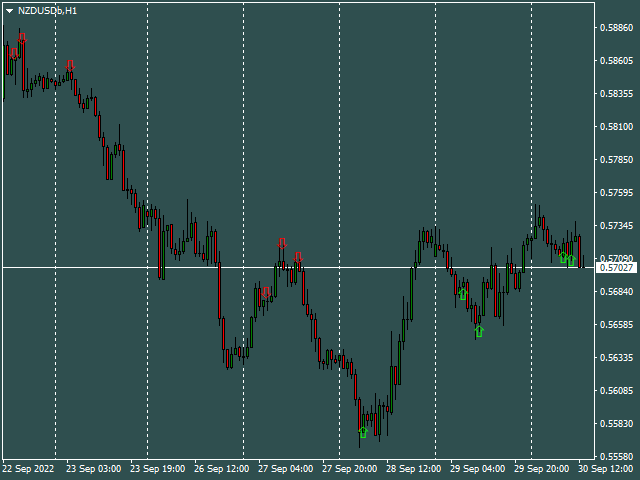
This indicator is designed for those people, who want to trade and earn on any instruments and timeframes .The indicator gives out very good points to enter the market,it's very easy to trade,the arrows will show when to open trades,set and trade without thinking about anything,stop loss and take profit,set each one yourself,it all depends on your trading style,someone scalps and someone holds trades on a few days..In the strategy tester, the indicator simply cannot physically show accurate results, due to a very complex algorithm, which strategy tester simply cannot physically calculate.H1 is the best timeframe.European trading session and the beginning of the American session.
This is Gekko's Bollinger Bands indicator. It extends the use of the famous Bollinger Bands and calculates strong entry and exit signals using price action on the edge and on the middle bands. You can set it up in many different ways, eg: pullback, pullback against trend, middle band crossing and middle band crossing against trend. Inputs Number of Bars to Plot Indicator: number of historical bars to plot the indicator, keep it low for better performance; Produces Signal Only When a Bar Closes:
FiveStarFX Gold Reversal Edge Professional automated trading solution designed for structured execution and controlled risk management in the Gold market. Built for traders who value discipline, precision, and consistency. Key Features Fully automated trading
One trade at a time (controlled exposure)
Fixed Stop Loss and Take Profit
Smart Break-Even protection
Profit lock with buffer
Step-based trailing management
Spread protection system
Works on any broker Trade Management The E
The Outside The Box (OTB) is a complete trading system that provides the user with immense trading ability by highlighting on the chart areas where the trader should prepare to Re-enter the trend after pullbacks (Pullback trading strategy) Take partial/complete profit(Profit taking strategy), and Trade breakouts (Stock breakout strategy) - We have updated the indicator to show/hide Micro breakout areas around the major breakouts (Micro Breakouts). The above is supported by an alert system to no
This indicator builds upon the previously posted Nadaraya-Watson smoothers. Here we have created an envelope indicator based on Kernel Smoothing with integrated alerts from crosses between the price and envelope extremities. Unlike the Nadaraya-Watson estimator, this indicator follows a contrarian methodology.
Please note that by default this indicator can be subject to repainting. Users can use a non-repainting smoothing method available from the settings. The triangle labels are designed so
Multiple Timeframe MACD indicator. This indicator was built for making multiple timeframe analysis possible in MT5 using MACD Indicator. MACD Indicator traditionally shows two lines and one histogram. MACD Line(Yellow) is calculated by subtracting 12period EMA(fast) from 26period EMA (slow). Signal Line(Blue) is created by a 9period EMA from MACD Line. Histogram is just the difference between MACD and Signal lines. Histogram is colored based on the difference between its value and the previous h
MTFC (Multi Timeframe Chart) – See 2 Timeframes on ONE Chart!
"Trade Smarter, Not Harder – Eliminate Timeframe Switching Forever!" Imagine having the power to see any higher timeframe (M5, M15, H1, H4, D1, MN1, etc.) directly on your current chart. No more flipping between charts, no more guesswork—just pure trading clarity in one place. That’s exactly what the MTFC Indicator delivers! 1. The Problem It Solves As traders, we know context is king . But constantly switching between c
# Multi-Timeframe Trend Sync Pro (MTTS Pro)
## Synchronize Multiple Timeframes and Trade with Trend Confluence
**MTTS Pro** is an advanced technical indicator developed for traders seeking precision in multi-timeframe analysis. By consolidating information from multiple timeframes simultaneously, the indicator identifies points of high confluence where multiple timeframes confirm the same market direction.
---
## MAIN FEATURES
### **Simultaneous Multi-Timeframe Analysis** - Monitor up t
MACDO is a professional indicator based on the MACD algorithm, designed to display market momentum and trend direction in a clear and easy-to-understand visual way.
This is a limited-time trial version provided for evaluation and performance testing purposes. The indicator gives you a clearer view of market momentum and turning points, helping you improve the accuracy of your analysis and the timing of your trade entries. It is based on a colored histogram that reflects the strength of price mo
The indicator is designed to close positions on the market in time. For example: to take profits ahead of schedule if the price has not reached TakeProfit, and the market is turning around. The indicator analyzes the momentum, not the trend. He does not give any information about the trend. The indicator is well suited for finding divergence. The Ershov 38 Parrots indicator dynamically adjusts to the market and detects price movement impulses of medium and high amplitude. It almost does not rea
ENGLISH VERSION PRICE VARIATION LINE – TAKE CONTROL OF THE MARKET!
Turn the opening price into your strategic weapon
Clearly see how many points or % the market moved
Auto horizontal lines at the levels YOU define
Mark entry, exit, target zones and explosive regions
Clean, sharp, and professional layout
Simple, powerful, and essential for any serious trader
Cybertrade Auto Fibonacci retraction and projection - MT5
Auto Fibonacci is an indicator that automatically plots the Fibonacci retracement and projection based on the number of bars you select in the indicator setting. You can customize nine different levels of retraction and three levels of projection. It works on periods longer than the period visible on the chart. All values are available in the form of buffers to simplify possible automations. This indicator is the same one we use in ou
The Risk Trend indicator simplifies the decision-making process by recognizing reversals using a built-in algorithm and then confirming signals at support/resistance levels. Implements a type of technical analysis based on the idea that the market is cyclical in nature.
Thus, the indicator tracks the market trend with great reliability, ignoring sharp market fluctuations and noise around the average price. The indicator can be used both for pips on small periods and for long-term trading.
RiskGuard PRO – Defesa Inteligente para Traders Sérios no EURJPY M15 O RiskGuard PRO é um Expert Advisor de alto desempenho, projetado exclusivamente para o par EURJPY no timeframe M15 , com foco total em preservação de capital, gestão de risco avançada e execução estratégica de múltiplas abordagens operacionais . Ao contrário dos EAs tradicionais, o RiskGuard PRO foi desenvolvido com tecnologia proprietária e arquitetura inteligente , capaz de operar com segurança mesmo em ambientes de merc
Manyal trading system, CovEchoTrend Robot, focuses on reliability and flexibility. By employing statistical analysis methods to study the relationships between the base indicator and market patterns, the system enables a deeper understanding of market processes. Intelligent pattern analysis: The application of statistical data processing helps identify key trend reversal points more accurately, signaling significant market shifts. Informed decision-making is based on the intersection of indicato
Limitless MT5 is a universal indicator suitable for every beginner and experienced trader.
works on all currency pairs, cryptocurrencies, raw stocks
Limitless MT5 - already configured and does not require additional configuration
And now the main thing
Why Limitless MT5?
1 complete lack of redrawing
2 two years of testing by the best specialists in trading
3 the accuracy of correct signals exceeds 80%
4 performed well in trading during news releases
Trading rules
1 buy signal - the ap
Dynamic Trend Visualizer: Momentum and Direction Indicator The Dynamic Trend Visualizer is an advanced flow analysis tool designed to translate the complexity of price movements into a clear and objective visual map. Through an internal trend-tracking algorithm, the indicator continuously scans price action and identifies who is in control of the market — bulls, bears, or indecision. Instead of cluttering your chart with lines and oscillators, it directly colors the candles in real-time, allowin
Strength Radar 02 – Take Your Trading to the Next Level!
Hello, trader! If you're looking for a tool to level up your game in forex, Strength Radar 02 is exactly what you need! Developed with passion and expertise, this indicator turns currency strength analysis into something simple and powerful. With it, you'll have a clear view of the real-time performance of AUD, CAD, CHF, EUR, GBP, NZD, JPY, and USD , using indicators like MA, MACD, RSI , and more — all fully customizable your way!
Ima
The Martinware Manual Trading Helper indicator is aimed at helping people start their lives in manual trading. It can be used to display both some generic images at the right side of the graph, where custom operational remarks may be displayed or just a blank rectangle hiding the chart while backtesting. Moreover, it can periodically play a list of sounds. To show a blank rectangle, let the first image name input field empty and select the desired color. To show one or more custom images inste
Volume Profile Indicator used by professional Traders at Traders Inside Ltd. If you want to succeed in trading you need to know if current price is cheap, expensive or fair valued. Key features: Fair price (Point of control, POC), high and low price zones (POH, POL) POC in different timeframes for better orientation Symbol and timeframe Chart resize on open positions/orders, VPRmax/min Historic POC - see, how POC has changed the last periods Button to show/hide VPR
Calculated Bars (best results)
The Rocket Trend indicator is trending. The indicator draws two-color points connected by lines along the chart. This is a trend indicator, it is an algorithmic indicator. It is easy to work and understand when a blue circle appears, you need to buy, when a red one appears, sell. The indicator is used for scalping and pipsing, and has proven itself well. Rocket Trend is available for analyzing the direction of the trend for a specific period of time. Ideal for novice traders learning the laws o
A lot of professional traders use high quality divergence signals as a part of their strategy to enter a position. Spotting correct divergences quickly can often be hard, especially if your eye isn’t trained for it yet. For this reason we’ve created a series of easy to use professional oscillator divergence indicators that are very customisable so you get only the signals you want to trade. We have this divergence indicator for RSI, MACD, Stochastics, CCI and OBV. RSI: https://www.mql5.com/en/
HiLo Activator v1.02 by xCalper The HiLo Activator is similar to moving average of previous highs and lows. It is a trend-following indicator used to display market’s direction of movement. The indicator is responsible for entry signals and also helps determine stop-loss levels. The HiLo Activator was first introduced by Robert Krausz in the Feb. 1998 issue of Stocks & Commodities Magazine.
HV Models is an Indicator that containes 4 methods for calculating historical volatility of the selected asset. Volatility is one of the fundamental values describing changes in the underlying asset. In statistics, it usualy describes as a standard deviation. The price chart has 4 values (Open High Low Close) when we calculate volatility using a standard indicator, only one of these values is used as a result we get one-sided volatility picture. The presented indicator uses 4 volatility ca
Based on the Dow Theory, the system automatically draws a turning point, which is the starting point for buying or selling. It also automatically tells you whether the market is in a buying or selling condition and recognizes the environment. It is also a good tool to prevent false trades and to make profitable trades.
We are live-streaming the actual operation of the system. Please check for yourself if it is usable. Please check it out for yourself. https://www.youtube.com/@ganesha_forex
We
This indicator has a unique support and resistance calculation program, which is a unique trading system. Index characteristics Imagine if you can accurately determine the important trading support and resistance areas and points in advance, how will your trading improve? Based on a unique calculation method, the indicator analyzes the trend, analyzes the current support and resistance, and obtains the current important support resistance and single direction, the calculated stop profit and sto
Counts the lifetime of Candle Extra until its closing.
It is used to assist in the entry of operations... ...We operate at the close of one-minute Candles, that is, when the timer is at 00:xx:01. We open an order, and the value of that operation is also displayed by the tool.
Extra: To 'unlock' the price scale. Double click on the scale and the graph will be 'horizontally centered'. In addition to allowing the expansion and contraction of the price scale, we can navigate the chart by draggin
Purpose DG Trend+Signs is an indicator that paints candles with trend colors and clearly shows consolidations, using both DoGMA Trend and DoGMA Channel indicators. It was created to help users in their trades, showing trends, consolidations and marking entry and exit points. The indicator also takes consolidations in consideration to identify breakouts.
Key features Designed to be simple to use, with a few parameters Does NOT repaint Does NOT recalculate Signals on entries Works in ALL pairs Wo
Trend Hunter is based on the process of detecting the rate of change in price growth and allows you to find points of entry and exit from the market.
The indicator was created on the basis of the original indicators of the search for extremes, the indicator is well suited for detecting a reversal or a large sharp jerk to one side, thanks to it you will know when this will happen, it will notify you by the appearance of a blue point for buying red for selling
A fundamental technical indicat
Neuro Poseidon is a new indicator by Daria Rezueva. It combines precise trading signals with adaptive TP/SL levels - creating best possible trades as a result!
Message me and get Neuro Poseidon Assistant as a gift to automize your trading process!
What makes it stand out?
1. Proven profitability on all assets and timeframes
2. Only confirmed BUY and SELL signals present on the chart
3. Adaptive TP & SL levels generated by the software for each trade
4. Easy to understand - suitable for al
Entry In The Zone and SMC Multi Timeframe is a real-time 2-in-1 market analysis tool that combines market structure analysis and a No Repaint BUY / SELL signal system into a single indicator, built on Smart Money Concepts (SMC) — a widely adopted framework used by professional traders to understand market structure. This indicator helps you see the market more clearly, make decisions based on structure rather than guesswork, and focus on high-probability zones where price is more likely to react
The Oracle Pro:MT5向け合成マルチタイムフレーム・バイアスエンジン ️ サマー・ローンチ・オファー — The Oracle Pro を 199 USD で(早期購入者向け)。価格は普及に応じて上昇します。最終価格 399 USD。 The Oracle Pro は、要求の高いプロのトレーダーのために作られた MetaTrader 5 向けのプレミアム・マルチタイムフレーム バイアスエンジン です。ひとつの問いに規律をもって答えます。すなわち、各タイムフレームの現在の方向バイアスは何か、その強さはどれほどか、そしてタイムフレーム同士はどれだけ一致しているか。すべては確定足のみで計算され、リペイントはありません。 The Oracle Pro はマルチファクター・コンセンサス・システムです。独自のインジケーターと最適化されたアルゴリズムを単一の高度なコンセンサス・ベクトルに統合し、それを単一のインジケーター・インスタンス内で現在足と上位足のスタックにわたって読み取ります。複数のチャートにばらばらのツールを積み重ねる代わりに、です。 これは Oracle コンセンサス手法
Crystal Heikin Ashi Signals - Professional Trend & Signal Detection Indicator Advanced Heikin Ashi Visualization with Intelligent Signal System for Manual & Automated Trading
Final Price: $149 ---------> Price goes up $10 after every 10 sales .
Limited slots available — act fast .
Overview Crystal Heikin Ashi Signals is a professional-grade MetaTrader 5 indicator that combines pure Heikin Ashi candle visualization with an advanced momentum-shift detection system. Designed for both manual traders
ARIPoint is a powerful trading companion designed to generate high-probability entry signals with dynamic TP/SL/DP levels based on volatility. Built-in performance tracking shows win/loss stats, PP1/PP2 hits, and success rates all updated live. Key Features: Buy/Sell signals with adaptive volatility bands Real-time TP/SL/DP levels based on ATR Built-in MA Filter with optional ATR/StdDev volatility Performance stats panel (Success, Profit/Loss, PP1/PP2) Alerts via popup, sound, push, or email Cu
FX Power: 通貨の強弱を分析して、より賢い取引を実現 概要
FX Power は主要通貨と金の実際の強弱をあらゆる市場状況で理解するための必須ツールです。強い通貨を買い、弱い通貨を売ることで、 FX Power は取引の意思決定を簡素化し、高い確率の取引機会を見出します。トレンドを追従する場合でも、極端なデルタ値を使用して反転を予測する場合でも、このツールはあなたの取引スタイルに完全に適応します。ただ取引するだけではなく、 FX Power で賢く取引をしましょう。
1. なぜ FX Power がトレーダーにとって非常に有益なのか 通貨と金のリアルタイム強弱分析
• FX Power は主要通貨と金の相対的な強弱を計算し、マーケットダイナミクスに関する明確な洞察を提供します。
• どの資産がリードしているか、または後れを取っているかを監視して、取引するペアを賢く選びましょう。 マルチタイムフレームの包括的なビュー
• 短期、中期、長期のタイムフレームで通貨と金の強弱を追跡し、マーケットトレンドに基づいて取引戦略を調整できます。
• スキャルピングからスイングトレード
Prop Firm Sniper MT5 is a professional market structure indicator that automatically identifies high-probability BUY and SELL opportunities using BOS and CHoCH analysis.
Recommended Timeframes: For backtesting, use the indicator on M5 or M15 for Gold (XAUUSD), and M15 or H1 for more volatile Forex pairs such as GBPUSD, USDJPY, EURGBP , and similar markets.
CONTACT ME AFTER PURCHASE TO CLAIM YOUR FREE BONUSES!
Prop Firm Sniper is a professional market structure indicator designed to
MT5 Indicator
See What the Market Is Really Doing, See the 3 Market Phases Live in front of you (Contraction, Expansion, Trend Phases) and have Better Entries at the Early Stage in the Trend Phase.
Stop guessing . Start reading the market like the institutions, Smart Money do.
Apex Market Structure Pro Indicator for MT5 is a precision smart-money analysis tool that strips away the noise and shows you the true structure beneath every candle, liquidity, structure shifts, accumulat
This indicator is designed for those people, who want to trade and earn on any instruments and timeframes .The indicator gives out very good points to enter the market,it's very easy to trade,the arrows will show when to open trades,set and trade without thinking about anything,stop loss and take profit,set each one yourself,it all depends on your trading style,someone scalps and someone holds trades on a few days..In the strategy tester, the indicator simply cannot physically show accurate res