 MetaTrader 5
 Experts
 Indicateurs
 Bibliothèque
 Utilitaires
 Widgets
 Règles
Regardez les tutoriels vidéo de Market sur YouTube
Comment acheter un robot de trading ou un indicateur
Exécutez votre EA sur
hébergement virtuel
hébergement virtuel
Test un indicateur/robot de trading avant d'acheter
Vous voulez gagner de l'argent sur Market ?
Comment présenter un produit pour qu'il se vende bien
Nouveaux indicateurs techniques pour MetaTrader 5 - 176
 Les signaux provenant des indicateurs techniques jouent un rôle crucial dans l'ouverture et la clôture des transactions sur les marchés boursiers et les marchés forex. L'essence des indicateurs est une transformation mathématique du prix d'un symbole financier visant à prévoir les changements de prix futurs. Testez les indicateurs techniques pour mieux prédire le comportement du marché et en tirer profit.
!! FLASH SALE !! Over 80% off !! For ONE week only. Now only $47 - normally $297! >>> Ends on 30 June 2023 - Don't miss it!
Buy and Sell Arrows when price breaks away from mean price. Sends Alerts – On MT5 To Your Phone To Your Email
Does not repaint .
Works on any Forex pair, any timeframe.
10 Activations allowed so you are free from limitations >> MT4 Version Here For spreads from a tiny 0.1 pips RAW/ECN Accounts, click here . Check out my Waka Esque EA signal here: >> High
Key Price Levels Indicator Indicator that shows the highs and lows for the significant price levels for past periods that could be potentially considered as reaction levels. The indicator displays the following price levels: Yesterday high and low The day before yesterday high and low Two days back high and low Last week high and low Last month high and low Last three month high and low (Quarter) Last year high and low
FREE
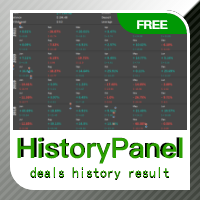
A free deals history results panel. Its working principle is to calculate the monthly income by consulting historical trading records and display it in a tabular format. At the same time, it also statistics all the trading results of the current account, enabling traders to adjust their trading strategies based on historical data. If you have further requirements, please contact the developer.
FREE
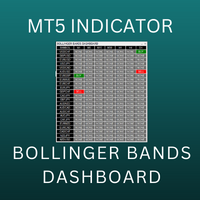
Bollinger Bands Multi Dashboard MT5 uses the value of Bollinger Bands indicator. This dashboard will monitor all symbols in the market watch. We can set up to receive an alert, notification or an email when the buy/sell signal appear on each timeframe. You can check all symbols via only 1 chart. This dashboard will check almost popular time frame (M1,M2,M3,M4,M5,M6,M10,M12,M15,M20,,M30,H1,H2,H3,H4,H6,H8,H12 and D1) in MT5. The colors can be customized. We can have a look at many pairs and many t
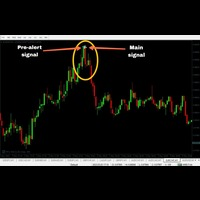
'Zoro PRO' is a reversal strategy based MT5 indicator with advance pre-alert system. Its an 100% non repaint indicator with an average accuracy of about 70-95% in any kind of market. (EXCEPT BAD MARKET AND NEWS TIME) MT4 version https://www.mql5.com/en/market/product/89772 PLEASE NOTE: MT4 version has more accuracy. Better avoid this MT5 version and go for the above link of MT4 version
Recommended Broker: Alpari, Amarkets, tickmill. Recommended pairs for M1
EURUSD
USDJPY
EURGBP
EURJ
Update 2.0: Added the option to change LWMA to the other 3 basic MA modes. I also added Smoothing to it, to tame it a bit. You can input 1 as smoothing period and no smoothing will be applied.
Update 2.1: Removed Trend Typical Open/Close as is was the same behavior as Trend Open/Close. Trend follow works by averaging the high/low with close/open. If Close is above Open, Trend Close = Close+High/2, averaging between close and high, and when Close drops below Open, it's calculation automatically s
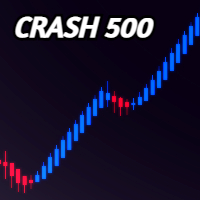
FOR CRASH 500 ONLY!! MT5
*This is a smooth heiken ashi setup meant to be used on CRASH 500 in combination with other indicators. *You are welcome to test it on other markets aswell. *I will be posting other indicators aswell to help with trading the crash 500 market. *You can use this to help smooth out price if you do struggle with reading the charts as is. * Just note heiken ashi doesnt represent real price action only smoothes it out for ease of read.
FREE
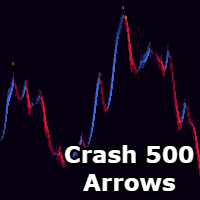
Sylvan Crash 500 Arrows!! MT5
*Only use this on Crash 500 Market. *Only for the 15M Chart. *Sells only. *This doesnt redraw or repaint but the candle needs to close for the arrow to print permanently, it does print on candle open. *It doesnt get you at the tip of highs but instead as soon as price slows down or drops from its overbought parameters. *Do not change input settings as this is already optimized.

L'indicateur trouve les niveaux de volume de prix maximum et minimum (profil de marché) sur l'histogramme de travail pour le nombre de barres spécifié. Profil composite. La hauteur de l'histogramme est entièrement automatique et s'adapte à n'importe quel outil et période. L'algorithme de l'auteur est utilisé et ne répète pas les analogues connus. La hauteur des deux histogrammes est approximativement égale à la hauteur moyenne de la bougie. Smart alert vous permet de vous informer sur le prix

L'indicateur de forex Gann High Low Activator Metatrader 5 a été expliqué dans le numéro de 1998 du magazine Stocks & Commodities par Robert Krausz.
L'indicateur technique représente une moyenne mobile simple (SMA) des plus bas ou des plus hauts des N périodes précédentes.
Les courbes des hauts et des bas sont correctement suivies à l'aide de l'indicateur Gann High Low Activator.
Néanmoins, la clôture de la barre est ce qui détermine lequel d'entre eux est tracé.
L'indicateur apparaît sur l
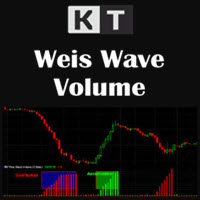
Lisez l'activité du marché vague par vague KT Weis Wave Volume transforme le volume de chaque barre en vagues de prix haussières et baissières alternées. Il cumule le volume sur toute la vague et présente le résultat dans un histogramme clair sous le graphique des prix, donnant à l'activité du marché une structure directionnelle précise. Les barres vertes se développent pendant une vague haussière et les barres rouges pendant une vague baissière. Les colonnes progressives facilitent la lecture d

L'indicateur Obie Scalper Alerts pour MT5 est un excellent outil de signaux rapides d'achat/vente pour les scalpers et les day traders.
Les signaux sont très faciles à comprendre et ils apparaissent dans la fenêtre principale du graphique sous forme de points bleus et rouges.
Signal d'achat et de vente : Un point bleu est un signal d'achat. Un point rouge est un signal de vente. N'hésitez pas à expérimenter les différents paramètres et valeurs d'entrée de l'indicateur.
L'indicateur fonctionn
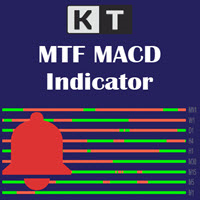
En tant que trader, surveiller plusieurs unités de temps simultanément vous permet de mieux comprendre la tendance générale et de savoir si ces unités de temps sont en accord ou en contradiction. Le KT Multiple Time Frame (MTF) MACD affiche la direction globale d’un instrument sur un seul graphique en montrant la convergence/divergence des moyennes mobiles (MACD) pour toutes les unités de temps. L’indicateur présente un tableau simple indiquant la tendance MACD associée à chaque unité de temps.
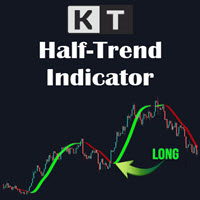
Suivez l'état de la tendance sur le graphique KT Half Trend trace une ligne colorée directement sur le prix et marque les changements d'état directionnel avec des flèches. La ligne donne une vue continue de l'état actif de la tendance, tandis que chaque flèche permet de repérer facilement une nouvelle transition sur le graphique. Ligne bleue : indique un état Half Trend haussier. Ligne rouge : indique un état Half Trend baissier. Flèche bleue vers le haut : marque le passage à l'état haussier. F
La barre Time End de MMD est un simple indicateur qui indique le nombre de secondes restantes dans les trois intervalles sélectionnés. Selon la méthodologie MMD, le moment où un mouvement de prix directionnel se produit est important. Cet indicateur vous permet d'utiliser cette relation plus efficacement dans le trading Forex et Futures.
Descriptif des fonctionnalités :
Time Frame 1 Period - définissant le premier intervalle de temps Time Frame 1 Color - spécifiant la couleur pour le premier
FREE

This indicator is developed based on the multiple session trading to aid in analysis for all the day traders. The indicator supports all currency pairs as well as other trading instruments like indicies, commodities, metals ,etc. The way the indicator work is by making analysis on your behalf. During asian session that's when the indicator does the calculations and provided trading plans in form of areas on the chart for the current day. And this process happens everyday which allows for hands f
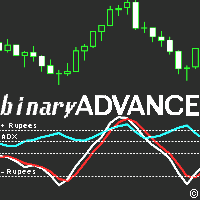
Update 2.2: Added MFI with predictive mod. Updated all indicators to reflect similar values, to combine multiple ones to rest well on overbought/oversold lines.
Update 2.3: Minor bug fixes.
Update 2.4: Removed buggy indicators DeMarker, and MACD, as it was too complicated and not as accurate as the rest due to it's nature. Added Awesome Oscillator. removed spreads, as it bogged the indicator down. Added other features, like indicator value compensators to match each other's levels when combined.
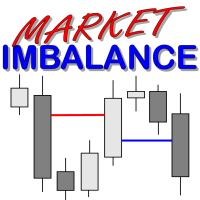
What Is Market Imbalance? Market Imbalance, also known as "IPA" or Improper Price Action, is when price moves so quick in one direction with no orders on the other side of the market to mitigate the price movement. We all know Big Banks, or "Smart Money", can move the market by placing huge orders which in turn can move price significantly. They can do this because Big Banks are the top 10 Forex traders in the world . But unfortunately, the Big Banks cannot leave these orders in drawdown and mu

Break Even Line by MMD
The Break Even line is a useful indicator for people using strategies that allow simultaneous trades in both directions, such as the MMD methodology. This indicator is useful when playing statistical models and averaging positions in accumulation and distribution zones. The indicator draws levels by summing positions in three groups: positions included in BUY, positions included in SELL and all positions included.
Functionality description:
Show BUY BELine - shows or
FREE
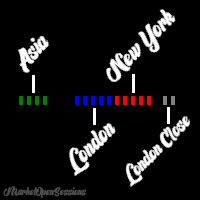
MarketOpenSessions is an indicator helps as a visual clue for which market session is at the time being. If you consider killzone, market open/close as important factor, this indicator would help you reduce effort in converting from one time zone to another. It has the following features 2 display styles: section (as colored line), and histogram 4 major configurable market sessions i.e. Asia, London, New York, and London-Close session. In additional to end of trading session of the day. Female s
Time Line by MMD is a simple indicator that supports historical data analysis and trading on statistical models that follow the MMD methodology.
Start Time - specifying the time when we start analyzing and playing the MMD statistical model Time Duration in minutes - duration of the model and its highest effectiveness (after the end of the line, the price returns - statistically - to the set level) Lookback days - the number of days back, subjected to historical analysis Base Time Frame - the b
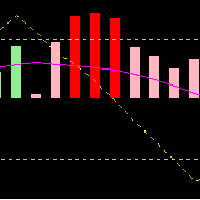
CoioteOscilator é um rastreador de tendência e padrões de estruturas gráficas. O Indicador é composto de 3 elementos. oscilador principal lento: histograma com nível de 0 até 50 e 4 cores, 2 compradoras, de 0 até 30 e acima de 30 e duas vendedoras, de 0 até 30 e acima de 30. oscilador principal rápido: linha magenta com nível de -50 até 50. gatilho: linha amarela com nível de -50 até 50. O oscilador principal lento é um rastreador de tendência primaria.
O oscilador principal rápido é u
KT Trend Exhaustion is our personal implementation of the famous Trend Exhaustion Index developed by Clifford L. Creel, Ph.D., in 1991.
The change in price direction often comes with uncertainty. TEI helps to tackle the uncertainty by showing a crisp direction using the smoothed color-changing index.
Features
Easy to use and interpret. It comes with a multi-timeframe scanner that scans the upcoming signals across all the time-frames. It can be used as an entry signal or trend confirmation. Al

KT Know Sure thing is a momentum oscillator based on the smoothed rate of change over four different timescales and was developed by Martin Pring. In 1992, Pring published the initial description of the indicator in Stocks & Commodities magazine's "Summed Rate of Change (KST)" article. KST creates a momentum oscillator by combining the price momentum measurements from four different price cycles. Traders can utilize KST to search for bullish or bearish divergences, signal line crossovers, and ce

KT Forex Line can be described as an improved version of the moving average indicator. The indicator is embedded in the main trading chart and features a line that switches between blue and white depending on the prevailing direction or mood of the market.
Utilizing the indicator is simple. You do not need to understand complex graphs and intricate lines. Recognize the indicator line's color and trade accordingly.
Key Features
The indicator has customizable colors, with the blue and red being

The KT Market Speed is a unique and straightforward oscillator-based technical analysis tool that helps traders visualize the speed at which the price of an instrument changes based on the preset length. The Market Speed representation helps correctly map the price momentum: is it moving fast, slowing down, or trapped in a range? These are the questions the indicator answers, giving traders more bandwidth to execute better-informed trade positions.
Formula
It's a simple technical analysis tool

KT Forex Super Scalper is created to identify market trends and plot trade signals based on the direction of the predetermined trend. It functions very similarly to moving averages but reacts quickly to changes in price actions and can signal right away once a valid trend is confirmed. The quick reactionary feature makes it a valuable tool for scalpers. However, anyone familiar with moving averages can use it for actual trading because of its signaling process and chart demonstration simplicity
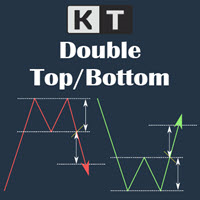
The double top bottom pattern is arguably one of the technical analysis's most popular chart patterns. These patterns are used to capitalize on recurring patterns and identify trend reversal patterns, thereby creating well-placed entry and exit levels. The KT Double Top Bottom is based on these patterns and fine-tunes the trade signal development process for traders.
Features
It's based on one of the most reliable trading patterns and brings some fine-tuning and automation to the process. Also

20 Pips per trade - Componding strategy,
This indicator will send you alerts when certain conditions are met together with entry price as well as exit prices. Al you have to do is take the trade with proper risk management. The compounding strategy works as follows :
Trade Pairs : This indicator will work best on any currency pairs but has been optimized for the follow : , EUR/AUD, EUR/CAD, GBP/AUD, GBP/USD. Using this indicator on other trading instruments will work but is not advised. Comp
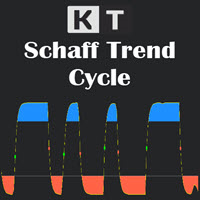
The Schaff Trend Cycle (STC) is a technical analysis tool that helps traders and investors plot highly-probable predictions on the price direction of an instrument. Due to its predictive properties, It's a good tool for foreign exchange (forex) traders to plot buy and sell signals. The Schaff Trend Cycle was developed by prominent forex trader and analyst Doug Schaff in 1999. The idea driving the STC is the proven narrative that market trends rise or fall in cyclical patterns across all time fr

Basic technical analysis tools use signals during market changes by providing critical information that can influence investment and trading decisions. Several technical analysis tools are developed for this purpose, and one of the most popular indicators traders use the KDJ Random index. It's known as the Random Index, is primarily a trend-following indicator that aids traders in identifying trends and prime entry points.
Features
It analyzes and projects changes in trends and price patterns

MOYENNE MOBILE À ÉCHÉANCIER MULTIPLE OSW
(METATRADER 5)
Cet indicateur va vous permettre d'ajouter des moyennes mobiles de tous types de configuration, à la différence que si vous êtes dans une plage horaire, vous pouvez ajouter celle à un niveau supérieur, pour donner un exemple, si vous êtes dans une plage horaire de 5 minutes et que vous voulez voir l'exponentielle moyenne mobile de 20 de temporalité de 15 minutes, 1 heure et 4 heures, seulement en configurant les paramètres corrects dans

Points Candles Osw
Il s'agit d'un indicateur de volatilité professionnel conçu pour quantifier le parcours exact des bougies en points. Grâce à un histogramme dynamique dans une fenêtre indépendante, il permet aux traders de visualiser le momentum et la force du prix, identifiant immédiatement les pics de volatilité et les niveaux de mouvement critiques.
Guide des paramètres (Menu des entrées) Show Points Candles Bullish : Active l'affichage des données correspondant aux bougies haussières. S
FREE

Manuel de l'utilisateur : BOS Breakout Signal (OswalTrading) Le BOS Breakout Signal est un outil de haute précision pour MetaTrader conçu spécifiquement pour les traders qui opèrent sur la cassure de structure (Break of Structure). L'indicateur ne sature pas le graphique avec des signaux aléatoires ; au lieu de cela, il filtre le bruit du marché via un algorithme ZigZag optimisé pour identifier uniquement les niveaux de support et de résistance les plus significatifs avant de confirmer une cass
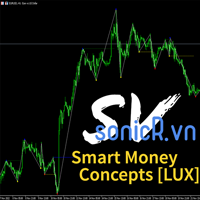
All about Smart Money Concepts Strategy: Market struture: internal or swing BOS, CHoCH; Orderblock; Liquity equal; Fair Value Gap with Consequent encroachment, Balanced price range; Level with Previous month, week, day level or in day level (PMH, PWH, PDH, HOD); BuySell Stops Liquidity (BSL, SSL); Liquidity Void Long Wicks; Premium and Discount; Candle pattern ... "Smart Money Concepts" ( SMC ) is a fairly new yet widely used term amongst price action traders looking to more accurately navigate

Ichimoku Trend Alert is the Ichimoku Kinko Hyo indicator with Alerts and signal filters.
Ichimoku Trend Alert features: Optional check of Ichimoku cloud, Tenkan sen(Conversion Line), Kijun sen(Base Line), Senkou span A, Senkou span B, and Chikou span relative to price, and more. Popup, email, and phone notification alerts for selected symbols and timeframes.
There are 9 classic Ichimoku trend filters you can enable/disable in settings: Price/Cloud Order: Checks the price position relative to
FREE

XE Forex Strengh Indicator MT5 displays visual information about direction and strength of a signal for current pair and chosen timeframes (M5, M15, M30 and H1). Calculations are based on multiple factors and results are shown as a colored panel with scale bar, numerical values and arrows. There are also displayed values of current price and spread on the pair. There can be activated an alert (as a mail or pop-up window with sound) for each available timeframes which send a message when the dir
FREE
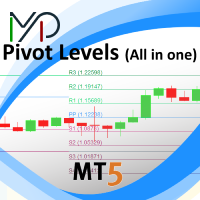
This indicator contains Pivot Levels of: Traditional Fibonacci Woodie Classic Demark Camarilla Calculation periods can be set to auto / Daily / Weekly / Monthly / Yearly. Number of Levels are editable. Options to hide level labels and price labels. Pivots Points are price levels chartists can use to determine intraday support and resistance levels. Pivot Points use the previous days Open, High, and Low to calculate a Pivot Point for the current day. Using this Pivot Point as the base, three

Magic Trend
This MT5 indicator is a Moving Average with 3 signal colors. The 3 input parameters on this Indicator give you a chance to set any Moving Average of choice. A combination of 2 different exponential moving averages, relative strength index, commodity channel index, and William's percent range provide the signals.
White color = Null/No/Exit Signal Green color = Buy Signal Red color = Sell Signal
Point To Note: Confirm the color change only after the current candle closes to avoid
FREE

This indicator is stand alone version from MP Pivot Levels (All in one) containing Woodie Pivots. Woodie’s pivot points are made up of multiple key levels, calculated from past price points, in order to frame trades in a simplistic manner. The key levels include the ‘pivot’ itself, and multiple support and resistance levels (usually up to three each). Traders use these levels as a guide for future price movements when setting up trades.
The pivot : (Previous high + previous low + 2 x previous
FREE

This indicator is stand alone version from MP Pivot Levels (All in one) containing Demark's Pivots.
Calculations: PP = X / 4 R1 = X / 2 - LOWprev S1 = X / 2 - HIGHprev Uses: When the pair currency price may change the direction of movement. Possible constraints of support and resistance that creates plateaus for the currency pair prices. Tendency identification by comparing the present prices according to current day's pivot point and also the prior day's pivot points. ____________
FREE
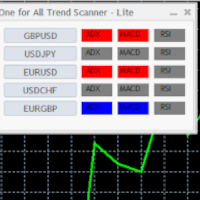
Mini One for All Trend Scanner is a trend following multi-symbol indicator that can be used with any input: forex, stocks, commodities,... The panel shows three indicators and six symbols with the trend for every pair (symbol/indicator): up, down or no trend. The indicators are: Average Directional Movement Index (ADX) Moving Average Convergence Divergence (MACD) Relative Strength Index (RSI) You can change quickly the chart by clicking any one of the symbol button in the panel. This feature
FREE

Keltner Channels (ou Canais de Keltner ) é mais um indicador de volatilidade utilizado pela análise técnica. Também chamado de envelope , esse canal foi criado por Chester Keltner para monitorar os seus investimentos no mercado futuro de café na década de 1960. Porém, com o passar do tempo, passou também a ser utilizado para outros ativos e, atualmente, é uma das ferramentas mais utilizadas pelos traders. Nesta versão customizada foram adicionados novas opções de método de média movel

A Média Móvel é um indicador que faz parte da Análise Técnica. Com ela, é possível identificar o equilíbrio dos preços no mercado, observando tendências de alta, neutra ou baixa. Este indicador customizado traz opções extras pera definir o método de cálculo podendo-se esclolher entre SMA,EMA,SSMA,LWMA,JJMA,JurX,ParMA,T3,Vidya,AMA,HULL MA. Também conta com varias opções para escolher o método de cálculo para o preço base a ser usado no cáculo da média.

GIVE A LOOK TO MY OTHER PRODUCTS ! 100 % PER MONTH PROFIT----CONTACT ME FOR MORE INFO !
The Commodity Channel Index (CCI) measures the current price level relative to an average price level over a given period of time. CCI is relatively high when prices are far above their average. CCI is relatively low when prices are far below their average. Using this method, CCI can be used to identify overbought and oversold levels.
You can set the period of CCI.
The indicator gives an alert when price

My Pivot is an Indicator based on Pivot Lines and Support-Resistance zones. This Indicator will Plot 11 SR zones including Pivot Line which will definitely help you to understand the exact SR zones of the Market.
Steps to Setup the Indicator: Install the Custom Indicator; Set all the Lines Color, Width and Styles; Set visualization to All Timeframe; and DONE
It can be used for: All Pairs: Forex, Cryptocurrencies, Metals, Stocks, Indices. All Timeframe All Brokers All type of Trading S
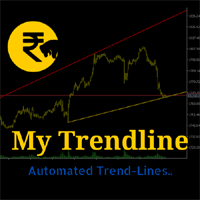
My Trendline is an Indicator based on Upper and Lower Trendline which will Plot Automatically into the Chart. This Indicator will perfectly indicate you the Trend of the Market. It can be use in any Time Frame. The Indicator will automatically adjust according to the Current Time Frame.
Steps to Setup the Indicator: Install the Custom Indicator; Set all the Inputs, Line Color, Width and Styles etc. (Can use the Default Setting also); Set visualization to All Timeframe; and DONE
It can

Multiple Timeframe MACD indicator. This indicator was built for making multiple timeframe analysis possible in MT5 using MACD Indicator. MACD Indicator traditionally shows two lines and one histogram. MACD Line(Yellow) is calculated by subtracting 12period EMA(fast) from 26period EMA (slow). Signal Line(Blue) is created by a 9period EMA from MACD Line. Histogram is just the difference between MACD and Signal lines. Histogram is colored based on the difference between its value and the previous h
This Renko is: Live : constantly updated on the market prices Dynamic : updating on each new ATR value Backtestable : Generating the chart during backtest, allowing Real Ticks Accuracy and Time Period Accuracy Guppy Built-in : GMMA with 12 EMA built-in This is what you are looking for! RENKO A Renko chart is a type of chart, developed by the Japanese, that is built using price movement rather than both price and standardized time intervals like most charts are. It is thought to be named a

Gartley Hunter Multi - An indicator for searching for harmonic patterns simultaneously on dozens of trading instruments and on all possible timeframes. Manual (Be sure to read before purchasing) | Version for MT4 Advantages 1. Patterns: Gartley, Butterfly, Shark, Crab. Bat, Alternate Bat, Deep Crab, Cypher
2. Simultaneous search for patterns on dozens of trading instruments and on all possible timeframes
3. Search for patterns of all possible sizes. From the smallest to the largest
4. All fou

Cet indicateur a été développé pour vous aider en tant que commerçant à identifier la direction du marché, dans le commerce, nous avons trois types de mouvements et UPTREND, DOWNTREND et SIDEWAYS, le mouvement latéral du marché est l'endroit où la plupart des commerçants sont piégés, car le prix est consolider, cela signifie simplement qu'il n'y a pas de direction, pour les scalpers, cela peut être un avantage pour eux UNIQUEMENT s'ils savent identifier quand les classes d'actifs se trouvent da
FREE
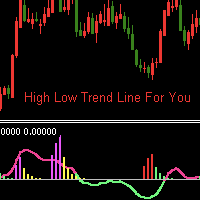
Présentation de l'indicateur :
L'indicateur dessine une ligne de tendance et un histogramme, il a un petit décalage de prix et n'a pas de fonctions futures, les signaux ne dériveront pas. Lorsque le marché est soumis à des oscillations inter-zones, si l'indicateur apparaît en histogramme rouge et vert, il s'agit d'une zone de prix bas, si l'indicateur apparaît en magenta et histogramme jaune, il s'agit d'une zone de prix élevés. Il peut également être utilisé pour analyser la tendance du march
FREE
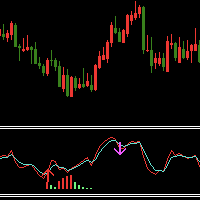
Indicator introduction: The indicator draws wave lines and histograms, It has small price lag, and the signal will not drift. The indicator can send emails, alerts and notifications to you when previous k line has an up arrow and it is under the histogram sections or it has a down arrow. you can choose whether or not to send the two kind of alerts, the alerts repetition times can also be changed. If the indicator appears red and green histograms, this is a buy zone. It can be used to analyze mar
FREE
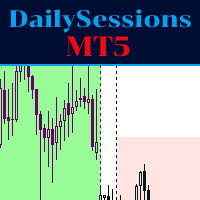
The indicator represents the session boxes for the Asian, European and American sessions. It is possible to change the time of each session, such as color. It is also possible to disable the display of each session. You will find in input parameters variables to modify in format hh:mm. In Colors tab you can change the color of boxes of each sessions. If you need some implementations please contact me.
FREE
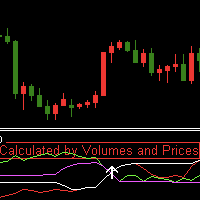
Indicator introduction:
The indicator is calculated by volumes and prices, It is a single side indicator, only has up arrow signals. It is better to use it in conjunction with other trend indicators, and you need to find the most efficient time to use it in order to acquire a high winning probability. The indicator can send emails, alerts and notifications to you when the indicator before k line has an up arrow. The indicator's parameters can be changed, including the computation period of the
FREE
Adrian MOROSAN (2011) examined the same set of data using both traditional and modified RSI. He also incorporated trading volume in the method's calculating formula. Finally, findings acquired using the indicator's traditional form will be compared to those obtained using the modified version. He found that, in comparison to the original form, his version resulted in a greater advantage when a different, even opposing interpretation was used. And, in the alternative case, it resulted in much lar
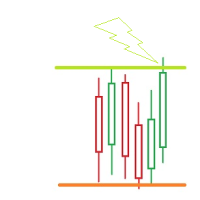
- simple PRICE Action Indicator/ Tool - SELF-Adjusting - you choose the UPPER Border of your RANGE ( Resistance) - you choose the LOWER Border of your RANGE ( Support) # Alert happens when the PRICE TOUCHes 1 of these Borders # (we release a CLOSED above/below - Version too) - popup Alert or custom sound - PUSH notification ( no email - that tool is for quicker action) - once a Border got hit --> it doesnt disappear --> it goes a selectable amount of POINTS ( RANGE(new) ) above/b
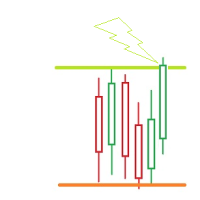
- simple PRICE Action Indicator/ Tool - SELF-Adjusting - you choose the UPPER Border of your RANGE ( Resistance) - you choose the LOWER Border of your RANGE ( Support) # Alert happens when the PRICE CLOSES above/below 1 of these Borders # (we released a TOUCH - Version too) - popup Alert or custom sound - PUSH notification - eMAIL notification - once a Border got crossed(closed candle! )--> it doesnt disappear --> it goes a selectable amount of POINTS ( RANGE(new) ) above/below t

What is the Volume Weighted Average Price (VWAP)? The volume weighted average price (VWAP) is a trading benchmark used by traders that gives the average price an instrument has traded at throughout the day, based on both volume and price. It is important because it provides traders with insight into both the trend and value of the instrument.
What is the Difference between VWAP and AVWAP? While VWAP is having as starting point the beggining of the day,week,month etc. in the AVWAP you can pla
This indicator is based on a mathematical formula which gives you the possibility to seek and find the right frequency of the movement, and to determine its key level; just adjust the frequency parameter! Simple and highly effective; using this indicator you can easily predict the next support and resistance levels of the day. Also, this indicator determines the range and the next two importants levels of the movement outside this range so far. SGFL3 and RGFL3 are levels with high certainty
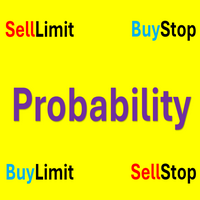
Powerful Price Discovery
Features
1. Displays Key Price Levels and Probability.
2. Key Price Levels: Calculated as (Buy + Sell) × (Limit + Stop) = 4 Lines, shown when Probability > 55%.
3. Time Frame Dependency: Each Time-frame has different OHLC prices, affecting Probability calculations.
4. Breakout Condition: If the price breaks the historical Highest or Lowest, Probability may reach 99%.
5. Parameter: PatrolPoints = 8 : The indicator recalculates only when the price moves over PatrolPoint
FREE

Watch permanently the strength of all majors! The strength is shown through horizontal bars in the top left corner. Additionally you get a recommendetation which pair is currently the strongest/weakest and should therefore be bought or sold. Simple and easy! I use this indicator in my own expert advisor - but I will probably NOT publish this expert advisor! Sorry guys!
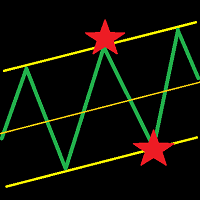
This indicator draws a trend line and a trend tunnel on the chart. You can choose several calculation methods, alerts, notifications, and other settings. It can also draw trendlines from another TimeFrame. You can also use this indicator for your ExpertAdvisor. The current values of the lines are stored in the memory buffer from where the EA can load them. You can trade the price bounce from the upper and lower lines . Settings TimeFrame – trend timeframe Description – show description of line
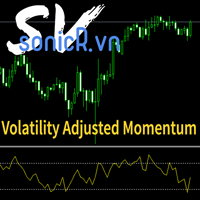
It's a indicators that computes volatility-adjusted momentum. The problem with the momentum indicator is that it's absolute and it's hard to interpret its value. For example, if you'll change the timeframe or instrument value of Momentum will be very different. We tried to solve that by expressing momentum in volatility . This way you can easier spot overbought/oversold values. You can choose to use Standard Deviation or ATR for adjustments. Our method is base on Momentum and the Cross-secti
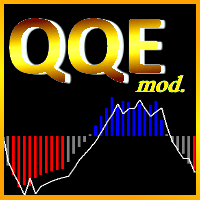
The Quantitative Qualitative Estimation (QQE) indicator is derived from Wilder’s famous Relative Strength Index (RSI). In essence, the QQE is a heavily smoothed RSI.
Modification of this version: ( converted from tradingview script by Mihkell00, original from Glaz, 100% identical output)
So there are Two QQEs. One that is shown on the chart as columns, and the other "hidden" in the background which also has a 50 MA bollinger band acting as a zero line.
When both of them agree - you get a b

How to use?
• Buy Low and Sell High.
• Brighter zones means strong Support or Resistance.
• Weaker zones appear lighter.
• Brighter zones are formed by overlapping of lines from multiple levels of support or resistance.
Indicator Menu
• The indicator can input 5 different Lengths.
• The default settings uses 13, 21, 52, 100 & 200.
• Every option are customizable.

Indicateur MT5 des zones de support et de résistance cet indicateur sait identifier automatiquement les hauts et les bas. Cet indicateur de support et de résistance crée des lignes de support et des lignes de résistance basées sur les hauts et les bas. comment créer des lignes de support et de résistance. il s'agit d'un indicateur pour créer des lignes de support et de résistance automatiques. comment trouver le niveau d'assistance avec indicateur. cet indicateur trouve automatiquement les hauts
FREE
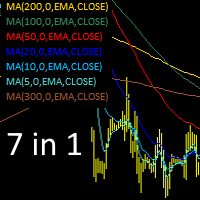
Indicateurs de moyenne mobile - 7 en 1. Installation de 7 indicateurs à la fois, définition de leurs paramètres et propriétés. Les indicateurs utilisés (avec les propriétés de base) sont affichés dans le coin supérieur gauche du graphique. Lorsque vous cliquez sur les propriétés, l'indicateur s'allume (s'active) ou s'éteint. Les propriétés de l'indicateur actif sont affichées par sa couleur. Les propriétés d'un indicateur désactivé (non actif) sont grisées.
Dans les paramètres de l'indicateur i
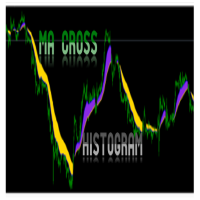
MA Histogram is MT5 Indicator for beginners which plot a histogram after Moving Average Crossover of 2 MAs. The Indicator does not have arrow or alert. It will simply plot on chart the potential Up and Down trend when trend is beginning or ending. It will show a Blue color for potential up trend and Gold color for potential down trend. Recommended Pairs: ALL Pairs including Indices for MT5 FOREX BROKERS Recommended Pairs On Deriv: BOOM 1000, Boom 500, Boom 300 and CRASH 1000, Crash 500, Cra
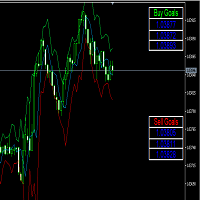
Indicateur d'objectifs d'achat et de vente Il se compose de trois lignes : la première couleur verte identifie les cibles d'achat, la deuxième couleur rouge identifie les cibles de vente et la troisième couleur bleue est le prix moyen. Il y a deux façons d'entrer - Méthode 1 : Point d'entrée lorsque le prix moyen est cassé avec une longue bougie d'en bas et rester au-dessus de la ligne bleue avec une bougie verte est considéré comme un achat Lorsque le prix moyen franchit
Le MetaTrader Market offre un lieu pratique et sécurisé pour acheter des applications pour la plateforme MetaTrader. Téléchargez des versions démo gratuites de Expert Advisors et des indicateurs directement depuis votre terminal pour les tester dans le testeur de stratégie.
Testez les applications dans différents modes pour surveiller les performances et effectuez un paiement pour le produit que vous souhaitez en utilisant le système de paiement MQL5.community.

Vous manquez des opportunités de trading :
- Applications de trading gratuites
- Plus de 8 000 signaux à copier
- Actualités économiques pour explorer les marchés financiers
Inscription
Se connecter
Vous acceptez la politique du site Web et les conditions d'utilisation
Si vous n'avez pas de compte, veuillez vous inscrire