 MetaTrader 5
 エキスパート
 インディケータ
 ライブラリ
ライブラリ ユーティリティ
 ウィジェット
 ルール
ルール
YouTubeにあるマーケットチュートリアルビデオをご覧ください
ロボットや指標を購入する
仮想ホスティングで
EAを実行
EAを実行
ロボットや指標を購入前にテストする
マーケットで収入を得る
販売のためにプロダクトをプレゼンテーションする方法
MetaTrader 5のための新しいテクニカル指標 - 165
 テクニカル指標からのシグナルは、株式および外国為替市場での取引の開始と終了に重要な役割を果たします。指標の本質は、将来の価格変動を予測することを目的とした金融銘柄価格の数学的変換です。
テクニカル指標をテストして、市場の動きとそれからの利益をより正確に予測します。
テクニカル指標からのシグナルは、株式および外国為替市場での取引の開始と終了に重要な役割を果たします。指標の本質は、将来の価格変動を予測することを目的とした金融銘柄価格の数学的変換です。
テクニカル指標をテストして、市場の動きとそれからの利益をより正確に予測します。 
Acceleration Force Meter Indicator - is a trend system that join market in trend phase and after trend pull-back. AFM indicator - is the system that watchs market phases from flat to extreme volatility and prefers to enter in market when it's active, more volatility, ignoring most flat places. This is 100% complete trading system including enter and exit points. It works well with profitable trades - maximizing take profit targets(analysis of recent market volatility, its pips range to adapt cur

Golden section price action indicator - is a trend-scalping complete system with enter and exit points. Indicator is based on most powerfull price action japan patterns that are filtered by volume, volatility, market phase. Pattern is not a simple combinations of candles. Patterns must have "weight" to move market in right direction. "Weight" - is the summary of pattern's volume, the size of pattern candles according to last average volatility and ofcourse pattern must appear in correct market p
Identification of support and resistance areas
A useful indicator for traders
completely free
Can be used in all symbols
Can be used in all time frames
It has three different trends: short term, medium term, long term
Settings:
Clr1,2: You can change the color of the lines
Type Trend: You can determine the trend
Message me for questions, criticism and suggestions
FREE
AlgoKing Chandelier Exit Indicator (MT5)
The Chandelier Exit Indicator is a volatility based indicator that maximizes returns using the Average True Range (ATR) value and the highest high or lowest low of a period. Benefits Should be used as a trailing stop. Helps you exit a position when you have a respectable profit. Identifies a high probability of a trend reversal when the price moves against the prevailing trend by a distance equal to 3x the average volatility. Join the AlgoKing Lightning

Diagnosis of major and minor pivot
Trend detection
with many signals
Can be used in all symbols
Can be used in all time frames
Settings:
Back Show: The number of candles it displays
If you need any adjustments, or have any questions or suggestions, message me
How to trade:
Blue: sell signal
Red: buy signal
Blue and red at the same time: no signal
Exit signal: Opposite signal

Forecasting the future by combining trend and average price
with many signals
Can be used in all symbols
Can be used in all time frames
Settings:
BackShow: The number of candles displayed
Osi: Main setting, the larger the number, the longer the trend
If you need more settings, or have any questions or suggestions, message me
How to trade:
Blue: sell signal
Red: buy signal
Blue and red at the same time: no signal

UR ダイバージェンススポッター
UR DivergenceSpotter は、長年の経験の結果であり、時には最も簡単な方法が最善です。 いくつかの指標の間には良好な相関関係がありますが、それらが一致しない場合 (価格は「再調整」しようとします)、UR DivergenceSpotter でシグナルを受け取るのはその瞬間です。
UR Divergence Spotter を使用する利点:
パラメータなし ろうそくの作成後に再描画しません シグナルが有効でなくなった場合のシグナル (つまり、トレードをより長く保持し、ストップ ロスを BE に設定して乗り、部分的な利益を得るか、完全に閉じることができます!)。 この指標は、長年の経験と観察の結果です。 それはしっかりしていて、テスト済みです。 より良い結果とより安全な信号を得るには、より高い時間枠 (h1/h4) で使用するのが最適です。
加えて、UR TrendExhaustion や UR VolumeTrend などの私の他のインジケーターと一緒に使用して、シグナルの精度を高めることもできます。 ツールの最新情報を入手

UR ボリュームトレンド
UR VolumeTrend は、出来高の継続的な傾向を示す最も明確な出来高インジケーターです。 UR TrendExhaustion などの他のインジケーターと完全に連携して、ローカルのトップとボトムを示します。
パラメータは 2 つだけに制限されています。値が高いほど、トレンドが長く表示されます。 極端な勾配は、潜在的な反転を捉えるためにボリュームが枯渇する可能性を示しています。 2 本の線 - 出来高の傾向と平均です。 最大の利点: 簡単で、すべてのアセットに合わせて調整できます。 ツールの最新情報を入手できる特別な電報チャットがあり、何か不足していると感じた場合はリクエストを送信することもできます!
UR VolumeTrend を選ぶ理由
トレンドを捉えるには出来高が鍵となることは誰もが認めるところです。 このオシレーターは、1 つの使いやすいインジケーターに圧縮されたすべてのボリューム ツールの合計です。 見やすい方法で正/負のボリュームを示します。 背後にあるインターフェイスは、ボリュームが過去に比べて使い果たされている可能性があ

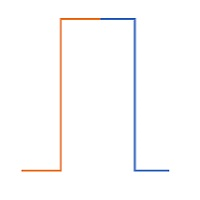
A Good , Easy , Readable and handy indicator for experienced and professional traders. It gives bounded signals between zero and one. Easy for investors to comprehend. It gives near and longer trading outlook to investors and helps them to find good opportunities. Indicator gives zero signal on price downturns and signal value equals to one on price upturns. Once again a new type of indicator and rangebound between zero and one .
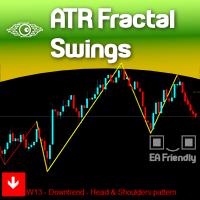
The concept of Fractals is everywhere in the respected Technical Analysis teaching and for a good reason: It Makes Sense! It is not a "self-fulfilling prophecy" like Fibonacci levels which we totally respect but we didn't explore yet, but this concept of Fractals can only be seen visually on your chart if we really SHOW that to you on your chart, right?
There are dozens of Zig-zag and Swing Legs indicators out there so you probably would be wondering: Why our indicator is different? Because we a
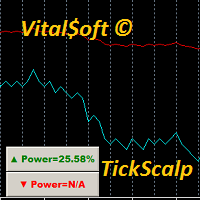
Free version of the TickScalper indicator. The Tick Scalp indicator is a trading assistant for a scalping trader. Works in a separate window. Tracks the momentary activity of the market, shows the graph of the movement of ticks and the strength of bulls or bears. Sometimes it can anticipate the beginning of a strong movement before any other indicators. Helps the trader to make a decision to open the desired order. Designed to work on any instrument. Used timeframes from M1 to M15. Has simple a
FREE
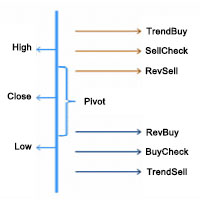
In the Forex trading system, the Pivot Points trading method is a classic trading strategy. Pivot Points is a very simple resistance support system. Based on yesterday’s highest, lowest and closing prices, seven price points are calculated, including one pivot point, three resistance levels and three support levels.
The resistance line and the support line are one of the tools that are often used in technical analysis, and the role of the support line and the pressure line can be mutually trans

!! FLASH SALE !! Over 80% off !! For ONE week only. Now only $47 - normally $297! >>> Ends on 30 June 2023 - Don't miss it!
Buy and Sell Arrows On The Chart According To Price Action Sends Alerts On MT5 To Your Phone To You Email
Does NOT repaint. Works on any pair, any timeframe.
10 Activations allowed so you are free from limitations. MT4 Version here . For spreads from a tiny 0.1 pips RAW/ECN Accounts, click here . Check out my Waka Esque EA signal here: >> High Risk Se
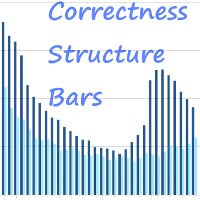
The Correctness Structure Bars indicator displays the bar structure in digital terms. How to Interpret the Information Provided by the Indicator It is very simple, all you have to do is analyze the chart. We will explain the work using an example, take the EURUSD instrument on the D1 timeframe, install this indicator and analyze the information provided by the indicator. The indicator works in the bottom of the chart and gives the result in the form of a histogram, that is, each bar (when a bar
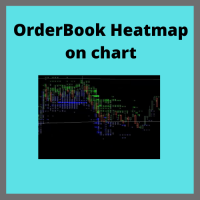
Ever needed a Boomap-like indicator for you MT5? Here you are!!
FULL WORKING DEMO VERSION available on Channel:
https://www.mql5.com/en/channels/011107AFAAE3D801
With this indicator you will see all the important levels, in which the largest bid and ask order are sitting. This indicator will show show all the history on limit order planed on the book. It will work only for futures broker who support level 2 order book. You can visualize the orders with colors and or with a text indicating the
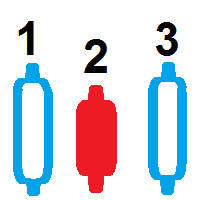
キャンドルカウンター このインジケーターはキャンドルをカウントし、 より長い時間枠に基づいてキャンドルの画面に数字を表示します 。 長期間 毎日の時間枠を「 BIgger Timeframe 」として選択し、時間枠が短い任意のグラフ内で実行できます。カウンターは 日足チャート に基づいてバーをカウントします。 時間枠「 H1 」をパラメーターとして渡すと、インジケーターはH1チャート内のバーをカウントする方法を認識します。これは、時間枠が短いチャートで実行する必要があります。 主なパラメータは「 大きい時間枠 」です。これは、使用している時間枠よりも長い時間枠であり、キャンドルカウントの基準となります。 番号を表示 このパラメーターに加えて、数字を表示するかどうかを指定するパラメーターがあります。画面の中央に数字を表示する必要はないため、 CTRL+D を押すとカウントを表示できます。 およびインジケーター「 BarIn(時間枠) 」を監視します。 マウス この領域は、画面上で マウスを動かす ときにも非常に便利です。そのため、マウスカーソルが通過している正確なバーを確認できます。画像
FREE

回帰取引を意味する専門的かつ定量的なアプローチを実装する独自の指標。これは、価格が予測可能かつ測定可能な方法で迂回して平均に戻るという事実を利用しており、非定量的な取引戦略を大幅に上回る明確な出入りルールを可能にします。 [ Installation Guide | Update Guide | Troubleshooting | FAQ | All Products ]
明確な取引シグナル 驚くほど簡単に取引できます カスタマイズ可能な色とサイズ パフォーマンス統計を実装します ほとんどの取引戦略を上回ります 適切なSLおよびTPレベルを表示します 電子メール/音声/視覚アラートを実装します
使い方
インディケータは、より高い時間枠からの完全にカスタマイズ可能な移動平均の周りの標準偏差を測定し、トレンドフォローアプローチを使用して正確に取引を見つけます。取引は、現在のチャートの価格アクションに飛び込むことによって見つけられ、価格が選択したより高い時間枠から計算された平均価格帯に戻ったときに閉じられます。それがコード化される方法のために、指標は高ボラティリティと強いトレンドの市場か

AWキャンドルパターンインジケーターは、強力なキャンドルパターンスキャナーと組み合わせた高度なトレンドインジケーターの組み合わせです。これは、最も信頼性の高い30のローソク足パターンを認識して強調表示するための便利なツールです。さらに、それは色付きのバーに基づく現在の傾向分析器です。 サイズ変更と配置が可能なプラグインマルチタイムフレームトレンドパネル。トレンドフィルタリングに応じてパターンの表示を調整する独自の機能。 利点: キャンドルパターンを簡単に識別 結果を再描画しません 内蔵のマルチタイムトレンドパネル 無効なパターンタイプ(1、2、3キャンドル) パターン表示時のトレンドフィルタリングの調整 MT4 version -> HERE / Instructions and description -> HERE 表示されるパターンのリスト: ハンマーパターン ピンアップ/ピンダウン 弱気なハラミ/強気なハラミ 弱気のハラミクロス/強気のハラミクロス ピボットポイント反転アップ/ピボットポイント反転ダウン ダブルバーローとハイクローズ/ダブルバーローとロークローズ 終

LT Support Resistance - サポート&レジスタンスを100%自動で識別 手動でサポートラインやレジスタンスラインを引く作業に、時間を取られて疲れていませんか?あるいは、重要なレベルをいつも見落としてしまい、悔しい思いをしていませんか?LT Support Resistanceは、そのような煩わしい作業をなくすために開発されました。複数のタイムフレーム(時間足)を同時に分析し、取引しているアセットの最も重要なゾーンを自動的に識別してチャート上に描画します。 == 重要レベルのスマート自動化 == 主観的で時間の Gann(ガン)かかる手動のライン引きとは異なり、このインジケーターは価格の履歴を分析し、重要な反転ポイントを特定して、価格が「実際に」意識しているサポート・レジスタンスラインを描画します。その結果、客観的で素早い、データに基づいた分析が可能になります。 == 主な特徴 == 100% 自動検出: 手動による分析なしでサポート/レジスタンスを識別 マルチタイムフレーム (MTF): M5(5分足)チャート上に、H1、H4、D1、W1のレベルを同時に表示可能 ス

Volatility Vision: Essential for Forex and Stock Markets
Volatility Visionを発見:あなたの取引革命 初心者とエキスパートトレーダーに最適 簡単スタートガイド: 当社の ユーザーマニュアル で効果的な使い方を学びましょう。
Volatility Vision インディケーターは、チャート上に正確なボラティリティレベルをマッピングする強力なツールです。この多用途なツールは、取引戦略に統合するために不可欠で、すべての通貨ペアおよび株式市場に対応しています。 ボラティリティの閾値 を活用して、一週間の取引を自信を持って管理しましょう。 Volatility Visionの利点 精度向上: ストキャスティクスオシレーターで一般的な誤検知を大幅に減少させます。 早期シグナル: RSIよりも早く取引シグナルをキャッチし、見逃した機会を捉えるのに役立ちます。 市場のリーダー: MACDが反応する前に積極的なインサイトを提供します。 信頼性: CCIからの誤信号の一般的な問題を回避します。 簡単な設定 開始するにはATR値を入力
Indicator developed by the Brazilian and analyst Odir Aguiar (Didi), consists of "Moving Averages", famously known as "Didi needles", where it allows the viewing of reversal points.
The concept is very simple, when you enter 3 Moving Averages on display, a period equal to 3, one equal to 8 and the other equal to 20, then the formation of the indicator that works in axis or line center equal to 0 (zero) appears. ). Moving averages must intersect when approaching line 0.
The scanner monitors 10
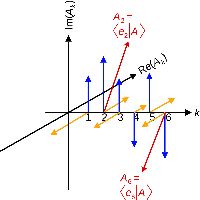
ComplexVectorHL is an indicator that characterizes the change in short-term market trends. The indicator is based on market analysis using the mathematical apparatus of complex numbers. The essence of the indicator is that it, with clear impulses, indicates the points in time when it is necessary to make decisions. The impulses are like a cardiogram showing the heartbeat of the market. The indicator has pulses only in one direction (unlike the previous development of ComplexVector), the pulses
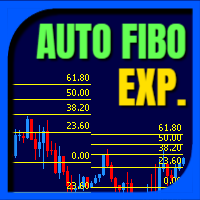
Auto Fibo Expansion is an indicator that projects the Fibonacci expansion levels above and below the opening price of the day. It does the calculation based on the previous day and projects the levels on the current day. It is very efficient to find "psychological" zones of support and resistance. Its appearance is all configurable and you can set up to 30 different levels. Enjoy! This is a free indicator, but it took hours to develop. If you want to pay me a coffee, I appreciate a lot <3 PayP
FREE
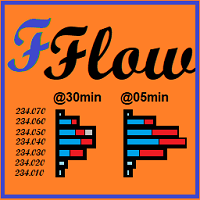
Tape Reading, flow monitoring.
FabFlowInPrice is a powerful indicator for those who like Tape Reading (Times & Trades). It presents the volumes traded at each price level, considering the purchase, sale and direct aggressions for each level. Excellent tool for market flow analysis. Thought of flow so monitor who is attacking the most, buyers, sellers or direct exchanges, thought FabFlowInPrice. The indicator displays information in 4 distinct and fixed periods, on any timeframe: @Day - All t

This is the famous Sunflower indicator for Metatrader5. This indicator marks possible tops and bottoms on price charts. The indicator identifies tops and bottoms in the asset's price history, keep in mind that the current sunflower of the last candle repaints, as it is not possible to identify a top until the market reverses and it is also not possible to identify a bottom without the market stop falling and start rising. If you are looking for a professional programmer for Metatrader5, please
FREE

Klinger Volume Oscillator (KVO) - A Powerful Trend & Momentum Indicator This is an enhanced version of the Klinger Volume Oscillator (KVO) , a widely used indicator designed to help traders identify momentum shifts, trend direction, and overbought/oversold conditions in the market. How the KVO Indicator Works: Volume-Based Trend Identification – Unlike traditional oscillators that rely solely on price movements, the KVO uses both price and volume to detect market trends and momentum shifts .
FREE
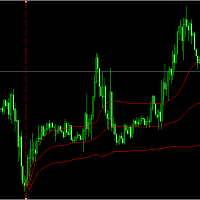
place a vwap line starting from the line placed on the chart parameters: tick_mode: enable to use ticks instead of bars. this uses a lot more cpu processing power prefix: prefix to add for line created by indicator line_color: set the color of the line created line_style: set the line style of the line created applied_price: set the price of bar to use of the bar std_dev_ratio: set the multiplier for the std dev channel

HEIKEN PLUS is the only indicator you really need to be a successful trader , without in depth knowledge of the forex trading or any tools.
Also there is automatically trading EA available now: https://www.mql5.com/en/market/product/89517? with superb SL/TP management! and sky high profit targets !!!
Very suitable tool for new traders or advanced traders too. This is MT5 version. For MT4 version visit : https://www.mql5.com/en/market/product/85235?source=Site
HEIKEN+ is a combination of 2 i

Numa folha qualquer
Eu desenho um sol amarelo
E com cinco ou seis retas
É fácil fazer um castelo
Corro o lápis em torno da mão e me dou uma luva
E se faço chover com dois riscos, tenho um guarda-chuva
Se um pinguinho de tinta
Cai num pedacinho azul do papel
Num instante imagino uma linda gaivota a voar no céu
Vai voando, contornando
A imensa curva norte-sul
Vou com ela viajando
Havai, Pequim ou Istambul
Pinto um barco à vela
Branco navegando
É tanto céu e mar num beijo azul
Entre as nuvens vem
FREE

テクニカルインジケーターでこのようなフォームを使用すると、インジケーターの感度と安定性の間の妥協点を見つけることができます。それはそのアプリケーションで追加の可能性を与えます。 インジケーターパラメーター: iType -ogiveフォームのタイプ。 iPeriod -インジケーター期間。 iFactor は、放物線および指数形式で使用される追加のパラメーターです。有効な値は0〜255です。iFactor= 0の場合、インジケーターは単純な移動平均に縮退します。 iChannel -価格が変動する上位および下位チャネルを構築できるようにするパラメーター。有効な値は-128〜127です。値が正の場合は上部チャネルが描画され、値が負の場合は下部チャネルが描画されます。 これらのパラメーターを組み合わせることにより、さまざまな結果を得ることができます。このインジケーターは、市場のトレンド価格の動きを追跡するために使用できます。チャネルを構築することにより、価格が移動できる最も近いターゲットを取得できます。チャネル境界値は、利益を取り、損失を止めるために使用できます。 iFactorを使用す

DYJ ChameleonTrend funciona com base no sistema Trend Following e Counter Trend. DYJ ChameleonTrend é um indicador de alta probabilidade. Este indicador usa um indicador Mix exclusivo que combina indicador sofisticado com discrição do usuário. Este indicador é um algoritmo de variância e ATR cruzado de adn Ma mais avançado. O indicador exibe duas setas direcionais coloridas e bolas de rolagem de tendência, indicando as melhores posições de entrada e saída para os traders. Entrada InpPeriod = 50
このインジケーターは、クラシックなZigzagインジケーターによって形成される各価格スイングに上下の矢印を描画します。Zigzagが新しいスイングの安値を形成すると、緑色の矢印が表示されます。同様に、新しいスイングの高値が形成されると赤色の矢印が表示されます。
特徴
クラシックなZigZagと比較して、より効果的にスイングポイントをマークします。 形成中のチャートパターンを事前に識別するのに役立ちます。 Zigzagの方向を複数の時間足で表示するマルチタイムフレームスキャナーを搭載。 すべてのMetaTraderアラートが含まれています。
入力パラメーター Depth(深さ): Zigzagの転換点で使用するバーの数を決定する整数値。 Deviation(乖離): 方向を変える前のパーセンテージ乖離。 Back Step(バックステップ): Zigzagの高値・安値間の最小バー数。 MTFスキャナー: 複数時間足にわたってZigZagの方向を表示します。 アラート設定
欠点 Zigzagはリペイントされる遅延型インジケーターであるため、それに基づいて描画された矢印も同様にリ

このインジケーターは、RSIの買われ過ぎ/売られ過ぎの領域を上回るまたは下回るバーの数を使用して、市場の強気/弱気の状態を表示します。緑のヒストグラムは強気の力を示し、赤のヒストグラムは弱気の力を示します。
特徴
新しいトレードのエントリーに使用することも、他の戦略やインジケーターのトレードを確認するために使用することもできます。 複数の時間軸をスキャンするマルチタイムフレームスキャナーが搭載されており、各時間軸の強気/弱気の勢力を分析します。 初心者トレーダーが強気/弱気の勢力を利用してエントリーを確認できるため、自信を持ってトレードできるようになります。 MetaTraderの全アラート機能を搭載。
入力パラメーター 期間: RSIの買われ過ぎ/売られ過ぎレベルを特定するための期間。 バー期間: RSIの買われ過ぎ/売られ過ぎレベルを上回る/下回るバーの数。 売られ過ぎレベル: RSIで売られ過ぎの水準を決定する値。 買われ過ぎレベル: RSIで買われ過ぎの水準を決定する値。 MTFスキャナー: すべての時間足からシグナルを取得するマルチタイムフレームスキャナー。 アラ
SSLは「Semaphore Signal Level(セマフォ信号レベル)」の略です。このインジケーターは、ローソク足の高値と安値にそれぞれ適用された2本の移動平均線から構成されており、価格に追従するバンド(エンベロープ)を形成します。 買いシグナル: 価格が上側の移動平均線を終値で上抜けたとき。 売りシグナル: 価格が下側の移動平均線を終値で下抜けたとき。
特徴 すべての時間足に対応するマルチタイムフレームスキャナーを搭載し、新たなシグナルを自動検出します。 クラシックなSSLチャンネルをシンプルに実装しており、トレンド方向を簡単に見極められます。 MetaTraderのすべてのアラート機能に対応しています。
SSLの計算式 上側ライン: ローソク足の高値に基づく移動平均線。 下側ライン: ローソク足の安値に基づく移動平均線。
買いエントリー: 価格が上側SSLラインを終値で上抜けたとき。 買いエグジット: 価格が下側SSLラインを終値で下回ったとき。
売りエントリー: 価格が下側SSLラインを終値で下抜けたとき。 売りエグジット: 価格が上側SSLラインを終値で上回った

これは、2005年にAlan Hullが開発したクラシックなHMAを改良したバージョンです。3つの加重移動平均(WMA)を組み合わせることで、従来の移動平均線よりも遅延を効果的に減らしています。 ロングエントリー: HMAが赤から青に変わり、上向きの傾きになるとき。 ショートエントリー: HMAが青から赤に変わり、下向きの傾きになるとき。
特徴 すべての時間足で新しいシグナルをスキャンするマルチタイムフレームスキャナーを搭載。 HMAは、従来の移動平均でよく見られるラグ(遅れ)を効果的に軽減します。 新たに発生するトレンドの開始と終了を識別します。 すべてのMetaTraderアラートに対応。
HMAの計算式 Hull移動平均は、以下の3つのWMAを使って計算されます: WMA1 = P × WMA WMA2 = P/2 × WMA Raw HMA = (2 × WMA1) - WMA2 Final HMA = Raw HMAのWMA(√P) P = 期間 WMA = 加重移動平均
プロのヒント
HMAは単体でも使用可能ですが、他のインジケーターと組み合わせることで精度が向上
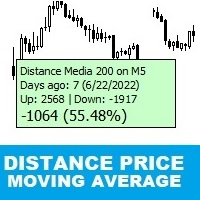
Distance Price Moving Average
This is an indicator that calculates in real time the distance from the price to the moving average.
With it you can monitor the maximum deviation of the price from the moving average in a certain period of time chosen by you, for example, monitor the distance according to the maximum deviation of the last 30 days.
It is possible to choose the period and type of the moving average.
To make it even better, we have added the possibility of two alert levels if th
FREE

Description. The basis for the formation of the Renko chart is the price range. If the price goes beyond its limits, the chart shows a box above or below the previous one. As a result, we see price movement without additional "noise" and important support and resistance levels. Features.
For use in conjunction with the Expert Advisor, an additional buffer is implemented-a box counter. For convenience and to increase the speed of testing, the user can use the "new box" event, which the indicator
FREE
抜群の 追従性と最小限のノイズ ! このトレンド検出インジケーターはノイズや波打ちの影響を最小限に抑えた上で、トレンドの変化に対して機敏に反応します。
また、ダイナミックな市場に合わせて適応するよう設計されてます。
主にトレンドの方向にトレードするのに役立つフィルターとして機能します。 特徴 シンプルで使い方も簡単です。低負荷なので気軽に試せます。 抜群の追従性と滑らかなラインで相場分析に最適です。 既存戦略のトレンドフィルターとして使用できます。 2本のラインでゴールデンクロスとデッドクロスを表示できます。
ローソク足が閉じた後は決してリペイントしません。 すべての 通貨ペア& 時間足に対応しています。 EA開発と互換性があります。
こちらのブログからアラート機能が付いたプロフェッショナル版を特別価格 で 入手できます。
本格的に使用する場合はプロフェッショナル版をお勧めします。 : ここをクリック
パラメーター メイン設定
Period - トレンド計算用の期間です。
Factor - リトレースメントの大きさを指定します。 表示設定
Up color - 上昇時の色設
FREE
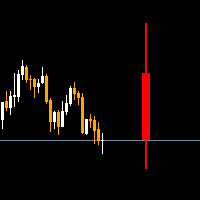
The Higher timeframe candle tracker is used to get a glimpse of what the selected higher time frame candle is like. It plot the candle after the current price. It can come in handy for day traders and short term traders that often worry about how the current higher timeframe candle may look like. You can select the higher time frame or lower time frame from the options provided: By default the color for bears is red and for bulls is green. You are able to change the width of the candle, its wick
FREE
The indicator measures the buying and selling force between the buyers and sellers in the form of a histogram/oscillator by using a BOP equation:
BOP = Moving Average of [close – open)/(high – low)]
Igor Levshin first introduced the Balance of power in the August 2001 issue of Technical Analysis of Stocks & Commodities magazine.
Features
Quickly find the buying and selling pressure among the traders. It comes with simple inputs and an interface. All Metatrader alerts included.
Applications

Back to the Future это индикатор который определяет направление тренда. Определяет четыре уровня для роста и падения 1-й уровень флета 2 -й уровень коррекции 3-й уровень продолжения тренда и 4-й уровень возможного разворота. Индикатор рисует трендовые линии краткострочного и долгострочного тренда. Так же индикатор определяет динамические сел и бай зоны в виде прямоугольников. От ближайшего максимума или минимума рисует фибо уровни для определения целей движения. В меню индикатора отключа
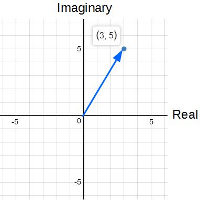
ComplexVector is an indicator based on market analysis using the mathematical apparatus of complex numbers. The essence of the indicator is that it, with clear impulses, indicates the points in time when it is necessary to make decisions. The impulses are like a cardiogram showing the heartbeat of the market.
For example: it may be the moment of planning a new entry. this may be the moment to exit the position. if you work with a series that is in a drawdown, you are recommended to close it in
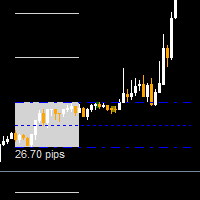
The worktime indicator helps you identify the most important times to day to trade the currency pairs. It was created based on the ICT day trading free tutorials that are freely vailable on his youtube channel. You can use this indicator together with my other indicators that i have shared freely with you like the true day, custom periods, daily month, weekly open lines - they together complement each other very well.
Nuggets from this indicator: 1. Draws the asian session box showinng you the
FREE

The ADX indicator (average directional index) is a technical tool designed to measure the strength of a market trend. The ADX indicator is used for various purposes such as measuring the strength of a trend, finding a trend and a trading range, and as a filter for various Forex trading strategies.
Some of the best trading strategies are based on following the market trend. There are also strategies through which traders make profit by trading against the trend. In any case, if you can identify

The purpose of the inidcator is to identify the reversal point.
The blue arrow is buy signal and the yellow star is its stop loss. The red arrow is sell signal and the yellow star is its stop loss. Please note that the singal is against trend,it could be continual fail. Alert feature: if there is a signal, the indicator will send alerts of popup window,email or mobile push. Inputs: Popup Window Alert: it is false in default Email Alert : it is false in default Mobile Push Alert: it is false in
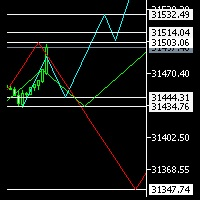
Hello Everyone ,
I am not an Elliot pro , but I promise to let you see it in a different way , have you ever considered to see 3 probabilities of different time frames on same chart ? this will not only enhance your trades entry , but will give you confidence and certainty when everything is not clear.
in my indicator you will be able to select 3 time frames of your choice , define number of candles per each time frame , give the color per each trend (Bearish or Bullish), not only that , you
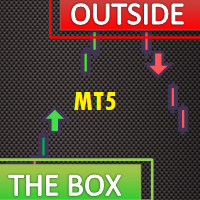
The Outside The Box (OTB) is a complete trading system that provides the user with immense trading ability by highlighting on the chart areas where the trader should prepare to Re-enter the trend after pullbacks (Pullback trading strategy) Take partial/complete profit(Profit taking strategy), and Trade breakouts (Stock breakout strategy) - We have updated the indicator to show/hide Micro breakout areas around the major breakouts (Micro Breakouts). The above is supported by an alert system to no
AIS MT5 INDICATOR 5 ALL INCLLUSIVE SET
GUIDE
CHAPTER 1 IMPORTANT INFORMATION <1> THIS INDICATOR IS ONE OF THE SERIES OF NEW AIS INDICATORS AIS MT5 INDICATOR 1 =ADVANCED CLASSIC= AIS MT5 INDICATOR 2 =MULTIFRAMES= AIS MT5 INDICATOR 3 =LINES= AIS MT5 INDICATOR 4 =MARKET PROFILES= AIS MT5 INDICATOR 5 =ALL INCLUSIVE SET
CHAPTER 2 GENERAL FEATURES OF THE SERIES
<1> AIS MT5 INDICATOR 1 =ADVANCED CLASSIC= < DEVELOPMENT PAUSED > DISPLAYS MAIN TIME POINTS AND PRICE LEVELS OF THE CHART SUCH
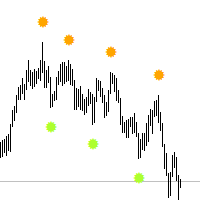
Think of the Super Fractal Indicator as the Bill WIlliams Indicator on Steroids. Indicator Abilities: 1. Adjust Candle around Fractal High or Low. 2. Adjust Lookback period and only plot for a specific number of history candles avoiding cluttering your trading desk. 3. The Indicator uses buffers so you call and use it from any EA.
Note : The higher the candles around Fractal, the stronger the Turning point anfd viceversa is true.
FREE

この指標は、いわゆる「悪」の数値を重み係数として使用します。それらの反対は「いやらしい」数字であり、これもこのインジケーターに表示されます。これらの2つのクラスへの数値の分割は、特定の数値のバイナリ表記の単位数によって決定されるハミングの重みに関連付けられています。 これらの数値を重み係数として使用すると、トレンド追跡インジケーターが得られます。さらに、いやらしい数字はより敏感な指標を与え、邪悪な数字は保守的な指標を与えます。それらの違いはそれほど大きくはなく、市場での急激な価格変動によってのみ顕著になります。このインジケーターの使用は、新しいトレンドの開始を判断するのに役立ちます。これにより、位置を開く瞬間をより正確に決定することが可能になります。 インジケーターパラメーター: Type numbers -番号タイプの選択、EvilまたはOdious; iPeriod -インジケーター期間。インジケーターの感度は、このパラメーターによって異なります。小さいほど、価格の変化や市場動向の変化に対する感度が高くなります。 インジケーターの動作例を図に示します。

MT5のWA_PV_BOX_EFFORTXRESULT WAPV Box Effort x Result Indicatorは、Package Indicatorsグループ(Wyckoff Academy Wave Market)の一部です。 MT5のWAPVボックスエフォートx結果インジケーターは、価格とボリュームを読み取るのに役立ちます。その読みは、努力×結果の特定を支援することで構成されています グラフによって作成された波で。 ボックスが緑色の場合のMT5のWAPVボックスの労力x結果インジケーターは、ボリュームが需要に有利であり、ボックスが赤色の場合を意味します ボリュームは供給に有利です。 ボックスが大きいほど、価格に対するボリュームの変位が大きくなります。価格の上昇波がボックスのサイズに比例しない場合、 努力×結果。 非常に視覚的な方法で、ボリュームと価格の間のこの相違を識別できます。 MT5のWAPVBoxEffort x Result Indicatorを使用すると、インジケーターをゼロ軸の下に配置することで、視覚化を向上させることもできます。 ティックボリュームとリア

MT5のWAPV価格と出来高インジケーターは、(Wyckoff Academy Wave Market)および(Wyckoff Academy Price and Volume)ツールセットの一部です。 MT5のWAPV価格および出来高インジケーターは、チャート上の出来高の動きを直感的な方法で簡単に視覚化できるように作成されました。 それを使用すると、ピークボリュームの瞬間と市場が専門家の関心を持たない瞬間を観察することができます 「スマートマネー」の動きではなく、慣性によって市場が動いている瞬間を特定します。 ユーザーが変更できる4色で構成されています。 赤=オファーの増加 緑=需要の増加 灰色のキャンドル=需要と供給の減少 青=スマートマネー演技 上方向への動きは強さを示します。 下向きの動き弱さを示します。 価格の方向に関係なく、最強のボリュームが上がる必要があります。 R.Wyckoffの理論に基づいて作成されたインジケーター


The WAPV ADH Supply and Demand Forex Indicator is part of a set of Indicators called (Wyckoff Academy Wave Market) The WAPV ADH Forex Supply and Demand Indicator for MT5 is intended to identify the winning side between buyers and sellers. Its reading is very simple, when the green line is above the red line demand is in command, when the red line is above the green line supply is in command. The more positive the green and red lines, the higher the volume input, the closer to zero or negative, t

The Weis Wave Bouble Side Indicator for MT5 is part of the toolkit (Wyckoff Academy Wave Market) The Weis Wave Bouble side Indicator for MT5 was created based on the already established Weis Wave created by David Weis. The Weis Wave Double Side indicator reads the market in waves as it was done by R. Wyckoff in 1900. It helps in the identification of effort x result, cause and effect, and Supply and demand Its differential is that it can be used below the zero axis, further improving plus operat

The Weis Wave Bouble Side Indicator for MT5 is part of the toolkit (Wyckoff Academy Wave Market) The Weis Wave Bouble side Indicator for MT5 was created based on the already established Weis Wave created by David Weis. The Weis Wave Double Side indicator reads the market in waves as R. Wyckoff did in 1900. It helps in the identification of effort x result, cause and effect, and Supply and demand Its differential is that it can be used below the zero axis and has a breakout alert showing Who is s
The VSA Candle Signal for MT5 is part of the toolset (Wyckoff Academy Price and Volume). Its function is to identify the correlation of Price and Volume in the formation of the candle. Its creation is based on the premises of R.Wyckoff , a precursor in the analysis of Price and Volume. VSA Candle Signal for MT5 assists in decision making, leaving your reading clearer and more fluid. See the images below.

The Force and Weakness Indicator for MT5 Real Volume is part of the (Wyckoff Academy Price and Volume) toolset The Force and Weakness Indicator for MT5 Real Volume was developed to identify the Strength and Weakness of volume in an accumulated way. Enabling the vision of a panorama between price and volume. The Indicator can be used as an oscillator and as a histogram. As a fantasy it has all the premises of R. Wyckoff's three laws when put together with the price: Cause and Effect, Effort x Res

The Force and Weakness Indicator for MT5 Forex is part of the (Wyckoff Academy Price and Volume) Toolkit The Force and Weakness Indicator for MT5 Forex was developed to identify the Strength and Weakness of volume in an accumulated way. Enabling the vision of a panorama between price and volume. The Indicator can be used as an oscillator and as a histogram. As usual it has all the premises of R. Wyckoff's three laws when put together with the price: Cause and Effect, Effort x Result and Supply a

Ichimoku Trend Finder is a multi symbol multi timeframe trend dashboard that helps traders to monitor and identify potential market trends from one chart. This panel scans the Ichimoku Kinko Hyo indicator in 28 configurable instruments and 9 timeframes for classic Ichimoku trend signals with a deep scan feature to scan all market watch symbols (up to 1000 instruments!).
Download Demo here (Scans only M2 and M10) Settings description here MT4 version here
After the purchase, don't for
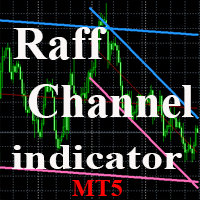
The indicator plots a trend channel using the technique by Gilbert Raff. The channel axis is a first-order regression. The upper and lower lines show the maximum distance the Close line had moved away from the axis line. Therefore, the upper and lower lines can be considered as resistance and support lines, respectively. A similar version of the indicator for the MT4 terminal
As a rule, most movements of the price occur within a channel, going beyond the support or resistance line only for a sh
FREE

The idea of a Value Chart indicator was presented in the very good book I read back in 2020 , " Dynamic Trading Indicators: Winning with Value Charts and Price Action Profile ", from the authors Mark Helweg and David Stendahl. The idea is simple and the result is pure genius: Present candlestick Price analysis in a detrended way!
HOW TO READ THIS INDICATOR
Look for Overbought and Oversold levels. Of course, you will need to test the settings a lot to find the "correct" one for your approach. It
FREE

John Bollinger created this indicator in 2010 as a way to read the original indicator (Bollinger Bands) in a more "technical" way, shown as an oscillator. The typical range of the Bollinger Bands %B is 0 - 0.5 - 1.0, where "0" represents the lower band, the "0.5" the middle band, and "1" the upper band. The line on the indicator represents the Closing prices. As simple as that.
SETTINGS
Bollinger Bands period of analysis Standard Deviation multiplier Shift Price type to be analyzed
If you like
FREE
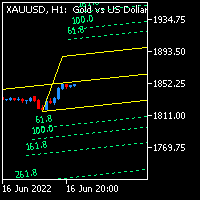
Andrew Pitch fork is one of the most interesting string trend & Channel & Fibo technical analysis , it's like ALL in ONE tool would be very enough for you.
Using 2 Andrew pitch Forks with 2 different time frames on same chart is really very hard working and might be impossible , but with this indicator is possible now , moreover , using this method as Candle Volume based analysis give strong trust for your trade.
I assume if you are having 1 daily pith fork lets say with 22 Candle value , and
FREE
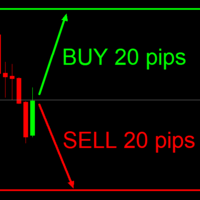
This indicator is very useful for day traders or short term traders. (MT5 version) No need to calculate the number of pips manually, just look at the chart and you will see the Virtual Take Profit / Virtual Stop Loss target line and evaluate whether the entry point is feasible to reach the intended target or not.
Enter the intended Take Profit / Stop Loss pips for your trade. The indicator will display Virtual Take Profit / Virtual Stop Loss lines for you to easily see if the target is
FREE

Investment Castle Spots — Candlestick Patterns, Spotted for You
The Spots Indicator watches for the candlestick patterns traders rely on — engulfing, hanging man, doji and more — and marks them on your chart for cleaner entries and exits.
What it does for you Key patterns detected: engulfing, hanging man, doji and other classic candlestick signals. Entry & exit help: use the patterns to time your trades with more confidence. On-chart and clear: no manual pattern-hunting candle by candle. Works
FREE

Very powerful indicator! converted from TradingView with upgraded alerts and added notifications. Ideal use in EAs.
Use as a supplementary Indicator to confirm your entries, but it is as good on it's own.
The indicator consists of 3 different Trend Meters and a 2 Trend Bars which are used to confirm trend
How to Use:
The more Trend meters are lit up the better =>>
-more GREEN COLOR at one bar means more confirmation to open buy trade,
- more RED COLOR signals for one bar = more confirmat

A ideia do indicador é mudar de cores assim que o candle viole a banda; Caso o candle viole a banda superior, pinta o candle de vermelho, Caso o candle viole a banda inferior , pinta o candle de verde, Se o candle passar em algum momento pela média, ele assume uma cor acinzentada; Os candles que não passem pela média, nem violem a banda, apresentarão cor verde fraca, se for de alta e cor vermelha fraca se for de baixa. Projeto concebido no canal Aprenda a programar, keltner cores.
FREE
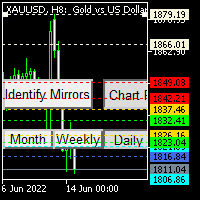
I always wondered if I can have multiple time frame Moving average on same chart , it is not possible , now with my Indicator is possible , As you know Moving average is lagging not leading indicator , but how can I predict future levels of it ?
I came with this idea , I hope you will like it , I made a Mirror of Moving average , the other side of specific time will be shown in the other side of the chart where the price didnt reach yet , that will help you to know the levels you can start sell
FREE
MetaTraderマーケットは、履歴データを使ったテストと最適化のための無料のデモ自動売買ロボットをダウンロードできる唯一のストアです。
アプリ概要と他のカスタマーからのレビューをご覧になり、ターミナルにダウンロードし、購入する前に自動売買ロボットをテストしてください。完全に無料でアプリをテストできるのはMetaTraderマーケットだけです。

取引の機会を逃しています。
- 無料取引アプリ
- 8千を超えるシグナルをコピー
- 金融ニュースで金融マーケットを探索