 MetaTrader 5
 エキスパート
 インディケータ
 ライブラリ
ライブラリ
 ユーティリティ
 ウィジェット
 ルール
ルール
YouTubeにあるマーケットチュートリアルビデオをご覧ください
ロボットや指標を購入する
仮想ホスティングで
EAを実行
EAを実行
ロボットや指標を購入前にテストする
マーケットで収入を得る
販売のためにプロダクトをプレゼンテーションする方法
MetaTrader 5のための新しいテクニカル指標 - 204
 テクニカル指標からのシグナルは、株式および外国為替市場での取引の開始と終了に重要な役割を果たします。指標の本質は、将来の価格変動を予測することを目的とした金融銘柄価格の数学的変換です。
テクニカル指標をテストして、市場の動きとそれからの利益をより正確に予測します。
テクニカル指標からのシグナルは、株式および外国為替市場での取引の開始と終了に重要な役割を果たします。指標の本質は、将来の価格変動を予測することを目的とした金融銘柄価格の数学的変換です。
テクニカル指標をテストして、市場の動きとそれからの利益をより正確に予測します。 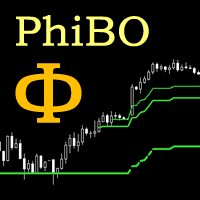
Indicador PHIBO da metodologia PhiCube. Se comporta exatamente como o utilizado pelo Bo Williams em seus videos e estratégias. Quando o preço está sobre, ou abaixo, das três linhas, isso indica que há uma forte tendência. Quando não estão alinhadas, podem indicar suportes, resistências e alvos. Se aparecerem após um longo movimento já esticado, podem indicar que o movimento está terminando.

CPA - "Candle Pattern Analyze" - Индикатор поиска и анализа свечных моделей. Индикатор осуществляет поиск наиболее ликвидных свечных моделей, а так же производит анализ истории, как развивалась цена в прошлом. Внимание! В тестере стратегий индикатор показывает только свечные модели. Линии возможного движения, формируются на истории, и показываются только в терминале (естественно при условии наличия истории выбранного интервала). Настройки индикатора по умолчанию - минимальны, то есть, перед испо
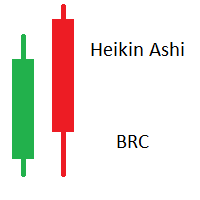
Heikin Ashi (HA) is a type of candlestick chart originated in Japan. The difference from traditional candlesticks is that HA bars are averaged, creating a smoother appearence. HA doesn't show the exact open and close price, they should be used as Technical Indicator and not as exact market prices. Calculation: HA Open = (Open of previous bar + Close of previous bar) / 2 HA Close = (Open + High + Low + Close) / 4 HA High = Highest of High, HA Open, or HA Close HA Low = Lowest of Low, HA Open, or

Are you tired of drawing Support & Resistance levels for your Quotes? Are you learning how to spot Support & Resistances? No matter what is your case, Auto Support & Resistances will draw those levels for you! AND, it can draw them from other timeframes, right into you current chart, no matter what timeframe you are using... You can also Agglutinate regions/zones that are too much closer to each other and turning them into one single Support & Resistance Level. All configurable.
SETTINGS
Timefr
FREE

Стратегия форекс «Гора» основана на одном довольно сложном индикаторе. С его помощью генерируются вполне неплохие сигналы и, в принципе, автор указывал возможность торговли и на остальных инструментах, однако, мы решили взять изначальный вариант — торговлю только по GBP/USD. Так же следует сказать, что по ходу развития тренда торговая стратегия пропускает большое количество неплохих точек входа, но это только на первый взгляд. Фильтрация сигналов показала себя достаточно неплохо и в итоге торгов
FREE
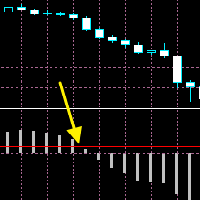
The moment when the MACD line crosses the signal line often leads to a significant price movement and trend changes. MACD Cross Prediction is an indicator that uses OSMA(MACD oscillator) and a red line. You can change the level of the red line on the indicator setting popup(and the red line moves up and down). The alerts(email, mobile push, sound, MT5 alert) will be sent when the MACD histogram touches the red line, which means the alerts can be sent just before/around the time when the MACD

非常に頻繁に、トレーダーは価格が近い将来に変化する可能性がある範囲を決定するという課題に直面しています。この目的のために、ジョンソン分布タイプSBを使用することができます。この配布の主な利点は、少量の累積データでも使用できることです。この分布のパラメータを決定する際に使用される経験的アプローチにより、価格チャネルの最大レベルと最小レベルを正確に決定することができます。 これらの値はさまざまな状況で使用できます。たとえば、マーケットオーダーのストップロスやテイクプロフィットレベル、未決注文のエントリーポイントを設定するために使用できます。また、これらのレベルはトレーリングストップを使用するときに方向付けることができます。さらに、十分に大きい履歴では、インディケータは上昇トレンドまたは下降トレンドの始まりを知らせることができます。そのような傾向があったならばまあ、またはその終わりについて。 この指標の主な不利な点は、価格の排出に対する極めて高い感度と、市場の状況の変化に対する反応がやや遅いことです。 青と赤の線は、それぞれ価格チャネルの最大値と最小値を示しています。緑色の線は、特定の市場
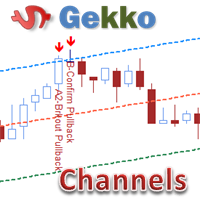
This is Gekko's Channels Plus indicator. It extends the use of the famous Channels and calculates strong entry and exit signals using price action on the top, bottom and middle lines. You can set it up in many different ways, eg: pullback, pullback against trend, middle line crossing and middle line crossing against trend. Inputs Number of Bars to Plot Indicator: number of historical bars to plot the indicator, keep it low for better performance; Produces Signal Only When a Bar Closes: wait fo
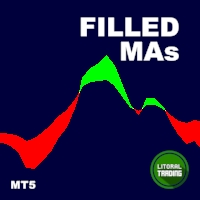
Are you a trend surfer like us? Do you use Moving Averages too? Ever wanted the are between them to be painted? Yeah, we solved this problem with the Filled MAs indicator! It is very simple, just puts two fully customizable Moving Averages on chart and fill the space between them, changing the color as they intersect. Thanks to gmbraz for the version 1.1 idea. Any questions os suggestions please contact me! Enjoy!
This is a free indicator, but it took hours to develop. If you want to pay me a
FREE

The volume weighted average price (VWAP) is a trading benchmark used by traders that gives the average price a security has traded at throughout the day, based on both volume and price. It is important because it provides traders with insight into both the trend and value of a security. This version is simple to use as we simplify the indicator entries and leave only the most used buffers. You can use it to integrate with your EA Product Features Daily VWAP ploted at the chart. MOnthly
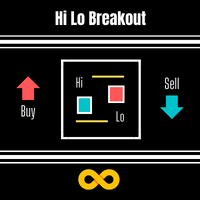
The Hi Lo Breakout is taken from the concept of the ZZ Scalper EA which exploits the inevitable behaviour of price fluctuations and breakouts. The fact that because market prices will always fluctuate to higher highs before ebbing down to lower lows, breakouts will occur.
But here I've added a few more filters which I see work well also as an Indicator.
Range Analysis : When price is within a tight range this Indicator will be able to spot this and only then look for price breaks. You
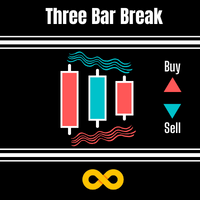
Three Bar Break is based on one of Linda Bradford Raschke's trading methods that I have noticed is good at spotting potential future price volatility. It looks for when the 1st bar's High is less than the 3rd bar's High as well as the 1st bar's Low to be higher than the 3rd bar's Low. This then predicts the market might breakout to new levels within 2-3 of the next coming bars. It should be used mainly on the daily chart to help spot potential moves in the coming days. Features :
A simple meth
FREE
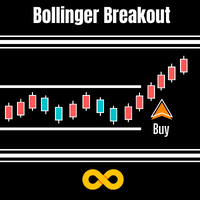
Bollinger Breakout Trader tells the trader when the market is about to breakout from a non-volatile period. Non volatility usually means its building up steam for more good moves in future. A signal is formed when this switch from non-volatile to volatile occurs. These periods are measured by both Bollinger Bands and Keltner Channels. Bollinger Bands measure the standard deviation of price from the Moving Average which results in an expanding and contracting channel. Keltner Channels are based

TPA True Price Action indicator reveals the true price action of the market makers through 100% non-repainting signals strictly at the close of a candle!
TPA shows entries and re-entries, every time the bulls are definitely stronger than the bears and vice versa. Not to confuse with red/green candles. The shift of power gets confirmed at the earliest stage and is ONE exit strategy of several. There are available now two free parts of the TPA User Guide for our customers. The first "The Basics"

KEY LINKS: Indicator Manual – How to Install – Frequent Questions - All Products Description: Indicator which uses trend, breakout and reversal innovative indicators to show a complete visual trading strategy, with transparent metrics. It follows simple visual patterns, which will improve your trading significantly. Support: We create great tools for the entire trading community. Most of them are free. If you believe in what we do Support Us Here.
Outstanding Features Shows current
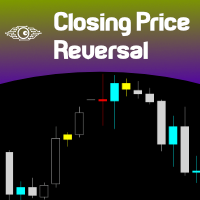
Closing Price Reversal is a very well known and traded candlestick pattern. This little indicator paints with specific (user-selected) colors the Closing Price Reveral Up and Down patterns, as well as the Inside Bars (as a bonus). Higher timeframes are more effective as with all other candlesticks patterns. Do NOT trade solely on this indicator. Search the web for "Closing Price Reversal" to learn about the several approaches that can be used with this pattern. One of them is combining short/me
FREE
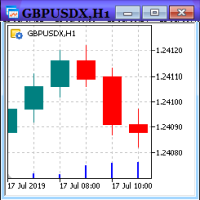
Индикатор CustomIndexCreator позволяет создавать свой собственный пользовательский символ на основе истории любого финансового инструмента и подкачивать его ценовую историю в виде минутных баров. Таким образом, в клиентском терминале Metatrader 5 появляется новый символ, с которым можно работать по аналогии с другими финансовыми инструментами, то есть открывать полноценные графики любого таймфрейма этого символа и проводить технический анализ, располагая на этих графиках любые технические и
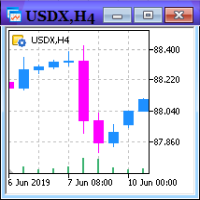
CustomMultyIndexCreator позволяет создавать свой собственный мультивалютный пользовательский символ на основе истории корзины любых финансовых инструментов как среднее геометрическое взвешенное этой валютной корзины и подкачивать его ценовую историю в виде минутных баров. Таким образом, в клиентском терминале Metatrader 5 появляется новый символ, с которым можно работать по аналогии с другими финансовыми инструментами, то есть открывать полноценные графики любого таймфрейма этого символа и про
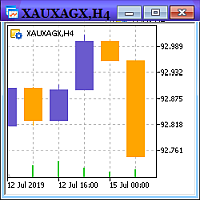
Индикатор CustomCrossIndexCreator позволяет создавать свой собственный пользовательский символ на основе истории двух любых финансовых инструментов как произведение этих двух индексов (кросс-индекс) и подкачивать его ценовую историю в виде минутных баров. Таким образом, в клиентском терминале Metatrader 5 появляется новый символ, с которым можно работать по аналогии с другими финансовыми инструментами, то есть открывать полноценные графики любого таймфрейма этого символа и проводить технически
マルチタイムフレーム対応、カスタマイズ可能なビジュアルシグナル、設定可能なアラートシステムを備えたAverage Directional Movement Index(ADX)インジケーター。
フリーランスプログラミングサービス、アップデート、その他のTrueTL製品は私の MQL5プロフィール からご利用いただけます。
フィードバックとレビューを大歓迎します!
ADXとは? Average Directional Movement Index(ADX)は、J. Welles Wilderが開発した技術的指標で、方向性に関係なくトレンドの強さを測定するために使用されます。ADXはポジティブ方向指標(+DI)とネガティブ方向指標(-DI)から導出されますが、トレンドの方向ではなく強さのみを示します。 ADX値は0から100の範囲です。一般的に、20〜25未満の値は弱いまたは存在しないトレンド(レンジ相場)を示し、25を超える値は強いトレンドを示します。50を超える値は非常に強いトレンドを示します。ADXは市場がトレンド中かレンジ中かを識別するのに特に役立ち、トレーダーがトレンドフォ
FREE
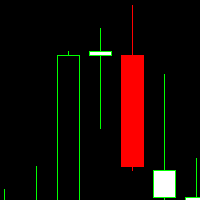
This indicator is a volume indicator it changes the color of the candles according to a certain number of ticks, and this number of ticks can be informed by the user both the number of ticks and the color of the candles, this indicator works in any graphical time or any asset, provided that the asset has a ticker number to be informed.
This indicator seeks to facilitate user viewing when analyzing candles with a certain number of ticks.
FREE

Aggression Volume Indicator is the kind of indicator that is rarely found in the MQL5 community because it is not based on the standard Volume data provided by the Metatrader 5 platform. It requires the scrutiny of all traffic Ticks requested on the platform... That said, Aggression Volume indicator requests all Tick Data from your Broker and processes it to build a very special version of a Volume Indicator, where Buyers and Sellers aggressions are plotted in a form of Histogram. Additionally,
FREE
This indicator shows price changes for the same days in the past. This is a predictor that finds bars for the same days in past N years, quarters, months, weeks, or days (N is 10 by default) and shows their relative price changes on the current chart. Number of displayed buffers and historical time series for comparison is limited to 10, but indicator can process more past periods if averaging mode is enabled (ShowAverage is true) - just specify required number in the LookBack parameter. Paramet
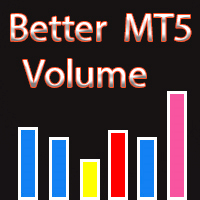
Description: The indicator of tick volumes Better Volume MT5 allows you to assess the general mood of the market and quite accurately catch the moments of the formation of large movements. The indicator is a color histogram in an additional window. In the calculation of Better Volume MT5 the Price Action combinations are taken into account, the values of the volumes with the height of columns and color marking are displayed. Input parameters: MAPeriod - period for calculating the moving average

Dear friends
This is an indicator brings two moving averages configurable and will emit sound and alert, depending on your choice, when they cross.
Very useful for those who used to operate multiple times or active at the same time.
With the indicator set it will warn you where the crossing occurred.
If you desire some personal indicator please fell free to get in touch.
Good Trades Jairo Elias
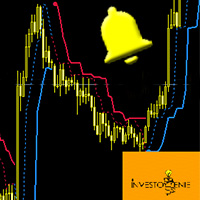
PRICE BREAKOUT ALERT!!!! PRICE BREAKOUT ALERT!!!
Now you dont have to worry about going through each currency pair, your favorite stocks watch list or crypto to find breakouts. This indicator does everything for you.
This indicator has the capability to SCAN different CURRENCY PAIRS and TIMEFRAMES to give you breakout information through ALERT (MOBILE NOTIFICATION, EMAIL AND PUSH NOTIFICATION)
NOTE: If you are willing to scan more currency pairs along with many timeframes, you need
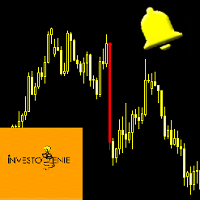
THRUST BAR ALERT!!!! THRUST BAR ALERT!!!
Now you dont have to worry about going through each currency pair, your favorite stocks watch list or crypto to find BIG CANDLES (also called THRUST BARS ). This indicator does everything for you.
This indicator has the capability to SCAN different CURRENCY PAIRS and TIMEFRAMES to give you BIG CANDLE (THRUST BAR) information through ALERT (MOBILE NOTIFICATION, EMAIL AND PUSH NOTIFICATION)
NOTE: If you are willing to scan more currency pairs
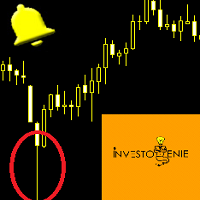
WICK BAR ALERT!!!! WICK BAR ALERT!!!
Now you dont have to worry about going through each currency pair, your favorite stocks watch list or crypto to find WICK BAR CANDLES (also called LONG TAIL BARS ). This indicator does everything for you.
This indicator has the capability to SCAN different CURRENCY PAIRS and TIMEFRAMES to give you LONG TAIL CANDLE (LONG WICK BAR) information through ALERT (MOBILE NOTIFICATION, EMAIL AND PUSH NOTIFICATION)
NOTE: If you are willing to scan m
強力な分析方法の1つは、Levyプロセスを使用した金融シリーズのモデリングです。これらのプロセスの主な利点は、最も単純なものから最も複雑なものまで、膨大な数の現象をモデル化するために使用できることです。市場におけるフラクタルな価格変動の考えは、レヴィ過程の特別な場合にすぎないと言えば十分でしょう。一方、パラメータを適切に選択すると、どのLevyプロセスも単純な移動平均として表すことができます。図1は、フラグメントを数倍に拡大したLevyプロセスの例を示しています。 価格チャートを滑らかにするためにLevyプロセスを使用する可能性を考えてみましょう。まず、線形プロセスをシミュレートするために使用できるように、Levyプロセスのパラメータを選択する必要があります。それから、異なる符号の係数を含む重みのシステムを得ます。このおかげで、私たちは財務範囲を平準化するだけでなく、そこに存在する反トレンドと定期的な要素を追跡することもできるでしょう。 インジケータの動作は、パラメータ LF を選択することによって設定されます。分析されるストーリーの深さを決定します。このパラメーターの許容値は、0か
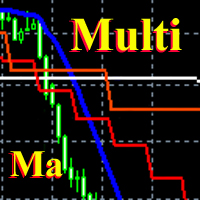
This is the same Ma Multi indicator that was previously available only for Mt4 . Now there is a version for Mt5 . It belongs to a whole family of multi-frame indicators, implementing the idea of displaying different timeframes in a single time scale. Horizontal fixation the scale allows one glance to get the big picture and provides additional opportunities for technical analysis. The indicator is tested on Just2trade Indicator parameters: MA_Period - averaging period of the moving av
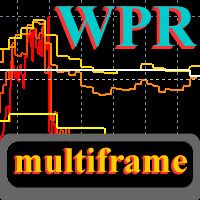
This is a multi-frame version of the standard indicator " Williams Percent Range ", that was previously available only for Mt4 . Now there is a version for Mt5 . Like the other indicators of the author, it allows you to see any set of timeframes at the same time, and all they will be presented on a scale of the current price chart. You can choose any set of timeframes of the indicator and freely switch to the price chart in both the highter and the lower direction. For each price period, indi

The Volume Average Indicator plots an adjustable average mathed by the ON-BALANCE-VOLUME. You can use to see the volume points where the market works in favor to your trades, based on volume/price. It works at all timeframes and instruments.
Product Features Volume Average ploted at the chart. Indicator Parameters VOL Ema - Set the EMA vol períod you want work with.

PINBAR SCANNER PRO with TREND and RSI + CCI OSCILLATORS filter This indicator has been designed to automatically and constantly scan entire market to find high probability pinbar formations, so you can just wait for the perfect trading opportunity come to you automatically.
PINBAR is the strongest candle reversal pattern known in technical analysis. It shows excellent areas to determine potential entries and exits with opportunity to use excellent risk and reward ratios. It includes an RSI and
FREE

Определения текущей тенденции одна из самых важных задач трейдера не зависимо от стиля торговли. Индикатор Quantum Trend Volume поможет с достаточно высокой вероятностью это сделать. Quantum Trend Volume - индикатор распознавания тенденции, использующий авторский алгоритм расчета. Показания индикатора не изменяются не при каких условиях. В качестве дополнительной фильтрации используются тиковые объемы. Индикатор подходит для любой валютной пары, любого таймфрейма, также его можно применять в
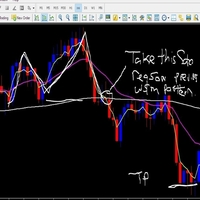
About. This indicator is the combination of 3 Exponential Moving averages, 3,13 and 144. it features Taking trades in the direction of trend, and also helps the trade to spot early trend change through Small moving averages crossing Big Moving averages Product features 1. Have built in Notification system to be set as the user desires (Alerts, Popup notification and Push Notification to Mobile devices) so with notification on, you do not need to be at home, or glued to the computer, only set and
FREE
長期の非ランダム成分を分離するためには、価格がどれだけ変化したのかだけでなく、これらの変化がどのように発生したのかも知る必要があります。言い換えれば - 私たちは価格レベルの値だけでなく、これらのレベルが互いに置き換わる順序にも興味があります。このアプローチを通して、ある時点での価格変動に影響を与える(または影響を与える可能性がある)長期的で安定した要因を見つけることができます。そしてこれらの要因の知識はあなたが多かれ少なかれ正確な予測をすることを可能にします。 金融系列の分析からどの程度具体的な結果を得たいのかを判断しましょう。 •まず、トレンドが市場に存在する場合は、そのトレンドを強調する必要があります。 •次に、定期的な要素を特定する必要があります。 •第三に、結果は予測に使用するのに十分安定しているべきである。 •そして最後に、私たちの分析方法は現在の市場の状況に適応するはずです。 指定された条件を満たすために、相対的な価格変動の回帰分析を使用し、このモデルに基づいて指標を作ります。この指標のアルゴリズムは履歴データからの学習に基づいており、その作業はトレーダーの完全な管理下
非常に頻繁に、金融シリーズの研究でそれらの平滑化を適用します。平滑化を使用すると、高周波成分を除去することができます - それらはランダムな要因によって引き起こされているため、無関係であると考えられています。平滑化には常に、データを平均化する何らかの方法が含まれます。この方法では、時系列のランダムな変化が相互に吸収します。ほとんどの場合、この目的のために、指数平滑法と同様に単純または加重移動平均法が使用されます。 これらの方法にはそれぞれ、長所と短所があります。したがって、単純な移動平均は単純で直感的ですが、その適用には時系列の周期成分と傾向成分の相対的な安定性が必要です。さらに、信号遅延は移動平均の特性です。指数平滑法はラグ効果がありません。しかし、ここでも欠陥があります - 指数平滑化は、系列をランダムな異常値と整列させる場合にのみ有効です。 単純平均と指数平均の間の妥当な妥協点は、加重移動平均の使用です。しかしながら、特定の重量値を選ぶという問題がある。これをまとめてみましょう。 それで、最初に私達が平滑化手順から達成したいことを定義します: •まず、価格系列からランダムな
This LEGIT Indicator Can Accurately Predict the Outcome of One Bar.
Imagine adding more filters to further increase your probability!
Unlike other products, Binary Options PRO can analyze past signals giving you the statistical edge.
How Increase Your Probability
Information revealed here www.mql5.com/en/blogs/post/727038 NOTE: The selection of a Good Broker is important for the overall success in trading Binary Options.
Benefits You Get
Unique algorithm that anticipates price weakness. Gene
Ace Supply Demand Zone Indicator The concept of supply demand relies on the quantity mismatching between buying and selling volumes in the financial market. Supply and demand zone can provide the good entry and exit. A zone is easier to trade than a line. The supply demand zone can provide the detailed trading plan and the risk management. Its ability to predict market direction is high. There are two distinctive points about Ace Supply Demand Zone Indicator. Ace Supply Demand Zone indicator was
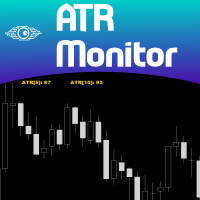
ATR is a measure of volatility introduced by market technician J. Welles Wilder Jr. in his book, "New Concepts in Technical Trading Systems". In general, traders are accustomed to seeing the ATR in the form of a sub-window indicator. What I am presenting here is a simplified version of ATR - just the current ATR number - very useful for monitoring just the very moment of the current chart. If you want to monitor several timeframes in the same chart, just add the ATR Monitor indicator several tim
FREE

Automatic MIDAS positioning, the indicator allows the placement of two MIDAS, each one have 3 lines that can be calculated using Open/High/Low/Close/Median/Typical or Weighted prices, you can attach each MIDAS to the Open/High/Low or Close bars of any day, including the current day, once attached, if the price of this bar changes or you change the time frame, the indicator will do the repositioning and recalculation. You can also do a manual repositioning of the two MIDAS by moving its start lab
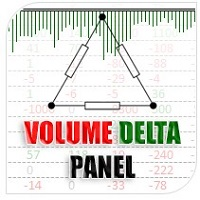
Volume Delta Panel is a very powerful indicator that read the supply on Market. It calculates the Delta from movement of the price and the difference of BUY volumes and SELL volumes. The Volumes are added to price and normalized to symbol points.
Its special structure allows you to get all Time Frames values available on the platform MT5. Panel can show 50 instruments simultaneously all customizable according to the offer of the Broker. A good observation of this instrument can suggest great e

This indicator represent option and basis values as a tax, using this formula: Tax = ( ( strike / ( basis - option ) ) - 1 ) * 100 It's not time based (don't use time to expire information) You can set a fixed strike value, and a fixed basis symbol if needed. Some exchanges/brokers don't provide this information at marketdata and that's the only method to use this information when not provided.
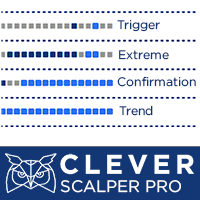
Description Very robust and powerful indicator, which allows through its 4 components, trade the market in trend or not trending conditions. it based on a very reliable trading strategy and gives you all you need to be succesful in trading. KEY LINKS: Indicator Manual – How to Install – Frequent Questions - All Products How is Clever Scalper Pro useful to you? A complete and reliable trading strategy. Easy to understand and trade Allow to identify trend, confirm it, look for retraceme

この指標はより有益です。彼の研究は、市場における価格の動きが特定の色のノイズとして表現されるという仮定に基づいており、それは価格値の分布のパラメータに依存します。これにより、さまざまな角度から価格変動を分析することができ、価格変動を特定の色のノイズと見なして、市場の現在の状況に関する情報を入手し、価格の動向に関する予測を行うことができます。 インディケータの読みを分析するとき、インディケータラインの位置は考慮に入れられます - それらは現在のバーの始値の上下にそしてそれからどれだけ離れて位置しています。 ホワイトノイズ(White Noise) - このアプローチは、価格(現在と先史時代の両方)が電力で等しいと考えられているという事実によって特徴付けられ、それはそれを単純な移動平均と組み合わせます。ホワイトノイズ信号は、文字を確認している可能性が高く、現在の価格から逸脱するほど、市場のトレンドの動きが強くなります。逆に、ホワイトノイズラインが始値に近い場合、これはトレンドの終わりまたは横方向の価格変動のいずれかの証拠です。 フリッカーノイズ(Flicker Noise)はトレンドの上

「 AIS Color Noise Filter 」指標のいくつかの欠点にもかかわらず、それを使用して価格系列と予測価格を平滑化するという考えは非常に魅力的に見えます。 これはいくつかの理由によるものです。 第一に、いくつかのノイズ成分を考慮に入れることは、互いに独立した要因について予測を構築することを可能にし、それは予測の質を改善することができる。 第二に、価格系列の雑音特性は全履歴を通して非常に安定して振舞い、それは安定した結果を得ることを可能にする。 そして最後に、ノイズの変動性により、予測システムが非常に敏感になり、価格の変化に対する反応が非常に速くなることを期待できます。 その結果、すべての単純化にもかかわらず、価格が移動するチャネルを正確に予測できるという指標が得られました。この指標の主な利点は、その高速さと習得の容易さです。主な不利点は、指標が予測に最も重要な要素を選択できないことです。 LH は、予測が行われる履歴データの長さを設定するパラメータです。その許容値は0から255ですが、標識が処理する小節の数はこのパラメーターで指定された数より1単位以上多いです。

Description Very precise patterns to detect: entry signals as well as breakout, support and resistance reversal patterns. It points out zones in which, with a high probability, institutional orders with the potential to change the price’s direction and keep moving towards it, have been placed. Support: We create great tools for the entire trading community. Most of them are free. If you believe in what we do Support Us Here. KEY LINKS: Indicator Manual - All Products
How is this indi
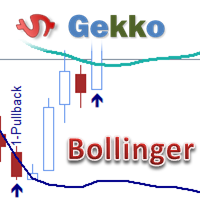
This is Gekko's Bollinger Bands indicator. It extends the use of the famous Bollinger Bands and calculates strong entry and exit signals using price action on the edge and on the middle bands. You can set it up in many different ways, eg: pullback, pullback against trend, middle band crossing and middle band crossing against trend. Inputs Number of Bars to Plot Indicator: number of historical bars to plot the indicator, keep it low for better performance; Produces Signal Only When a Bar Closes:

Intraday Volume Profile analyze short-term information about price and volume, help you visualize the movement of price and volume. In short-term trading on Forex, usually use 5-, 15-, 30-, 60-minute and etc. intraday charts when trading on a market day. It is possible to use as an additional tool for intraday scalping .
The volume profile provides an excellent visual image of supply / demand for each price for the selected timeframe. Representing the Point of Control ( POC ), which indicates

Session Volume Profile is an advanced graphical representation that displays trading activity during Forex trading sessions at specified price levels. The Forex market can be divided into four main trading sessions: the Australian session, the Asian session, the European session and the favorite trading time - the American (US) session. POC - profile can be used as a support and resistance level for intraday trading.
VWAP - Volume Weighted Average Price.
ATTENTION ! For the indicator to w
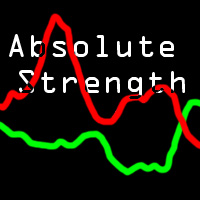
The Absolute Strength (AS) is intended to chart the current and historical gain or loss of an underlying based on the closing prices of a recent trading period. It is based on mathematical decorrelation. It shows absolute strength momentum.
This indicator is not measured on a scale like Relative Strength (RSI). Shorter or longer timeframes are used for alternately shorter or longer outlooks. Extreme high and low percentage values occur less frequently but indicate stronger momentum of the und
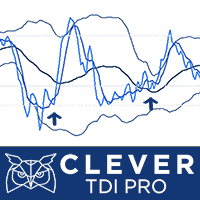
Description: The indicator shows the TDI indicator in a separate window, and with the RSI component, the indicator finds possible divergences with M or W patterns. KEY LINKS: How to Install – Frequent Questions - All Products Functions: Finds Market Makers patterns. Finds extremes or exhaustion into the market. Looks for a trend continuation. Content: TDI Indicator Divergence and M or W Signals Note 1: This indicator should only be considered as a part of any trading strategy. You shoul
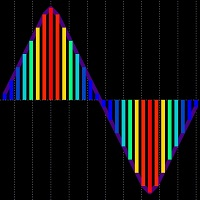
Markets Heat indicator can help you determine correct course of action at current market situation, by calculating market's "heat level". What is market's "heat level"? Well, it's my own way of simplifying complex market conditions to ease decision-making process. How does it work? Most of time market is moving in some narrow range and can't "decide" where to go -> flat market -> cold market. Other times, price goes Up or Down -> making trend movements -> heating the market. More powerful trends

A scalping indicator based on mathematical patterns, which on average gives signals with relatively small SL, and also occasionally helps to catch big moves in the markets (more information in the video)
This indicator has three main types of notifications: The first type warns of a possible/upcoming signal on the next bar The second type indicates the presence of a ready signal to enter the market/open a position The third type is for SL and TP levels - you will be notified every time price re
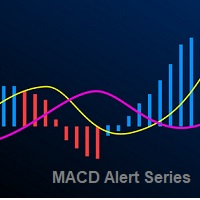
The Moving Average Convergence Divergence Indicator (MACD) is both a trend–seeking and momentum indicator which uses several exponential moving averages set to closing prices to generate trading signals. We added many types of alerts plus the Delay Cross Filter to aid in your search for better opportunities in the market.
Product Features Sound alert Push Notification (Alerts can be sent to your mobile phone) Signs on chart Alert box Alert on zero histogram cross or line sign cross. DelayCross

[ZhiBi Dragon]は、振動の原理に基づいています。これは、市場の水平配置とトレンドフォームを予測してから、マーケットフォームに応じた注文シグナル、およびシグナルの確率とトレンドの品質を示すことができます。 緑、赤、水緑の3本の細い線が上に黄色線を通すのは上向きの傾向で、この3本の細い線が下に黄色線を通すのは下向きの傾向です。 信号の確率は、25%、50%、75%の3つのレベルに分けられ、確率が高いほど精度が高くなります。 (買いは請求書を支払うシグナル、売りは注文を売るシグナルです。トップはトップに達する可能性があり、市場は下降する可能性があります。ローは下の部分に達する可能性があり、市場は上昇する可能性があります)。 信号の品質は、30%または70%の2つのレベルに分けられ、品質が高いほど精度が高くなります。 (上向きは上昇トレンド、下向きは下降トレンド、Caution!は市場の水平方向の調整) パラメータ設定: [Waves]は揺らぎの範囲で、値が大きいほど安定しており、値が小さいほど積極的ですので、20〜60の間で設定することをお勧めします。 [WinAlerts]ポ
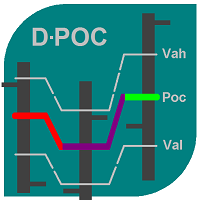
The indicator calculates volume profiles dynamically and displays the result as VAL, VAH and POC curves.
Indicator features The indicator uses the historical data of the lower (relative to the current) timeframes for calculations: M1 - for timeframes up to H1, M5 - for timeframe H1, M15 - for timeframe H4, H1 - for timeframe D1, H4 - for timeframe W1, D1 - for timeframe MN. The color of the DPOC curve sections is determined by comparing the volume of the POC levels of all profiles that make up

RoundNumbers indicator is a simple and powerful psychological price levels. Trader usually use these levels as a Support and Resistance (SnR). Indicator Input: Levels - Numbers of levels drawn on chart. Default 30 levels. BoxSize - Box size drawn on each levels, indicate buffers around levels. Default value 1pips (10point) above and below each levels. ZoneSize - Distance between each levels, default value 10pips (100point). Style & Colours - User inputs customization. For MT4 version, p
FREE
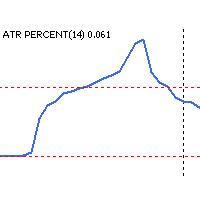
ATR is an excellent indicator to visualize if volatility is increasing or decreasing. But what if you want to compare the volatility to another pair or instrument? Since each pair with different quote currency has different pip value, the output of the ATR doesn't really say that much. Comparing pairs to other instruments is even harder. What you as a trader care about is how much the pair has moved up or down in percentage, therefore normalizing ATR to percent would make things much easier. T
FREE
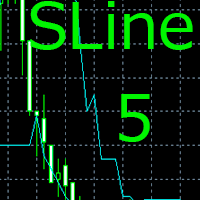
Данный индикатор помогает трейдеру выявить импульс цены,а также рассчитать его силу относительно среднего истинного диапазона движения цены. Индикатор будет незаменимым помощником для трейдеров использующих в своей торговой стратегии,теорию "Снайпер",в которой для торговли используются так называемые "импульсные уровни".Индикатор работает с любыми валютными парами находящимися в окне Обзор Рынка МТ5,металлами,индексами и т.д. Для работы по индикатору,нужно дождаться момента,когда 3 линии с вверх
Didi Index Alert Plus Filter
Indicator developed by Brazilian and analyst Odir Aguiar (Didi), consists of "Moving Averages", known for the famous needles Didi, which allows the visualization of reversal points. The concept is very simple, when you insert 3 Moving Averages on display, one of three periods, an 8 and the other 20, there appears the formation of the indicator which works on an axis or center line 0. The needles occur when the intersection of averages comes closest to the line 0. W

Niubility RSI and Fibo The RSI will send an alert when the RSI value of the price gets to the level specified in the settings.
The input of the indicator can allow for change of RSI period, overbought and oversold.
The RSI will work for multi timeframe.
The RSI will scan different pairs.
This Fibo is designed to draw a Fibonacci retracement, using as a basis the ZigZag indicator.
Description:
'up' word means up trend.
'down' word means down trend.
' -- ' word means no trend.
'red
Alert Stochastic plus delay and level Filter
A stochastic oscillator is a momentum indicator comparing a particular closing price of a security to a range of its prices over a certain period of time. We added many types of alerts plus the Level Cross Filter to aid in your search for better opportunities in the market. Product Features Sound alert Push Notification (Alerts can be sent to your mobile phone) Signs on chart Alert box Level Filter Delay Level Filter
Indicator Parameters K,D

Simple Day Trading Strategy SDT VERY RELIABLE DAY TRADING AND SCALPING INDICATOR THAT CAN MAKE EVEN A NEWBIE PRODUCE TREMENDOUS RESULTS. IT IS SIMPLE AND FAST, NO FANCY ON-CHART OBJECTS. JUST BUY AND SELL ARROWS. IT TELLS YOU WHEN TO ADD TO A POSITION AND WHEN YOU SHOULD CONSIDER EXITING. THE BEST TIME TO EXIT ALL TRADES COMPLETELY IS ON OPPOSITE SIGNALS
GREAT PRODUCT FOR ALL TRADING STYLES (swing, day trading, scalping, etc). JUST TRY IT ON ALL TIME FRAMES AND CURRENCY PAIRS AND SETTLE ON T
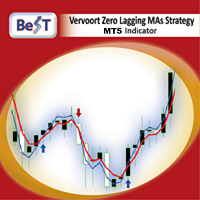
All those involved in trading do certainly know that Moving Average Crossovers for being tradable should be reliable and also they need to have minimal lag.
BeST_Vervoort Zero Lagging MAs Strategy is an outstanding indicator that can help you to achieve it and is based on S.Vervoort's work about Reliable and of Zero Lag MAs Crossovers as described in his TASC_05/2008 article " The Quest For Reliable Crossovers ". It's a Multipotentiality Indicator as it can display of either simply the Zero Lagg

This is an original trend indicator. The indicator draws three lines in a separate window. Its values vary from -1 to +1. The closer the indicator is to +1, the stronger is the ascending trend. The closer it is to -1, the stronger is the descending trend. The indicator can be also used as an oscillator for determining the overbought/oversold state of the market. The indicator has one input parameter Period for specifying the number of bars to be used for calculations.
FREE
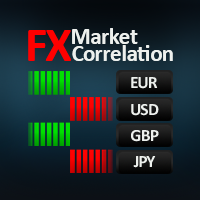
FX Market Correlation indicator calculates the weakness/strength from all 28 currency pairs in the market. This is unique and powerful way of watching the market. It works on all timeframes. You can use it for scalping, or you can use it for long term trading. FX Market Correlation indicator is NOT repainting.
Features: --------- -easy determine which currency is strengthening and which is weakening -choose best currency pairs to trade and times to trade them -find correlation between pairs -NO
Технический индикатор "Reversal patterns" является математической интерпретацией классических разворотных паттернов: Pin Bar, Harami и Engulfing. То есть «Разворотного бара», «Харами» и «Поглощения». Данный индикатор позволяет определить момент разворота котировок на основе рыночной динамики и победителя между «быками» и «медведями». Индикатор отображает момент разворота на локальных максимумах и минимумах графика любого таймфрейма, что позволяет повысить точность сигнала. Также индикатор имеет
Niubility Trend Niubility Trend displays the trend direction for all time frames in real time.
You'll see at a glance at which direction the trends are running, how long they last and how powerful they are.
All this makes it an easy-to-use trend trading system for beginners, advanced and professional traders.
Features
Easy to trade Customizable colors and sizes It is non-repainting and non-backpainting It is fantastic as a trailing stop method It implements alerts of all kinds
Niubility Scalping The Niubility Scalping indicator detects trend, give sell point and buy point. this indicator can use for scalping technique, and also use for trend technique.
Attention
Chart statistics will help you to optimize your trading, statistical accuracy to the hour.
It can works on every timeframe.
The indicator analyzes its own quality and performance.
Losing signals are highlighted and accounted.
The indicator is non-repainting.
It implements sound alerts.
Parameters
Pr
MetaTraderマーケットは自動売買ロボットとテクニカル指標を販売するための最もいい場所です。
魅力的なデザインと説明を備えたMetaTraderプラットフォーム用アプリを開発するだけでいいのです。マーケットでプロダクトをパブリッシュして何百万ものMetaTraderユーザーに提供する方法をご覧ください。

取引の機会を逃しています。
- 無料取引アプリ
- 8千を超えるシグナルをコピー
- 金融ニュースで金融マーケットを探索