SuperTrend AI Clustering MT5
- インディケータ
- バージョン: 1.3
- アップデート済み: 19 11月 2024
- アクティベーション: 5

The SuperTrend AI indicator is a novel take on bridging the gap between the K-means clustering machine learning method & technical indicators. In this case, we apply K-Means clustering to the famous SuperTrend indicator.
🔶 USAGE
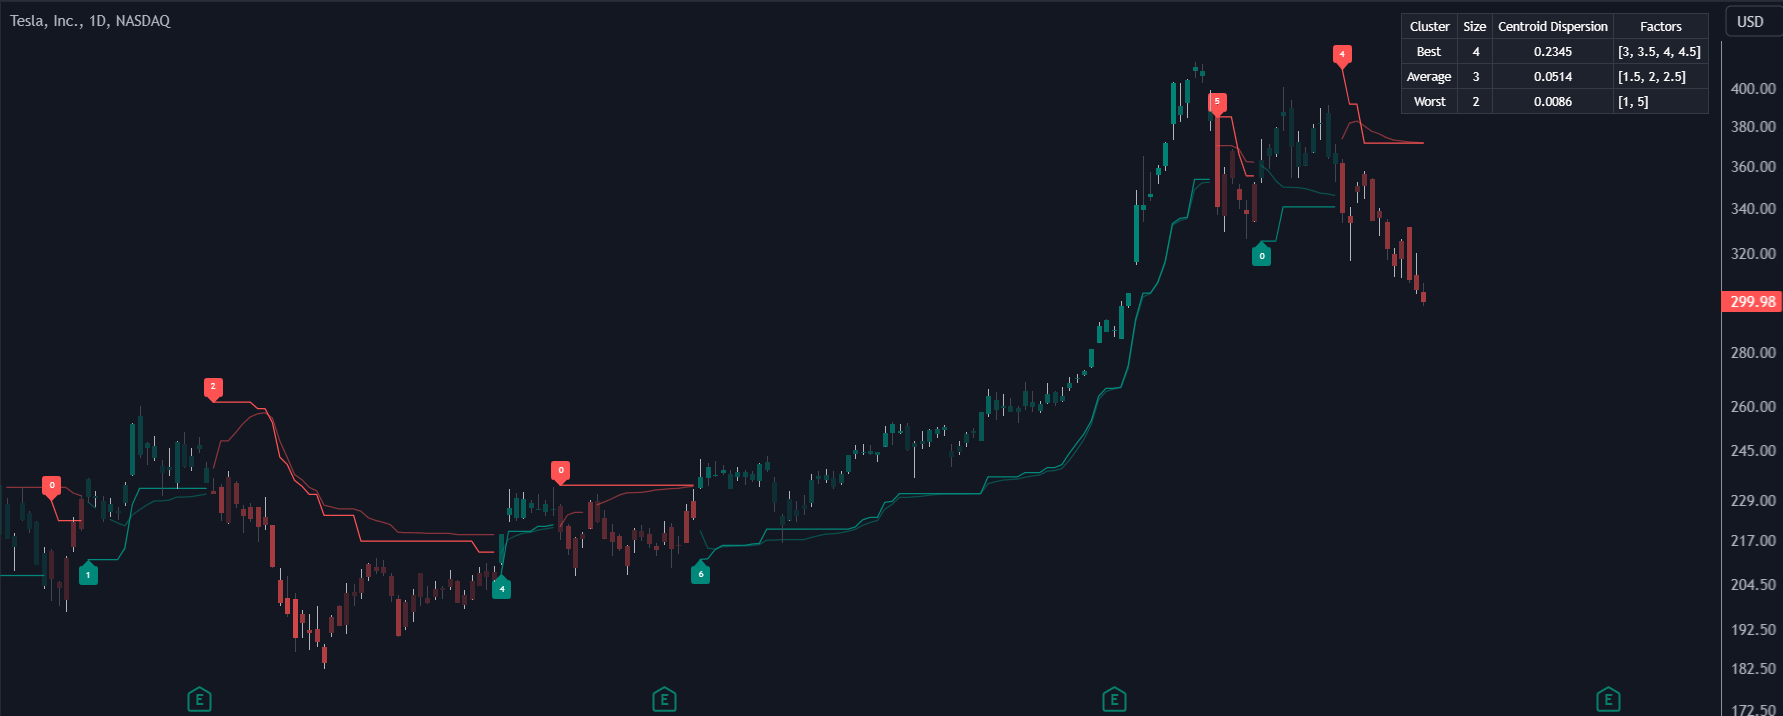
Users can interpret the SuperTrend AI trailing stop similarly to the regular SuperTrend indicator. Using higher minimum/maximum factors will return longer-term signals. (image 1)
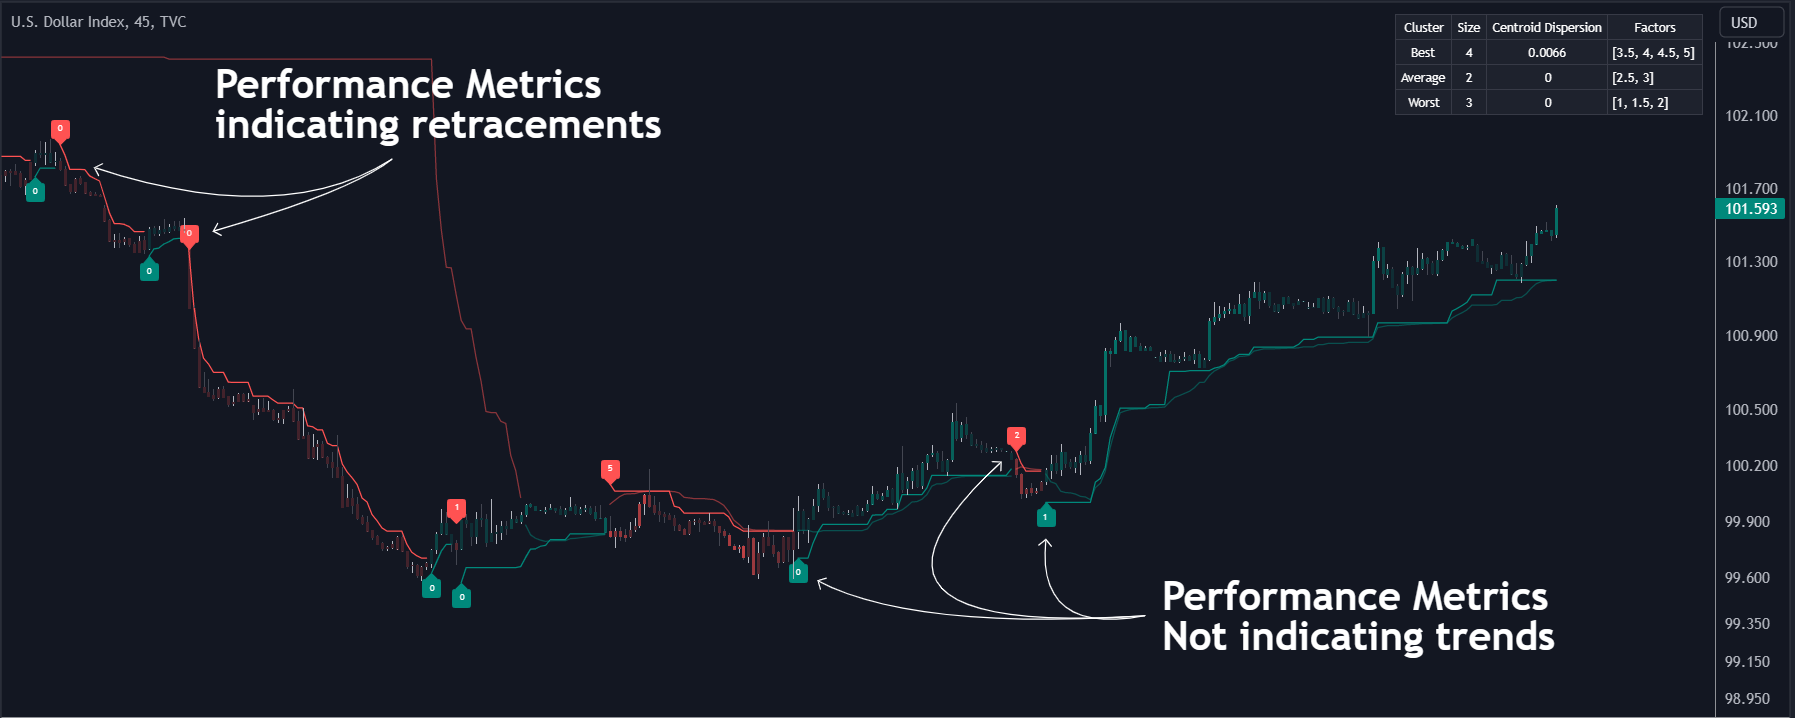
The displayed performance metrics displayed on each signal allow for a deeper interpretation of the indicator. Whereas higher values could indicate a higher potential for the market to be heading in the direction of the trend when compared to signals with lower values such as 1 or 0 potentially indicating retracements. (image 2)
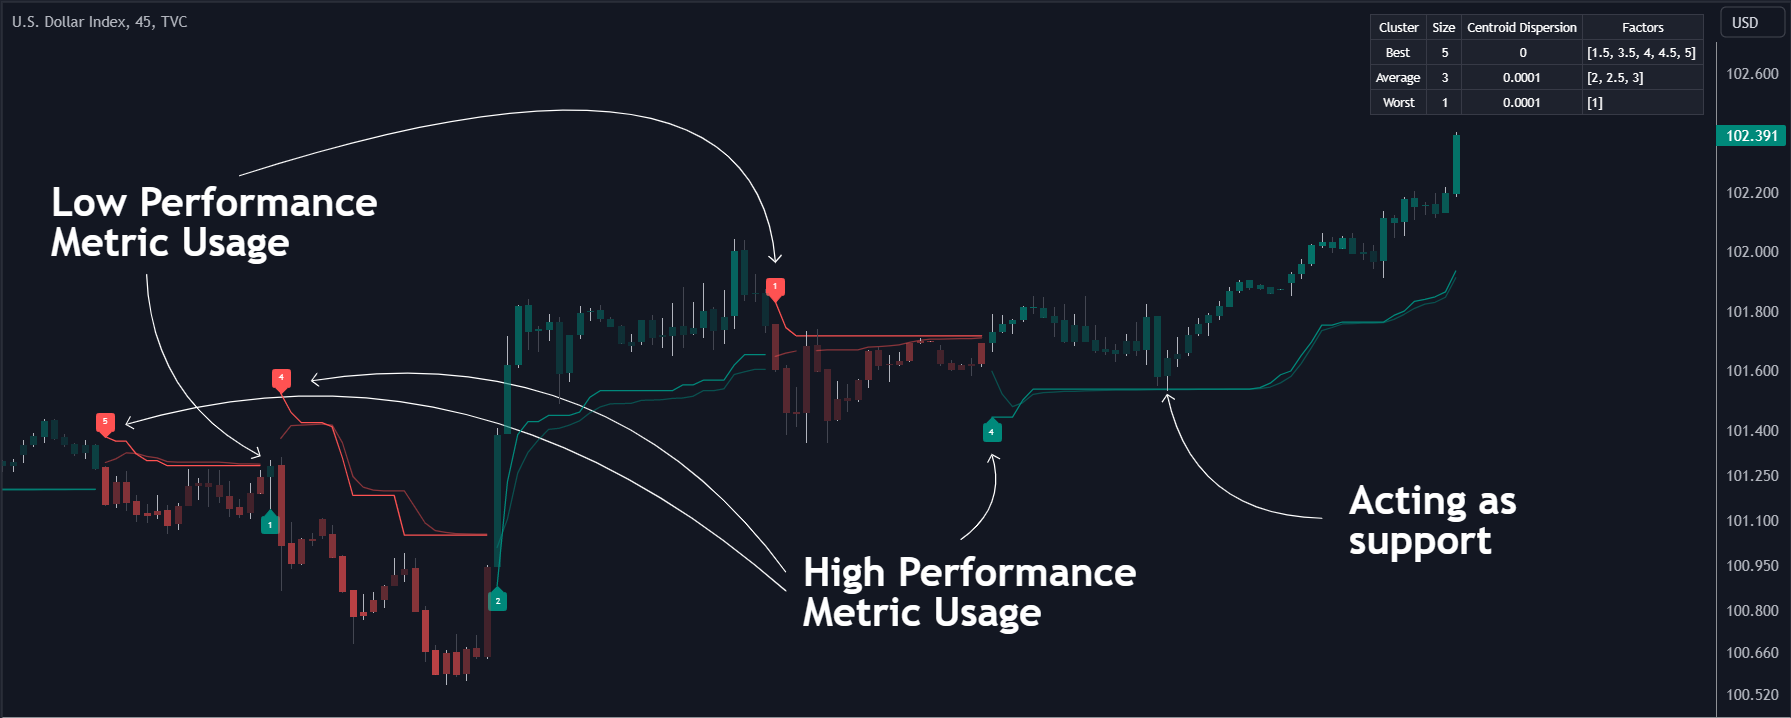
In the image above, we can notice more clear examples of the performance metrics on signals indicating trends, however, these performance metrics cannot perform or predict every signal reliably. (image 3)
We can see in the image above that the trailing stop and its adaptive moving average can also act as support & resistance. Using higher values of the performance memory setting allows users to obtain a longer-term adaptive moving average of the returned trailing stop.
🔶 DETAILS
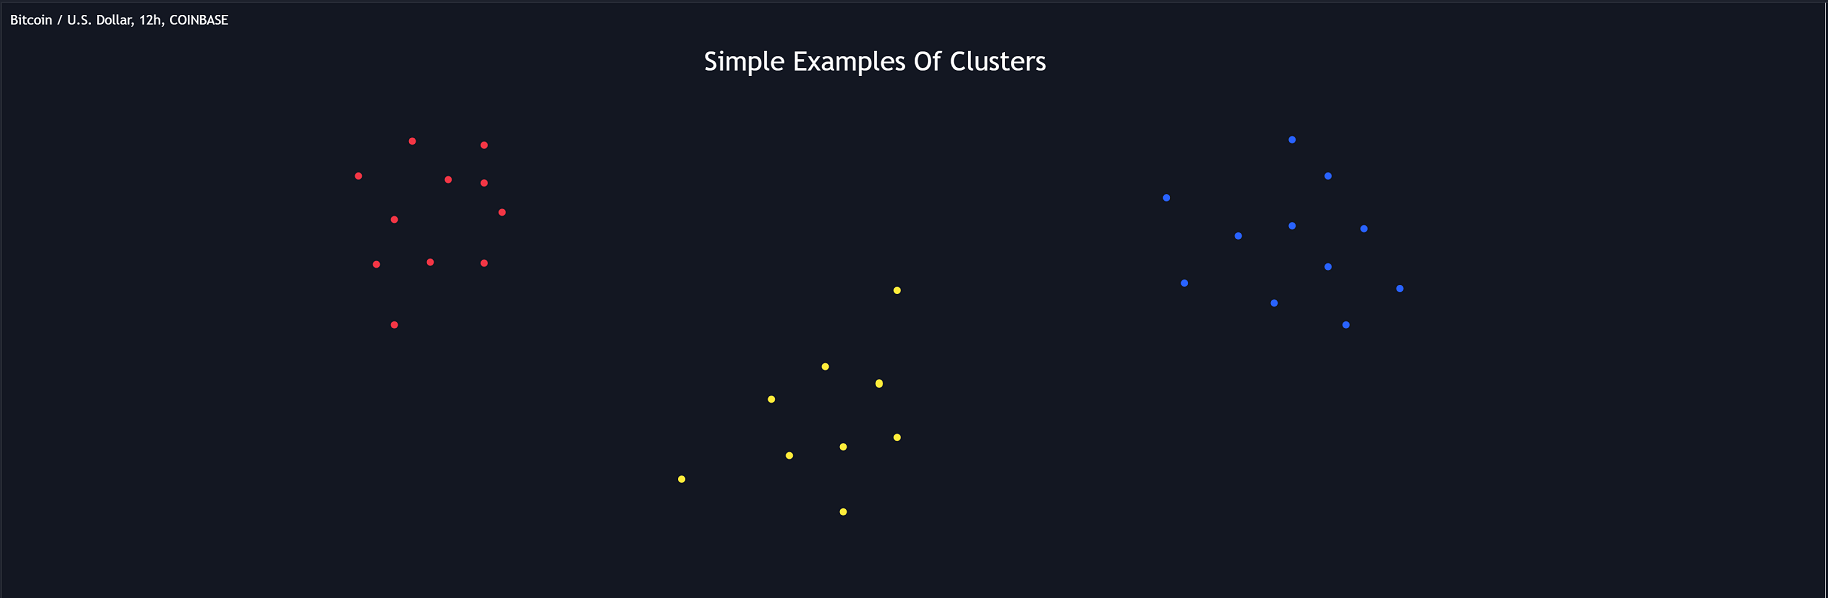
🔹 K-Means Clustering (image 4)
Various methods exist to find clusters within data, with the one used in this script being K-Means Clustering, a simple iterative unsupervised clustering method that finds a user-set amount of clusters.
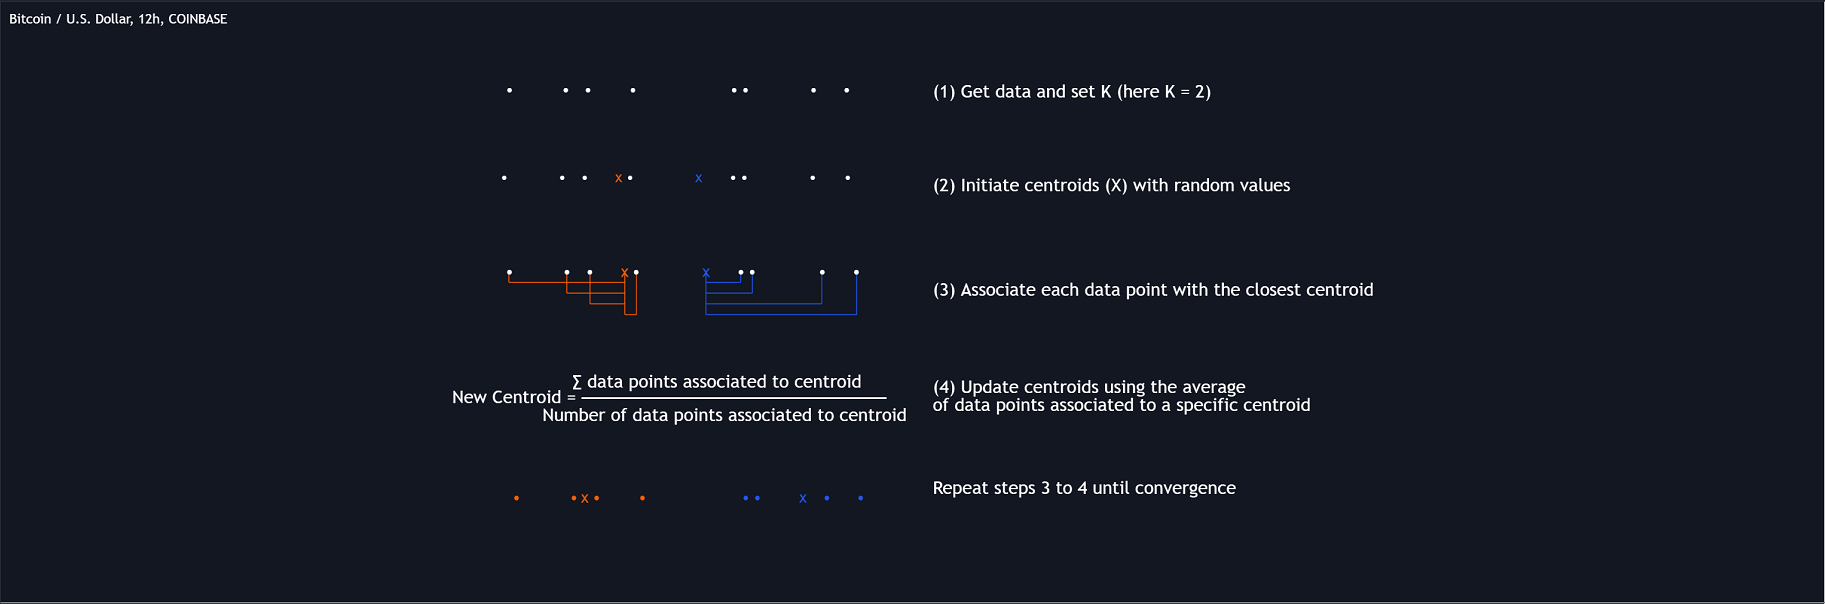
A naive form of the K-Means algorithm would perform the following steps in order to find K clusters:
- (1) Determine the amount (K) of clusters to detect.
- (2) Initiate our K centroids (cluster centers) with random values.
- (3) Loop over the data points, and determine which is the closest centroid from each data point, then associate that data point with the centroid.
- (4) Update centroids by taking the average of the data points associated with a specific centroid.
- Repeat steps 3 to 4 until convergence, that is until the centroids no longer change.
To explain how K-Means works graphically let's take the example of a one-dimensional dataset (which is the dimension used in our script) with two apparent clusters: (image 5)
This is of course a simple scenario, as K will generally be higher, as well the amount of data points. Do note that this method can be very sensitive to the initialization of the centroids, this is why it is generally run multiple times, keeping the run returning the best centroids.🔹 Adaptive SuperTrend Factor Using K-Means
The proposed indicator rationale is based on the following hypothesis:
Given multiple instances of an indicator using different settings, the optimal setting choice at time t is given by the best-performing instance with setting s(t).
Performing the calculation of the indicator using the best setting at time t would return an indicator whose characteristics adapt based on its performance. However, what if the setting of the best-performing instance and second best-performing instance of the indicator have a high degree of disparity without a high difference in performance?
Even though this specific case is rare its however not uncommon to see that performance can be similar for a group of specific settings (this could be observed in a parameter optimization heatmap), then filtering out desirable settings to only use the best-performing one can seem too strict. We can as such reformulate our first hypothesis:
Given multiple instances of an indicator using different settings, an optimal setting choice at time t is given by the average of the best-performing instances with settings s(t).
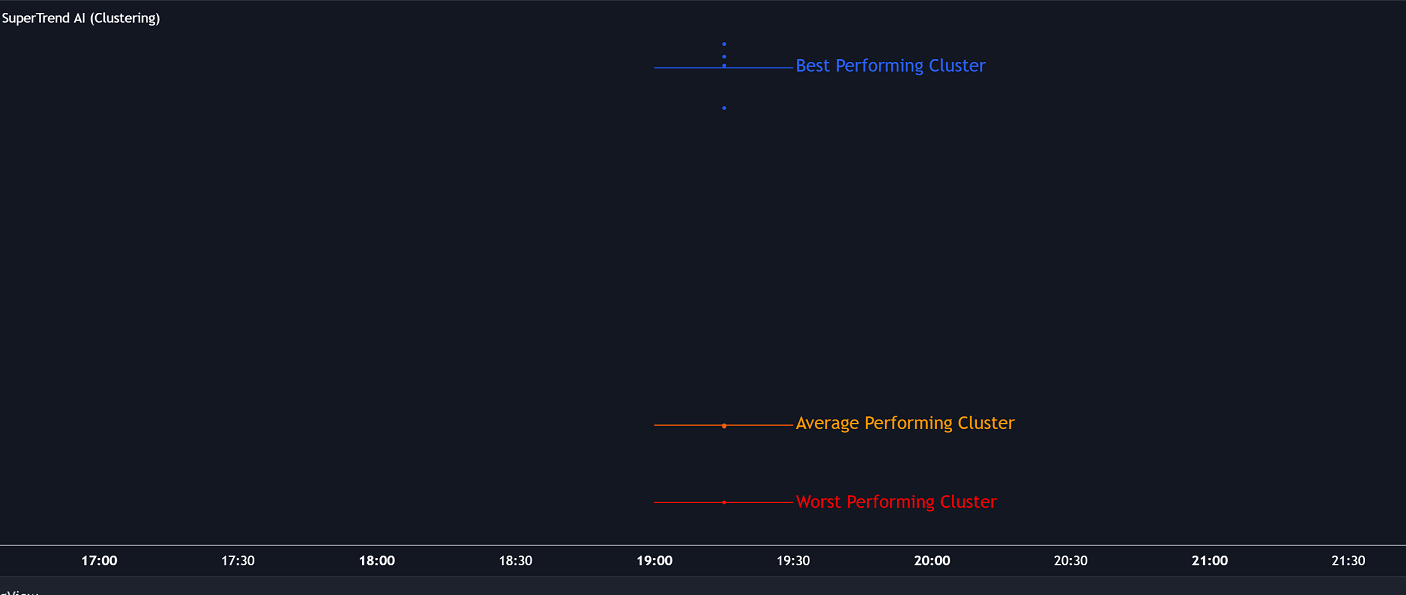
Finding this group of best-performing instances could be done using the previously described K-Means clustering method, assuming three groups of interest (K = 3) defined as worst performing, average performing, and best performing.
We first obtain an analog of performance P(t, factor) described as:
P(t, factor) = P(t-1, factor) + α * (∆C(t) × S(t-1, factor) - P(t-1, factor))where 1 > α > 0, which is the performance memory determining the degree to which older inputs affect the current output. C(t) is the closing price, and S(t, factor) is the SuperTrend signal generating function with multiplicative factor factor.
We run this performance function for multiple factor settings and perform K-Means clustering on the multiple obtained performances to obtain the best-performing cluster. We initiate our centroids using quartiles of the obtained performances for faster centroids convergence. (image 6)
Do note that we give the liberty for the user to get the final factor from the best, average, or worst cluster for experimental purposes.
🔶 SETTINGS
- ATR Length: ATR period used for the calculation of the SuperTrends.
- Factor Range: Determine the minimum and maximum factor values for the calculation of the SuperTrends.
- Step: Increments of the factor range.
- Performance Memory: Determine the degree to which older inputs affect the current output, with higher values returning longer-term performance measurements.
- From Cluster: Determine which cluster is used to obtain the final factor.
🔹 Optimization
This group of settings affects the runtime performances of the script.
- Maximum Iteration Steps: Maximum number of iterations allowed for finding centroids. Excessively low values can return a better script load time but poor clustering.
- Historical Bars Calculation (lookback): Calculation window of the script (in bars). Higher than 500 may cause slow performance. Tested at 300 for best result.