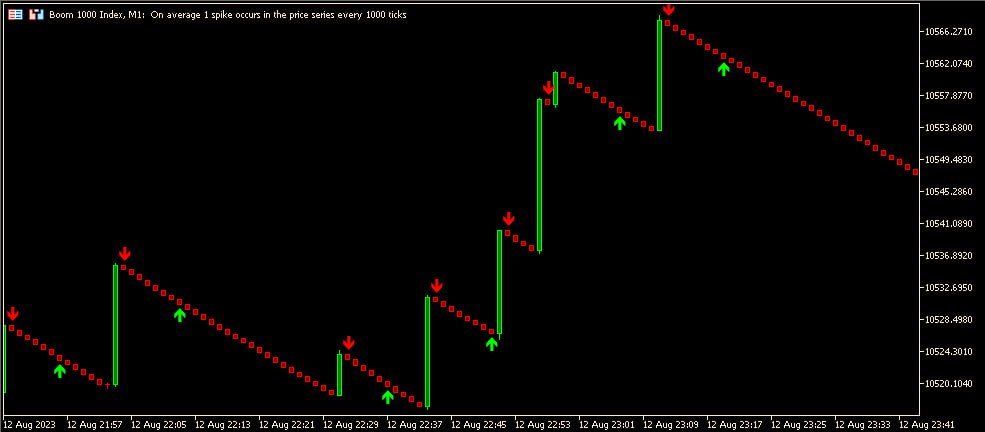
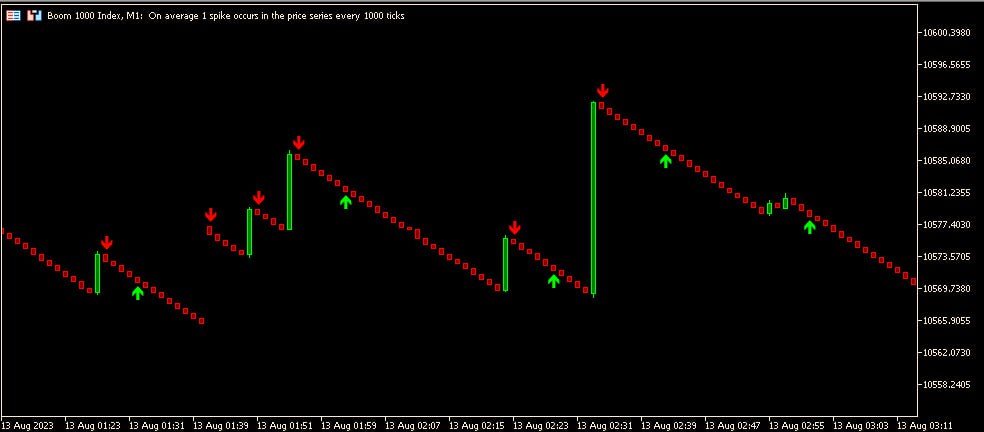
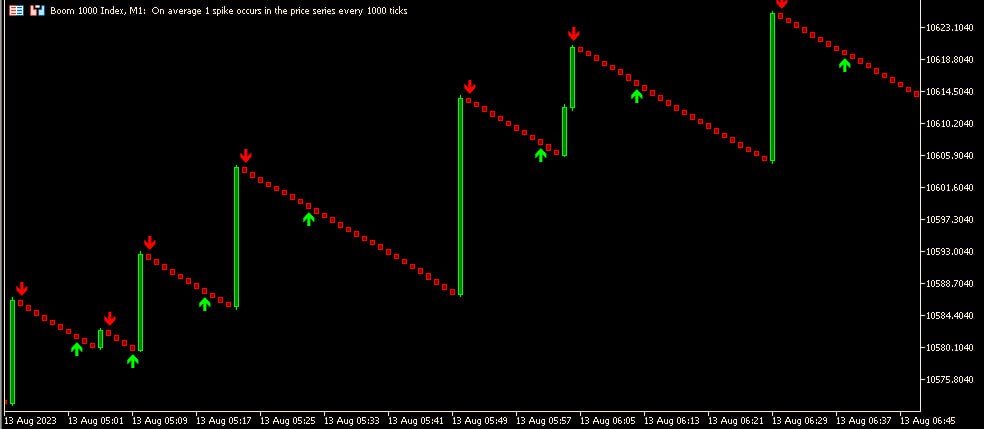
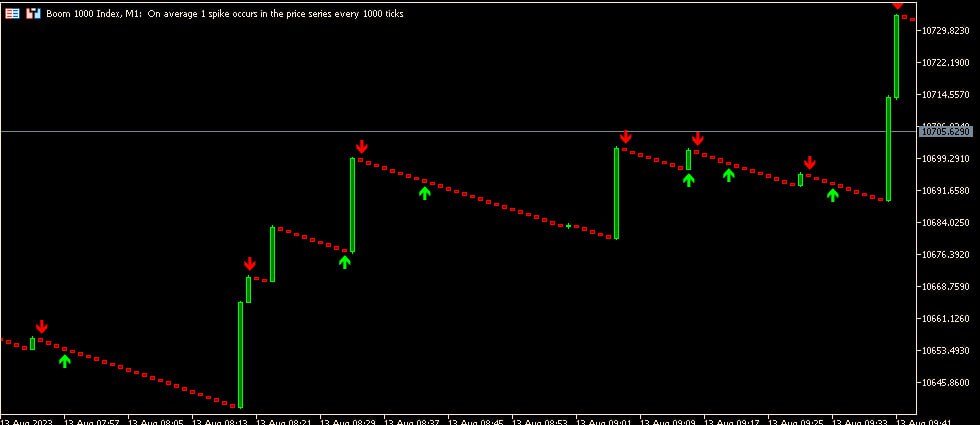
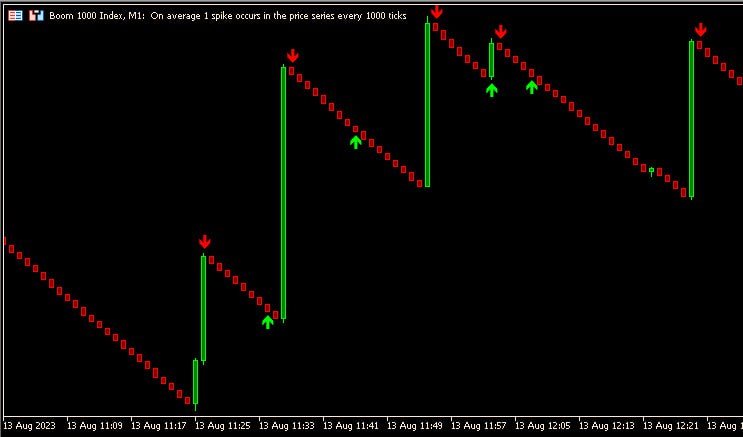
Spike Oscillator

Indicator for searching for price reversals Works well on commodity indices and currency pairs On charts such as Boom Cash, it shows the beginning of a protracted movement well. You can also catch splashes. The indicator uses algorithms, an oscillator and a trend indicator that work together. The indicator shows a candle opening signal (does not disappear, does not redraw and does not recalculate its readings) A good quality tool that can become the basis for creating your own trading system.
おすすめのプロダクト
Introduction to Fractal Pattern Scanner Fractal Indicator refers to the technical indicator that makes use of the fractal geometry found in the financial market. Fractal Pattern Scanner is the advanced Fractal Indicator that brings the latest trading technology after the extensive research and development work in the fractal geometry in the financial market. The most important feature in Fractal Pattern Scanner is the ability to measure the turning point probability as well as the trend probabil
このインジケーターは実践的なトレードに最適な自動波動分析のインジケーターです! 場合... 注:   Tang Lun (Tang Zhong Shuo Zen) の命名規則の影響で、私は波のグレーディングに西洋の名前を使用することに慣れていません。基本的な波を ペン 、二次波のバンドを セグメント と名付けました。同時に、 セグメント にはトレンドの方向が指定されます (この命名方法は将来のノートで使用されます。最初に言っておきます)。ただし、アルゴリズムは曲がりくねった理論とはほとんど関係がないため、付けるべきではありません。これは、私の市場分析 によって要約された、絶えず変化する複雑な運用ルール を反映しています。 バンドは標準化され、人によって異なることがないよう定義されており、市場参入を厳密に分析する上で重要な役割を果たす人為的な干渉の描画方法が排除されています。 このインジケーターを使用することは、取引インターフェイスの美しさを改善することと同等であり、元の K ライン取引を放棄し、取引の新しいレベルに連れて行きます。また、宣伝の観点から顧客の認識も向上します。 イ
Adaptive Math Zones Indicator is a professional MT5 indicator designed to identify high-probability price reaction areas using mathematical price projections and Fibonacci-based channel structures. The indicator automatically builds a reference price channel, highlights neutral zones, and projects future price levels (50%, 100%, and 200%), helping traders visually understand market structure and potential reaction points. This tool is especially effective during ranging and corrective market con
Channel Universal   knows how to correctly build a forex channel and forms a classic trading strategy, it is easy to execute, therefore it is accessible even to beginners. Price channels work equally well on any trading assets and timeframes, they can be used both independently and with additional confirmation from oscillators and market volumes. If you look at the price and try to identify the simplest visual patterns, you will immediately see that the price almost never moves in a straight l
Liquidity Map  Overview The Liquidity Map indicator is an advanced visualization tool based on ICT Smart Money Concepts . It automatically identifies daily Buy Zones , Sell Zones , and Liquidity Levels , showing where price is likely to reverse or continue based on institutional order flow. It calculates key levels from the daily session — such as the previous day’s high, low, and midpoint — then derives a premium (sell bias) and discount (buy bias) structure. When price trades into these mapped
Indicador Para Opções Binarias. Indicator for Binary Options Usa dois gales. Instalar em mt5 Esse indicador é para ser usado no tempo de vela de 5 minutos e em M5. Este também funciona em M1, porém é mais eficiente em M5. Só descompactar e copiar os arquivos na pasta de dados do seu MT5. Arquivos indicator na pasta MQL5 - Indicator. Baixe também a Media Movel totalmente gratis: https://www.mql5.com/pt/market/product/50400 Esse Indicador é para a próxima vela. Apareceu a seta, só aguardar a próx
Best swing
Winsou Cedric Anicet Kpanou
-- BEST SWING  -- L'indicateur BEST SWING est un indicateur technique personnalisé, un excellent outil pour négocier les cassures en fonction des niveaux de support et de résistance horizontaux. L'indicateur BEST SWING utilise une formule complexe en analysant des données de prix autrement incongrues sur les cours de clôture de chaque période, ainsi que les hauts et les bas du prix, afin de donner un aperçu de la force ou de la faiblesse de la tendance du marché et de sa probabilité
The "Five Candle Pattern" indicator is a novel way to see the market, because with it we can compare and/or seek training or the pattern of the past 4 or 5 Candles, and identify them in the same graph, to view your behavior at an earlier time. The indicator creates a pattern of those 4 or 5 candles and searches backward, identifies, and marks the same formation or pattern. With that information you adjust the strategy that is operating, or create a new one, because you can compare the past devel
Impulse fractals indicator - is counter-trend oriented complex market fractal pattern.  Market creates bull/bear impulse, trend starts, fractals on impulsed wave are an agressive pullback signals. Buy arrow is plotted when market is bearish and it's impulse showed up-side fractal, and sell arrow is plotted when market is bullish and it's impulse showed dn-side fractal. Main indicator's adjustable inputs : impulsePeriod - main period of impulse histogram  filterPeriod  - smoothes impulse accordi
Rectangle Trading Custom is a powerful technical analysis tool designed for price action and range-based traders. It allows users to define consolidation zones and receive alerts when the price breaks out of these zones or approaches trendlines drawn on the chart. Rectangles and Trendlines will be extended into future with one click. Rectangle point size, name and prices will be displayed around rectangle. Key Features: Draw Trading Zones (Rectangle Zones) Users can manually draw rectangles to
概要 外国為替や金融市場では、迅速な反応と正確な意思決定が非常に重要です。しかし、標準のMetaTrader 5端末は最小でも1分のチャートしかサポートしておらず、トレーダーが市場の変動に敏感であることを制限しています。この問題を解決するために、 秒単位チャートキャンドルインジケーター を導入しました。このインジケーターを使用すれば、1秒から30秒の市場の動向をサブチャートで簡単に表示・分析できます。 主な機能 複数の秒単位タイムフレームのサポート :このインジケーターは、以下のタイムフレームを選択でき、さまざまな取引戦略に対応します: S1 : 1秒 S2 : 2秒 S3 : 3秒 S4 : 4秒 S5 : 5秒 S10 : 10秒 S15 : 15秒 S20 : 20秒 S30 : 30秒 リアルタイム更新 :秒単位チャートはリアルタイムで更新され、各瞬間に最新の市場情報を提供します。これにより、迅速な取引判断が可能になります。 ユーザーフレンドリーなインターフェース :インジケーターはサブチャートに表示され、直感的で使いやすいです。異なるタイムフレームに素早く切り替えて市場を迅速
Oscilador bem próximo que o indicador SANTO mostrado pelo Bo Williams em sua metodologia PhiCube, para mim este indicador ainda é melhor que o próprio SANTO original. Ótimo para entender a força e tendência de movimentos e possíveis divergências. Preço fazendo topo e o SANTO não renovando máxima, tudo indica que teremos uma reversão ou no mínimo um drawback.
DiNapoli Stochastic Predictor V2.02 DiNapoli Stochastic Predictor は、伝説的なトレーダーであるジョー・ディナポリ(Joe DiNapoli)が提唱した独自の平滑化手法に基づき、古典的なストカスティクスを高度に最適化したインジケーターです。通常のストカスティクスは非常に「ノイズ」が多く反応が過敏になりがちですが、ディナポリ・バージョンでは二重の平滑化プロセスを適用することで市場のノイズを効果的に除去し、より信頼性の高い買われすぎ・売られすぎのシグナルを提供します。 このツールの最大の特徴は、 リアルタイム予測パネル です。指標が25(底)、75(天井)のレベルに到達するため、あるいはラインの交差(反転)が発生するために必要な正確な価格レベルをチャート上に直接投影します。これにより、動きが起こる前に市場の展開を予測することが可能になります。 主な利点 ディナポリ平滑化アルゴリズム: 横ばい相場でのダマシを軽減する、優れた計算アルゴリズムを採用。 ダイナミック・ターゲットパネル: トレンド転換やエントリーシグナルに必要な正確
FREE
一目で分析を強化! このインジケーターは、価格が最近反発または突破した重要なレベルを自動的に描画し、手動でラインを引くことなくサポートとレジスタンスのゾーンを表示します。チャートに適用するだけで、各期間の過去の高値・安値ラインが表示されます。 各ラインの意味 Previous Month High ‣ 前月高値:前の月の期間内で記録された最高価格。 Previous Month Low ‣ 前月安値:前の月の期間内で記録された最安価格。 Previous Week High ‣ 前週高値:前の週の期間内で記録された最高価格。 Previous Week Low ‣ 前週安値:前の週の期間内で記録された最安価格。 Previous Day High ‣ 前日高値:直前の取引日の最高価格。 Previous Day Low ‣ 前日安値:直前の取引日の最安価格。 なぜ使うのか? グラフを開いた瞬間に 反発 と 突破 を検出。 実績あるゾーンで 利確 と 損切り を設定。 SMC や ICT 戦略に必須、市場構造をベースにエントリーと決済を最適化。 スキャルピング 、 スイング
Volume Based Support Resistance With Alerts is an indicator that calculates volume profile for selected timeframe (not necessarily chart timeframe), finds local points of control (high volume zones) and low volume zones. Low volume zones often serve as strong support / resistance. Between these zones lie zones with significantly higher volume and that is where most of the price action is taking place, culminating with point of control. We can therefore use volume profile and it's structure to se
Trend Line Finder will project forward a support and resistance lines using 2 previous highs for resistance and 2 previous lows for support.  It will then signal to the trader by alert making the trader more aware that a possible good move is about to happen.     This is not a stand-alone trading system but is very useful in finding key areas of support resistance levels where price will usually either rebound from or breakthrough. Its down to the trader to decide what to do with use of other s
Momentum Potentia Altopium is a trend and momentum indicator. The channel identifies support and resistance zones and therefore pullbacks and breakouts. Bullish : When the price is above the channel and the color is green the market has strong upward momentum. Bearish : When the price trades below the channel and the color is light red, the market has strong downward momentum. This indicator can be used in two ways: Pullback : when the trend is up or down and the price returns to the channel
BluePrint Adaptive Trader - Professional Trading System Advanced Channel Trading System based on our proprietary TrenderFlex PRO algorithm Learn more about TrenderFlex PRO KEY FEATURES • TrenderFlex PRO Channel Technology - Advanced channel calculation based on our proven algorithm • Adaptive Risk Management - Automatic TP/SL calculation based on channel width • Win Rate Statistics - Real-time tracking of TP1, TP2, TP3 success rates • Multi-Timeframe Analysis - Monitor 7 timeframes simultaneou
Chart Replay Indicator MT5 Overview Chart Replay Indicator is a chart replay and training tool for MetaTrader that allows users to replay historical market data bar by bar directly on the chart. It is designed for manual backtesting, strategy training, and market behavior analysis without relying on future price information. Candles are displayed progressively to reproduce the flow of historical data. This indicator does not provide trading signals and does not execute or manage trades. Key Feat
Zigzag X Fibo
Ian David Emmanuel Bello
The ZigZag indicator's main objective is to highlight significant price movements by filtering out minor price fluctuations. It enables the visualization of trends by eliminating market "noise," which can assist traders in making more informed decisions. Adding the Fibonacci indicator, which is a powerful tool for identifying potential support and resistance levels in financial markets.
This easy to setup indicator shows you the market volumes in a different way, with support and resistance as showed. You can setup: - Backdays volume to show - Heiken Ashi candle view It works for every kind of graph and every kind of period. The program shows the volumes based on the number of candles displayed in the chart: the more candles the more volumes. Enjoy this very useful indicator. Please feel free to message me to report any kind of improvements! :D
Purpose : The SuperTrend indicator tracks price trends, plotting a line that follows the trend direction (up or down) and optionally fills the area between the trend line and the closing price Plots : SuperTrend Line : A colored line (green for uptrend, red for downtrend) plotted below the price in uptrends and above in downtrends. Filling : Optional filled area (bisque/pale green) between the SuperTrend line and the closing price, shown only if Show_Filling is true. Logic : Calculates ATR usin
MetaTrader 5用スマートピボットポイント — スマートな取引のための明確なレベル スマートピボットポイントは、MetaTrader 5用のプロフェッショナルインジケーターです。チャート上に主要な取引レベルを自動計算し、表示します。混沌とした価格変動を、明確な構造化されたマップに変換し、サポート、レジスタンス、価格バランス、そして潜在的なターゲットゾーンをハイライトします。明瞭性を重視するトレーダーのために設計されたこのツールは、FX、仮想通貨(ビットコイン、イーサリアム)、株価指数、株式、コモディティ(XAUUSD)など、あらゆる市場で機能します。 このインジケーターは、計算時間を節約し、分析に客観性をもたらす、信頼できる分析アシスタントです。市場シグナルを提供したり、代わりに意思決定を行うわけではありませんが、情報に基づいた独自の取引判断のための高品質な情報基盤を提供します。 主な機能とメリット すぐに使える価格座標システム:もう手動でレベルを描く必要はありません。中心レベル(バランス)、サポート、レジスタンス、買いターゲット、売りターゲットの5本の明確なラインがチャ
My Point MT5
Claudia Ramona Angerer
Diagnosis of major and minor pivot Trend detection with many signals Can be used in all symbols Can be used in all time frames Settings: Back Show: The number of candles it displays If you need any adjustments, or have any questions or suggestions, message me How to trade: Blue: sell signal Red: buy signal Blue and red at the same time: no signal Exit signal: Opposite signal
Smart Money Structure & Precision Trading Indicator (MT5) Smart Money Structure & Precision Trading Indicator  is a powerful Smart Money Concepts (SMC) indicator for MetaTrader 5, designed to help traders identify high-probability entries with institutional logic . This indicator automatically detects market structure in real time , highlights key liquidity levels , and provides clear, non-repainting signals so you can trade with confidence and precision. Whether you are a scalper, day trader, o
Take your Boom trading to the next level with the DC Dynamic Scalping Indicator for Boom , engineered specifically for precision scalping and small account growth. This powerful, non-repainting indicator is designed to catch short-term selling opportunities on Boom indices, backed by our proprietary Dynamic Trend Filter that ensures you always trade in the direction of the prevailing trend. With a built-in blue background template , your charts are clean, focused, and ready for action. Key Fe
Despite the apparent simplicity of the indicator, inside it has complex analytical algorithms with which the system determines the moments of inputs. The indicator gives accurate and timely signals to enter and exit the transaction that appear on the current candle. The main purpose of this indicator is to determine the moments of entry and exit from transactions, therefore, the Trend Revers indicator will display only the trend line and entry points, that is, displays the entry points to the
PricePulse Pro - Indicator of Simple Solutions! Using this indicator is very easy - just follow the colored arrows on the chart. The indicator algorithm takes into account daily price fluctuations and focuses on measuring the "candlestick" share in the trend. This indicator uses an algorithm that considers price changes based on various parameters such as H/C (high price/close), H/O (high price/open), LC (low price/close), LO (low price/open). This allows for a more detailed analysis of price
Simple EA with 1 SMA and Fibonacci. The Expertadvisor opens positions in the direction of the trend when price levels have exceeded or fallen below the Fibonacci levels. It depends on the market in question and which parameters to use. The EA is programmed in such a way that optimization runs consume little time. A news filter and filter by day of the week are built in.
このプロダクトを購入した人は以下も購入しています
ARICoin is a powerful trading companion designed to generate high-probability entry signals with dynamic TP/SL/DP levels based on volatility. Built-in performance tracking shows win/loss stats, PP1/PP2 hits, and success rates all updated live. Key Features: Buy/Sell signals with adaptive volatility bands Real-time TP/SL/DP levels based on ATR Built-in MA Filter with optional ATR/StdDev volatility Performance stats panel (Success, Profit/Loss, PP1/PP2) Alerts via popup, sound, push, or email Cust
AriX
Temirlan Kdyrkhan
1 (4)
AriX Indicator for MT5 A powerful trend-following and signal-evaluation tool AriX is a custom MT5 indicator that combines Moving Averages and ATR-based risk/reward logic to generate clear buy/sell signals. It visualizes dynamic SL/TP levels, evaluates past trade outcomes, and displays win/loss statistics in a clean on-chart panel. Key features include: Buy/Sell signals based on MA crossovers ATR-based SL/TP1/TP2/TP3 levels with visual lines and labels Signal outcome tracking with real-time stat
このインジケーターを購入された方には、以下の特典を 無料 で提供しています: 各トレードを自動で管理し、ストップロスとテイクプロフィットを設定し、戦略ルールに基づいてポジションを決済する補助ツール 「Bomber Utility」 様々な銘柄に合わせたインジケーターの設定ファイル(セットファイル) 「最小リスク」、「バランスリスク」、「待機戦略」 の3つのモードで使用できる Bomber Utility 用の設定ファイル このトレーディング戦略をすぐに導入・設定・開始できる ステップバイステップのビデオマニュアル ご注意: 上記の特典を受け取るには、MQL5のプライベートメッセージシステムを通じて販売者にご連絡ください。 オリジナルのカスタムインジケーター 「Divergence Bomber(ダイバージェンス・ボンバー)」 をご紹介します。これは、MACDのダイバージェンス(乖離)戦略に基づいた 「オールインワン」型のトレーディングシステム です。 このテクニカルインジケーターの主な目的は、価格とMACDインジケーターの間に発生するダイバージェンスを検出 し、将来の価格の動きを示す
このインジケーターは、反転ポイントと価格戻りゾーンを正確に表示します。     主要プレーヤー 。新たなトレンドが形成される場所を把握し、最大限の精度で意思決定を行い、すべての取引をコントロールします。 TREND LINES PRO インジケーターと組み合わせることで、その潜在能力を最大限に発揮します。 VERSION MT4 インジケーターが示す内容: 新しいトレンドの始まりに活性化する反転構造と反転レベル。 リスクと報酬の比率を最小限に抑えた利益 確定 と 損失停止の レベルの表示     RR 1:2   。 インテリジェントな削減ロジックによるストップロス。 指定されたインジケーターから 2 つのトレンド タイプの反転パターンを表示します。 指標: トレンドを追う   TREND LINES PRO   (世界的なトレンドの変化) TREND PRO   (クイックトレンド変更) シンプルで効果的   スキャナー   リアルタイムトレンド(新機能)。 マルチタイムフレームのインストゥルメント フィルタリング。 画面   利益     LOGIC AI信号の後。 当日プラス方
Azimuth Pro
Ottaviano De Cicco
5 (4)
発売プロモーション Azimuth Proは先着100名様限定で 299ドル でご提供します。最終価格は 499ドル となります。 リテールとインスティテューショナルのエントリーの違いはインジケーターではなく、ロケーションにあります。 多くのトレーダーは、モメンタムを追いかけたり、遅行シグナルに反応して、任意の価格レベルでエントリーします。機関投資家は、需給が実際にシフトする構造的なレベルに価格が到達するのを待ちます。 Azimuth Proはこれらのレベルを自動的にマッピングします:スイングアンカーVWAP、マルチタイムフレーム構造ライン、高確率ロケーションにのみ出現するABCパターン。 Azimuth Proは、構造分析とインテリジェントな自動化の両方を求めるプロフェッショナルトレーダー向けに構築されています。 Azimuthが外科的精度で市場構造をマッピングする一方、Azimuth Proはインテリジェンスレイヤーを追加します:トレーディングスタイルの自動検出、スマート設定された移動平均線、20年のデータでバックテストされた最適化パラメータ。その結果、お使いの銘柄と
トレンドラインプロ   市場の真の方向転換点を理解するのに役立ちます。この指標は、真のトレンド反転と主要プレーヤーが再び参入するポイントを示します。 分かりますか     BOSライン   複雑な設定や不要なノイズなしに、より長い時間足でのトレンドの変化と重要なレベルを把握できます。シグナルは再描画されず、バーが閉じた後もチャート上に残ります。 MT4バージョン   -   RFI LEVELS PRO インジケーター と組み合わせることで、その最大限の能力を発揮します インジケーターが示す内容: 本当の変化   トレンド(BOSライン) 一度シグナルが現れたら、それは有効です!これは、リペイント機能を持つインジケーターとの重要な違いです。リペイント機能を持つインジケーターは、シグナルを発した後、それを変更し、資金の損失につながる可能性があります。これにより、より高い確率と精度で市場に参入できます。また、矢印が現れた後、目標値(利益確定)に達するか、反転シグナルが現れるまで、ローソク足の色を変更する機能もあります。 繰り返しエントリ   主要プレーヤーの補充 エントリーポイントを探す
Quantum TrendPulse を ご紹介します。これは、   SuperTrend   、   RSI   、および Stochastic のパワーを 1 つの包括的なインジケーターに組み合わせて、取引の可能性を最大限に引き出す究極の取引ツールです。精度と効率を求めるトレーダー向けに設計されたこのインジケーターは、市場のトレンド、勢いの変化、最適なエントリー ポイントとエグジット ポイントを自信を持って特定するのに役立ちます。 主な特徴: SuperTrend 統合: 現在の市場動向に簡単に追従し、収益性の波に乗ることができます。 RSI精度: 買われすぎと売られすぎのレベルを検出し、市場の反転のタイミングに最適で、SuperTrendのフィルターとして使用されます。 確率的精度: 確率的振動を活用して、変動の激しい市場で隠れたチャンスを見つけます。SuperTrend のフィルターとして使用されます。 マルチタイムフレーム分析:   M5 から H1 または H4 まで、さまざまなタイムフレームで市場を常に把握します。 カスタマイズ可能なアラート: カスタム取引条件が満たされ
優れたテクニカルインジケーター「Grabber」をご紹介します。これは、すぐに使える「オールインワン」トレーディング戦略として機能します。 ひとつのコードに、市場のテクニカル分析ツール、取引シグナル(矢印)、アラート機能、プッシュ通知が強力に統合されています。 このインジケーターを購入された方には、以下の特典を無料で提供します: Grabberユーティリティ:オープンポジションを自動で管理するツール ステップバイステップのビデオマニュアル:インジケーターのインストール、設定、取引方法を解説 カスタムセットファイル:インジケーターをすばやく自動設定し、最大限の成果を出すための設定ファイル 他の戦略はもう忘れてください!Grabberだけが、あなたを新たなトレードの高みへと導いてくれるのです。 Grabber戦略の主な特徴: 推奨タイムフレーム:M5〜H4 対応通貨ペア・資産:どれでも使用可能ですが、私が実際に検証した以下を推奨します(GBPUSD、GBPCAD、GBPCHF、AUDCAD、AUDUSD、AUDSGD、AUDCHF、NZDUSD、NZDCAD、EURCAD、EURUSD、E
RelicusRoad Pro: 定量的市場オペレーティングシステム 【期間限定】無制限アクセス 70% OFF - 2,000人超のトレーダーと共に なぜ多くのトレーダーは「完璧な」インジケーターを使っても失敗するのでしょうか? それは、文脈を無視して 単一の概念 だけでトレードしているからです。文脈のないシグナルは単なるギャンブルです。勝ち続けるには、 根拠の重なり(コンフルエンス) が必要です。 RelicusRoad Proは単なる矢印インジケーターではありません。完全な 定量的市場エコシステム です。独自のボラティリティモデリングを用いて、価格が推移する「適正価値の道(Fair Value Road)」をマッピングし、ノイズと真の構造的ブレイクを判別します。 推測はやめましょう。機関投資家レベルの「ロード・ロジック」でトレードを。 コアエンジン:「Road」アルゴリズム システムの中心となる Road Algo は、市場環境にリアルタイムで適応するダイナミックなボラティリティチャネルです。 安全ライン(平衡点) と、価格が数学的に反転しやすい 拡張レベル を投影します。 Si
これはMT5のインジケーターで、再描画なしで取引に参入するための正確なシグナルを提供します。 外国為替、暗号通貨、金属、株式、インデックスなど、あらゆる金融資産に適用できます。かなり正確な見積もりを提供し、取引を開始して終了するのに最適な時期を教えてくれます。1つのシグナルを処理しただけでインジケーターの元が取れた例の 動画 (6:22)をご覧ください。Entry PointsPro インジケーターの助けを借りたほとんどのトレーダーの最初の1週間の結果が改善しています。 Telegramグループ に登録してください。Entry Points Proインジケーターのメリットは次の通りです。 再描画のないエントリーシグナル 再描画されるインジケーターでは一度表示されたシグナルが削除されて大きな金銭的損失につながることがありますが、これと異なり、表示されて確認されたシグナルは消えることがありません。 エラーなしの取引開始 インジケーターアルゴリズムによって取引を開始する(資産を売買する)理想的な瞬間を見つけることができます。それを使用するすべてのトレーダーの成功率が向上します。 あら
ARIPoint is a powerful trading companion designed to generate high-probability entry signals with dynamic TP/SL/DP levels based on volatility. Built-in performance tracking shows win/loss stats, PP1/PP2 hits, and success rates all updated live. Key Features: Buy/Sell signals with adaptive volatility bands Real-time TP/SL/DP levels based on ATR Built-in MA Filter with optional ATR/StdDev volatility Performance stats panel (Success, Profit/Loss, PP1/PP2) Alerts via popup, sound, push, or email Cu
The Trend Forecaster indicator utilizes a unique proprietary algorithm to determine entry points for a breakout trading strategy. The indicator identifies price clusters, analyzes price movement near levels, and provides a signal when the price breaks through a level. The Trend Forecaster indicator is suitable for all financial assets, including currencies (Forex), metals, stocks, indices, and cryptocurrencies. You can also adjust the indicator to work on any time frames, although it is recommen
「 Dynamic Scalper System MT5 」インジケーターは、トレンド波の中でスキャルピング取引を行う手法のために設計されています。 主要通貨ペアと金でテスト済みで、他の取引商品との互換性があります。 トレンドに沿った短期的なポジションオープンのシグナルを提供し、追加の価格変動サポートも提供します。 インジケーターの原理 大きな矢印はトレンドの方向を決定します。 トレンド波の中では、小さな矢印の形でスキャルピングシグナルを生成するアルゴリズムが機能します。 赤い矢印は強気方向、青い矢印は弱気方向です。 トレンドの方向には敏感な価格変動ラインが描かれ、小さな矢印のシグナルと連動します。 シグナルは次のように機能します。適切なタイミングでラインが現れるとエントリーシグナルが形成され、ラインが開いている間はポジションが保持され、完了すると取引が終了します。 推奨される動作時間枠はM1~H4です。 矢印は現在のローソク足に形成され、次のローソク足が開いている場合は、前のローソク足の矢印は再描画されません。 入力パラメータ Trend Wave Period - トレ
ご紹介     Quantum Breakout PRO は 、ブレイクアウト ゾーンの取引方法を変革する画期的な MQL5 インジケーターです。 13年以上の取引経験を持つ経験豊富なトレーダーのチームによって開発されました。     クォンタム ブレイクアウト プロ   は、革新的でダイナミックなブレイクアウト ゾーン戦略により、あなたのトレーディングの旅を新たな高みに押し上げるように設計されています。 クォンタム ブレイクアウト インジケーターは、5 つの利益ターゲット ゾーンを備えたブレイクアウト ゾーン上のシグナル矢印と、ブレイクアウト ボックスに基づいたストップロスの提案を提供します。 初心者トレーダーにもプロのトレーダーにも適しています。 量子EAチャネル:       ここをクリック 重要!購入後、インストールマニュアルを受け取るためにプライベートメッセージを送ってください。 推奨事項: 時間枠: M15 通貨ペア: GBPJPY、EURJPY、USDJPY、NZDUSD、XAUUSD アカウントの種類: ECN、Raw、またはスプレッドが非常に低い R
現在33%オフ 初心者にもエキスパートトレーダーにも最適なソリューション このインジケーターは独自の機能と新しい公式を多数内蔵しており、ユニークで高品質かつ手頃な取引ツールです。このアップデートでは、2つの時間枠ゾーンを表示できるようになります。より長いTFだけでなく、チャートTFとより長いTF(ネストゾーンを表示)の両方を表示できます。すべてのSupply Demandトレーダーの皆さんのお気に召すはずです。:) 重要情報の公開 Advanced Supply Demandの可能性を最大化するには、 https://www.mql5.com/ja/blogs/post/720245 にアクセスしてください。   エントリーまたはターゲットの正確なトリガーポイントを正確に特定できれば取引がどのように改善されるか想像してみてください。新しい基盤となるアルゴリズムに基づいて構築されているため、買い手と売り手の間の潜在的な不均衡をさらに簡単に特定できます。これは、最も強い需要と供給のゾーンと、過去のパフォーマンス(古いゾーンを表示)がグラフィカルに表現されるためです。これらの機能は、最適な
note: this indicator is for METATRADER4, if you want the version for METATRADER5 this is the link:  https://www.mql5.com/it/market/product/108106 TRENDMAESTRO ver 2.5 TRENDMAESTRO recognizes a new TREND from the start, he never makes mistakes. The certainty of identifying a new TREND is priceless. DESCRIPTION TRENDMAESTRO identifies a new TREND in the bud, this indicator examines the volatility, volumes and momentum to identify the moment in which there is an explosion of one or more of these da
発見が困難で頻度が少ないため、分岐は最も信頼できる取引シナリオの1つです。このインジケーターは、お気に入りのオシレーターを使用して、通常の隠れた分岐点を自動的に見つけてスキャンします。 [ インストールガイド | 更新ガイド | トラブルシューティング | よくある質問 | すべての製品 ] 取引が簡単 通常の隠れた発散を見つけます 多くのよく知られている発振器をサポート ブレイクアウトに基づいて取引シグナルを実装します 適切なストップロスおよび利益レベルを表示します 設定可能なオシレーターパラメーター カスタマイズ可能な色とサイズ バー単位でサイズ別に分岐をフィルタリング パフォーマンス統計を実装します 電子メール/音声/視覚アラートを実装します 幅広い市場の見通しを提供するために、異なるオシレーターを使用して、干渉なしで同じチャートにインジケーターを何度もロードできます。このインジケーターは、次のオシレーターをサポートしています。 RSI CCI MACD オスマ 確率的 勢い 素晴らしい発振器 加速器発振器 ウィリアムズパーセントレンジ 相対活力指数 特に外国為替市場では、
Scalping Lines System MT5 - は、M1-H1の時間枠で金(XAUUSD)を取引するために特別に設計されたスキャルピング取引システムです。 トレンド、ボラティリティ、買われ過ぎ/売られ過ぎの市場分析のための指標を1つのオシレーターに統合し、短期的なシグナルを識別します。 シグナルラインの主要な内部パラメータは事前​​に設定されています。 一部のパラメータは手動で調整可能です。「トレンド波の持続時間」(MAトレンドを使用してトレンド方向の一連のシグナルの持続時間を調整)と「シグナルラインにスムージングを適用」(シグナルラインの生成を調整)です。 始値でシグナルラインを計算する際、インジケーターは再描画されません。他の価格では、シグナル矢印がちらつく場合があります。 シグナルはローソク足が閉じた後に表示され、複数のアラートタイプが用意されています。 推奨される時間枠:M1-M5-M15-M30-H1。 このインジケーターは元々金の取引用に設計されましたが、スプレッドの低いボラティリティの高い資産(BTCや暗号通貨、銀、株価指数CFD(ナスダック100など))の取
トレンドトレーディング は、タイミングのプルバックとブレイクアウトにより、市場で起こっているトレンドから可能な限り利益を得るように設計された指標です。確立されたトレンドの中で価格が何をしているかを分析することにより、取引の機会を見つけます。 [ インストールガイド | 更新ガイド | トラブルシューティング | よくある質問 | すべての製品 ] 自信を持って効率的に金融市場を取引する むち打ちにならずに確立されたトレンドから利益を得る 収益性の高いプルバック、ブレイクアウト、早期の逆転を認識する この指標は、独自の品質とパフォーマンスを分析します 複数時間枠のダッシュボードを実装します インジケーターは再描画されていません 電子メール/音声/視覚アラートを実装します 確立されたトレンドは多くの取引機会を提供しますが、ほとんどのトレンド指標はそれらを完全に無視しています。インジケーターの解釈はかなり簡単です: (1) トレンドの変化 (2) トレンドの方向への後退 (3) トレンドの方向へのブレイクアウト 赤いダッシュ は下降トレンド中の修正です 青いダッシュ は上昇トレンド中
CGE Trading Suite
Carl Gustav Johan Ekstrom
5 (1)
CGE Trading Suite delivers the analytical edge typically reserved for professional trading desks. The platform integrates a full suite of analytical tools into one seamless workflow: dynamic grid mapping, liquidity behavior analysis, ECM, trend lines, MIDAS, trade cycles, and directional channel projections. Together, these provide a unified view of market structure and momentum. Directional clarity is further enhanced by the capital flow index, which measures currency basket strength to identif
まず第一に、この取引ツールはノンリペイント、ノンリドロー、ノンラグの指標であり、プロの取引に理想的ですことを強調する価値があります。 オンラインコース、ユーザーマニュアル、デモ。 スマートプライスアクションコンセプトインジケーターは、新米から経験豊富なトレーダーまで、非常 に強力なツールです。Inner Circle Trader AnalysisやSmart Money Concepts Trading Strategiesなど、20以上の有用な指標を1つに組み合わせています。このインジケーターはスマートマネーコンセプトに焦点を当て、大手機関の取引方法を提供し、彼らの動きを予測するのに役立ちます。 特に、流動性分析に優れており、機関がどのように取引しているかを理解しやすくしています。市場のトレンドを予測し、価格の動きを慎重に分析するのに優れています。機関の戦略とトレードを合わせることで、市場の動向についてより正確な予測ができます。このインジケーターは多目的であり、市場構造を分析し、重要な注文ブロックを特定し、さまざまなパターンを認識するのに優れています。 このインジケーター
Gartley Hunter Multi - An indicator for searching for harmonic patterns simultaneously on dozens of trading instruments and on all possible timeframes. Manual (Be sure to read before purchasing) | Version for MT4 Advantages 1. Patterns: Gartley, Butterfly, Shark, Crab. Bat, Alternate Bat, Deep Crab, Cypher 2. Simultaneous search for patterns on dozens of trading instruments and on all possible timeframes 3. Search for patterns of all possible sizes. From the smallest to the largest 4. All fou
The Institutional Secret Method  represents a paradigm shift in market analysis, moving away from lagging indicators and into the realm of Topological Finance . It is engineered to decode the hidden geometry of price movement by calculating the most efficient path—the Geodesic —between current price action and institutional liquidity targets. The system views the market as a physical landscape where price is naturally drawn toward massive pools of liquidity (Stops). It uses two primary calculati
このインジケーターは、市場で 関心が示されたゾーン をハイライトし、その後に 注文の蓄積ゾーン を表示します。 これは、大規模な**板情報(オーダーブック)**のように機能します。 これは、 巨大な資金 のためのインジケーターです。その性能は卓越しています。 市場にどんな関心が存在していても、 必ず目に見えるようになります 。 (これは 完全に再設計され、自動化されたバージョン です。もはや手動分析は必要ありません。) トランザクションスピード(取引速度) は新しい概念のインジケーターで、市場で大口注文が どこに・いつ 集中しているかを示し、それに基づいたチャンスを提供します。 トレンドの変化を 非常に早い段階 で察知することができます。 FXでは「出来高」と呼ばれているものは誤解されています。実際には、これは 時間あたりの価格変動量 です。したがって、正しい名称は トランザクションスピード です。 考え方・行動・分析の仕方すべてが問われます。 分析パラダイムの転換は非常に重要です。 このインジケーターは、FXにおける出来高の考え方を 根本から再定義 し、論理的な形で正確に活用する、
Super Scalp Indicator MT5  is a unique  trend reversal  100% non-repainting  multi-algo indicator that can be used on all symbols/instruments:   forex,   commodities,   cryptocurrencies,   indices,   stocks .  Super Scalp Indicator MT5  will determine the current trend at its early stages, gathering information and data from up to 10 standard algos When indicator give a valid buy or sell signal, a corresponding arrow will be printed on the chart, open trade at start of the next candle/bar indic
Berma Bands
Muhammad Elbermawi
5 (8)
Berma Bands (BBs) インジケーターは、市場のトレンドを特定して活用したいトレーダーにとって貴重なツールです。価格と BBs の関係を分析することで、トレーダーは市場がトレンド段階にあるか、レンジ段階にあるかを判断できます。 詳細については、[ Berma Home Blog ] をご覧ください。 バーマ バンドは、上部バーマ バンド、中部バーマ バンド、下部バーマ バンドの 3 つの異なる線で構成されています。これらの線は価格の周りにプロットされ、全体的な傾向に対する価格の動きを視覚的に表します。これらのバンド間の距離から、ボラティリティや潜在的な傾向の反転についての洞察を得ることができます。 バーマ バンドの線がそれぞれ離れると、市場が横ばいまたはレンジ相場の期間に入っていることを示すことがよくあります。これは、明確な方向性の偏りがないことを示しています。トレーダーは、これらの期間中にトレンドを特定するのが難しいと感じる可能性があり、より明確なトレンドが出現するまで待つ場合があります。 バーマ バンドの線が 1 本の線に収束すると、強いトレンド環境の兆候となること
Ultimate SMC Indicator
Hicham Mahmoud Almoustafa
1 (1)
ULTIMATE SMC INDICATOR — PRO EDITION     Trade Like Institutional Traders Are you tired of losing trades because you don't  know WHERE the big money is positioned? The Ultimate SMC Indicator reveals the hidden  footprints of banks and institutions directly on  your chart — giving you the edge that professional  traders use every day. WHAT IS SMC
1. Tool Description The   Dynamic Liquidity HeatMap Profile   is an advanced technical indicator originally designed by BigBeluga (Pine Script) and ported to MQL5. Unlike a standard Volume Profile which shows where volume   has   occurred, this tool attempts to visualize where liquidity (limit orders and stop losses) is   likely waiting   (resting liquidity). It works by identifying pivots (local highs and lows) weighted by volume and ATR.   Crucially, if price moves through a level, that liquid
Quantum Entry は、トレーダーの間で最も人気があり広く知られている戦略の一つである「ブレイクアウト戦略」を基に構築された、強力なプライスアクション取引システムです!このインジケーターは、主要なサポート(支持線)とレジスタンス(抵抗線)ゾーンのブレイクアウトに基づいて、明確な買いと売りのシグナルを生成します。一般的なブレイクアウトインジケーターとは異なり、高度な計算を用いてブレイクアウトを正確に確認します。ブレイクアウトが発生すると、即座にアラートを受け取ることができます。 ラグなく、再描画なし :すべてのシグナルはリアルタイムで提供され、ラグがなく、過去のシグナルが再描画されることもありません! 推奨事項 Quantum Entryは、あらゆる通貨ペア・銘柄、あらゆる時間軸で動作します。私たちは個人的にこのインジケーターを   XAUUSD(金)   の   M1、M5、M15   時間軸で使用しています! あなたのトレーディングスキルを向上させるチャンスを逃さないでください。今すぐ Quantum Entry を手に入れ、自信と精度を持った取引を始めましょう! MT4 v
スイングトレーディング は、トレンドの方向のスイングと可能な反転スイングを検出するように設計された最初のインジケーターです。トレーディングの文献で広く説明されているベースラインスイングトレーディングアプローチを使用します。インディケータは、いくつかの価格と時間のベクトルを調査して、全体的なトレンドの方向を追跡し、市場が売られ過ぎまたは買われ過ぎて修正の準備ができている状況を検出します。 [ インストールガイド | 更新ガイド | トラブルシューティング | よくある質問 | すべての製品 ] むち打ちを起こさずに市場スイングの利益 インジケーターは常にトレンドの方向を表示します 色付きの価格帯は機会のベースラインを表します 色付きのダッシュは、可能な反転スイングを表します この指標は、独自の品質とパフォーマンスを分析します 複数時間枠のダッシュボードを実装します カスタマイズ可能なトレンドおよびスイング期間 電子メール/サウンド/プッシュアラートを実装します インジケータは再描画またはバックペインティングではありません Swing Tradingとは Swing Tradingは
作者のその他のプロダクト
The indicator is designed for index trading mainly for Boom Crash Well detects long movements You can open trades from signal to signal against surges on long movements It can also be configured to detect surges, but for this it is recommended to use additional filters such as support and resistance levels, it goes well with them This indicator is well suited as a basis for creating a good trading strategy for indices.
Indicator for trend trading Doesn't redraw The algorithm uses reliable and proven time indicators It is recommended to use with common manufacturer's filters as resistance support levels Or standard Bollinger Bands or ZigZag indicators It can also be combined with the RSI indicator to determine whether a currency pair or index is overbought or oversold. The indicator is designed to work on small timeframes from m1 to m15
The indicator is designed for binary options trading You can also scalp with it. It is recommended to enter the trade on the next candle after the signal The indicator does not redraw does not recalculate Works well on indexes Like Boom and Crash Indicator signals need to be filtered, this can be done using support and resistance levels Or use standard indicators for filtering such as Bollinger bands
フィルタ:
レビューなし
レビューに返信