 MetaTrader 5
 エキスパート
 インディケータ
 ライブラリ
ライブラリ
 ユーティリティ
 ウィジェット
 ルール
ルール
YouTubeにあるマーケットチュートリアルビデオをご覧ください
ロボットや指標を購入する
仮想ホスティングで
EAを実行
EAを実行
ロボットや指標を購入前にテストする
マーケットで収入を得る
販売のためにプロダクトをプレゼンテーションする方法
MetaTrader 5のための新しいテクニカル指標 - 168
 テクニカル指標からのシグナルは、株式および外国為替市場での取引の開始と終了に重要な役割を果たします。指標の本質は、将来の価格変動を予測することを目的とした金融銘柄価格の数学的変換です。
テクニカル指標をテストして、市場の動きとそれからの利益をより正確に予測します。
テクニカル指標からのシグナルは、株式および外国為替市場での取引の開始と終了に重要な役割を果たします。指標の本質は、将来の価格変動を予測することを目的とした金融銘柄価格の数学的変換です。
テクニカル指標をテストして、市場の動きとそれからの利益をより正確に予測します。 
Indicator ICT Implied Fair Value Gap (IFVG) is an important part of the Smart Money Concepts (SMC) system. It looks for and shows on the chart a modern pattern - the Fair Value Gap ( FVG ). This pattern is a three candlestick imbalance formation based on the discovery of a mismatch between supply and demand. This happens when the price moves quickly in one direction without encountering resistance. The result is a "gap", which can be filled in later. The indicator finds this pattern using the up
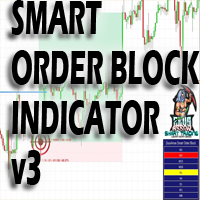
Please send me Direct message on MQL5 CHAT after purchasing the Indicator for Training and Installation Support There are some additional files that is important to use with the Indicator . So be sure to contact me after purchasing the Indicator So that I can add you for training and support .
If you find any difficulty with installation then send me Direct message here So that I can connect with you via Anydesk or Teamview for the product installation. " Smart Order Block Indicator " to find m

You can change the time period of the chart at the touch of a button. You can also change multiple charts at the touch of a button. You can also change multiple charts at the touch of a button, saving you the trouble of changing time periods.
We are live-streaming the actual operation of the system. Please check for yourself if it is usable. Please check it out for yourself. https://www.youtube.com/@ganesha_forex
We do not guarantee your investment results. Investments should be made at you
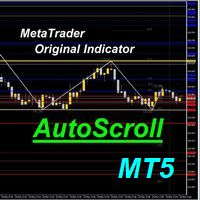
AutoScroll automatically scrolls the chart by the set width (pips). You can see the next milestone without having to operate the chart yourself. You can concentrate on trading.
We are live-streaming the actual operation of the system. Please check for yourself if it is usable. Please check it out for yourself. https://www.youtube.com/@ganesha_forex
We do not guarantee your investment results. Investments should be made at your own risk. We sharll not be liable for any disadvantage or damage c
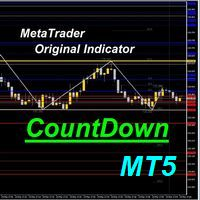
The time until the end of the bar is counted down. Therefore, you can time your order while watching the chart. You can concentrate on your trading.
We are live-streaming the actual operation of the system. Please check for yourself if it is usable. Please check it out for yourself. https://www.youtube.com/@ganesha_forex
We do not guarantee your investment results. Investments should be made at your own risk. We sharll not be liable for any disadvantage or damage caused by the use of the info
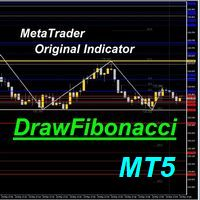
Fibonacci automatically draws Fibonacci retracement, Because Fibonacci automatically draws Fibonacci retracement, you can know at a glance the price to buy at a push or sell back. Therefore, you can trade in favorable conditions in a trending market.
We are live-streaming the actual operation of the system. Please check for yourself if it is usable. Please check it out for yourself. https://www.youtube.com/@ganesha_forex
We do not guarantee your investment results. Investments should be made
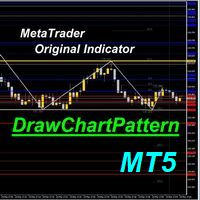
The chart pattern is automatically drawn. It also automatically tells you the price at which you are most likely to buy or sell according to the pattern. Therefore, there is no need to memorize patterns or draw lines by yourself.
* The "WhaleFinder" includes four indicators ("DrawTurningPoint", "DrawHurdle", "DrawChartPattern", "DrawFibonacci"). so, Please be careful not to purchase more than one copy (duplicates).
We are live-streaming the actual operation of the system. Please check for yo
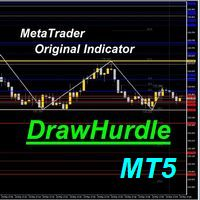
The system automatically draws resistance and support lines, The system automatically draws resistance and support lines, so you can see at a glance the price range where you are most likely to encounter resistance. Therefore, you can trade in price zones where you are less likely to encounter resistance.
We are live-streaming the actual operation of the system. Please check for yourself if it is usable. Please check it out for yourself. https://www.youtube.com/@ganesha_forex
We do not guaran
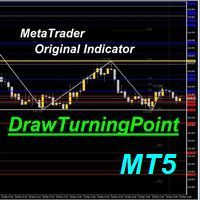
Based on the Dow Theory, the system automatically draws a turning point, which is the starting point for buying or selling. It also automatically tells you whether the market is in a buying or selling condition and recognizes the environment. It is also a good tool to prevent false trades and to make profitable trades.
We are live-streaming the actual operation of the system. Please check for yourself if it is usable. Please check it out for yourself. https://www.youtube.com/@ganesha_forex
We
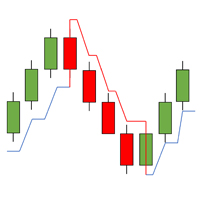
The TrendLinePro indicator for MetaTrader 5 creates a trend line based on the last candle highs and lows. The number of candles to be used to determine the direction can be selected yourself. The trend line can also be used to set an SL. Changes in trend directions can optionally be displayed with an arrow. Input Parameters: Number of Candles for Distance: 3 Display Direction Changes Arrows: false
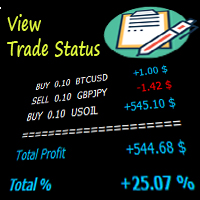
This indicator will help you have a better visualization of the status of your open trades. You can see profits or losses in USD or %, as well as a total of all trades and the percentage of profit or loss according to your account size. You can change the font size and color. I hope you find it useful and it makes monitoring your trades easier. This indicator adjusts to the size of your screen and will be positioned in the bottom right corner of your screen for better convenience.
Indicator details The Moving Average Retracement Boundaries(M.A.R.B) shows the average retracement level above or below the given moving average.It shows the first upper boundary (which is the average retracement above the moving average ),the second upper boundary (which is double the first upper boundary),the first lower boundary (which is the average retracement below the moving average) and the second lower boundary (which is double the first lower boundary).
How to use it 1.It can be used
FREE

it depends on ATR period to get swing points to help make better trading decisions blue dot and red dot is the default color scheme of course you can change it later if you'd like you can change the following : ATR PERIOD sending notifications number of times to send notifications sending notifications to your smart phone that's it very simple to use just drag and drop and follow the trend
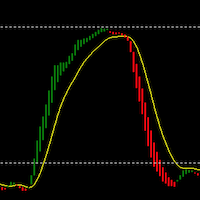
BestPointOfInitiation是一个很好的短线交易指示器,能与 ShortBS ( https://www.mql5.com/zh/market/product/96796 )完美的配合,可以很好的指出最佳的buy和sell位置,指标不含有未来函数,不会重新绘制,不仅能够应用到自己的手动交易过程中,还能完全可以写入到自己的EA中。(如果你感觉到这个指标能够帮助你进行更准确的交易,请帮忙给个好评,希望我的作品能够帮助更多多有需要的人) ===================参数列表===================== fastPeriod: 9 slowPeriod:30 PassivationCoefficient:5 =================参考使用方法=================== 此指标可以适用于任何交易品种,能够用在任何周期。

it depends on channels and moving average in sketching the chart in two colors the default colors are gold and light blue to highlight the area of downtrend and the area of uptrend TO ADJUST THE INDICATOR YOU CAN CHNGE THE FOLLOWING: 1- the look back period which affects the length of the moving average 2- the multiplier which affects the point of swing in the trend 3- the channel shift which affects how close the line is moving to the price the default settings are the best for the indicator B
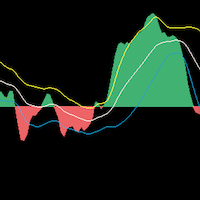
TradingDirection是一个针对中长线交易的趋势指标。在图上你能很清晰的看到什么时候是上涨趋势,什么时候是下跌趋势,同时在趋势中,你能看到很明显的补仓位置和减仓位置。同时它与 BestPointOfInitiation( https://www.mql5.com/zh/market/product/96671 )指标可以形成完美的配合,两个指标相互配合更能很好的把握开单时机。 ===================参数列表===================== fastPeriod: 9 slowPeriod:30 PassivationCoefficient:5 =================参考使用方法=================== 此指标可以适用于任何交易品种,能够用在任何周期。
This is a modern MACD indicator based on regular MACD indicator. It also has alert system included. This indicator gives you alerts when base line of MACD indicator crosses above or below Zero level so you can look for Buy or Sell opportunity. Available Alerts: 1. Audible Alerts on Chart / Trading Terminal window. 2. Alerts on your email. 3. Alerts on your mobile phone. Type of Alerts Explained: 1. Audible_Chart_Alerts - Audible alerts and Popup message on your computer’s tr
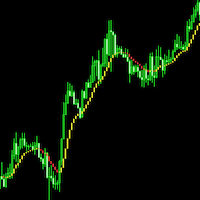
ShortBS是一个很好的短线交易指示器,能很好与 BestPointOfInitiation ( https://www.mql5.com/zh/market/product/96671 )配合,能让你找到最合适的buy和sell位置,指标不含有未来函数,不会重新绘制。是一个针对(如果你感觉到这个指标能够帮助你进行更准确的交易,请帮忙给个好评,希望我的作品能够帮助更多有需要的人) ===================参数列表===================== maPeriod: 25 slowPeriod:20 fastPeriod:10 stepPeriod:5 =================参考使用方法=================== 此指标可以适用于任何交易品种,能够用在任何周期。
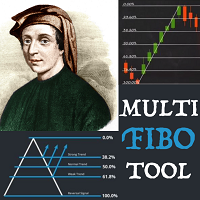
Multi Fibonacci Tool for MT5. User can set up to 5 different Fibonacci Retracements. Save & Load.
Simple settings. Style, line width, colors. Available ray function for all.
Application creates simple and functional panel on the chart (5 buttons for 5 Fibo retracements and DEL button to clear chart from drawn retracements).
Position Point and Range inputs allow to place Fibonacci retracements in the right place on the chart.
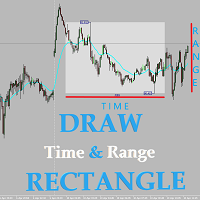
This useful tool helps to draw rectangle - range of price between two points of time for many days. For all trading instruments.
User set start time (Start Hour, Start Min), end time (End Hour, End Min) and number of days to draw a rectangle. Indicator draw a rectangle marking highest and lowest price in set period of time. Below the rectangle it shows range between MAXprice and MINprice in pp.
This tool is almost irreplaceable when you play strategy based on overnight price move (for example:
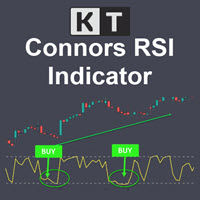
KT Connors RSI is a modified and more advanced version of the original Connors RSI developed by Larry Connors. It was designed to help traders generate trade signals based on short-term price movements.
The Connors combine the standard RSI calculation with two additional elements: a short-term RSI, ROC, and a moving average.
Features Provides more transparent and more actionable buy and sell signals using the overbought/oversold zones. Incorporates short-term RSI and moving average, providing
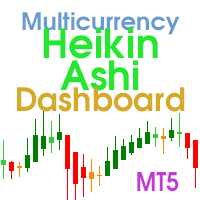
Multi-currency and multitimeframe Heikin Ashi indicator. Shows the current state of the market. On the scanner panel you can see the direction, strength and number of bars of the current trend. The Consolidation/Reversal candles are also shown using color. You can specify any desired currencies and periods in the parameters. Also, the indicator can send notifications when the trend changes or when reversal and consolidation candles (dojis) appear. By clicking on a cell, this symbol and period wi

時間を節約し、より正確な意思決定を Sweet VWAP で このツールのパワーをテストしたい場合、 MetaTrader 5 用の無料のアンカード VWAP インディケーター をダウンロードできます。 このインディケーターは独立して動作するだけでなく、無料版 Sweet VWAP の拡張機能でもあります。 無料版をクリックすると、マウスポインターで見える VWAP が固定されます。そして、固定されるのはこのインディケーターであり、その機能をすべて備えています。 このインディケーターは Sweet VWAP と完全に統合されています。これは MetaTrader 5 用の無料のアンカード VWAP インディケーターです。 機能 アンカーする時間 これは VWAP をアンカーしたいローソク足です。これは Sweet VWAP(無料版)が自動的に行います。チャートでクリックするだけです。 取引量の種類 取引量の種類を選択するか、自動にしておくことができます。自動の場合、ブローカーがこの情報を提供している場合、取引アセットの実際の取引量を優先して使用します。 VWAP の平滑化メソッド 単純

この指標は、1 日のうちで最大の取引活動の時間を決定するように設計されています。 この計算の後、インジケーターは最も重要な取引レベルを構築します。 これらのレベルを実際の値動きと比較することで、市場トレンドの強さと方向性に関する情報を得ることができます。
指標の特徴 時間枠は D1 未満である必要があります。 推奨される時間枠: M15、M30、および H1。 H1 を超える時間枠は、非常に大まかな状況を示す可能性があります。 また、M15 未満の時間枠を使用すると、取引が短期間で急増する可能性があります。 指標は過去のデータに敏感です。 したがって、チャート ウィンドウに少なくとも 50,000 バーを設定することをお勧めします。
指標パラメータ 基準 - 取引活動を計算するための基準期間を設定します。 day - 取引活動は、時刻を考慮して計算されます。 week – 取引活動は、時刻と曜日を考慮して計算されます。
Width - 線幅。 ClrMean、ClrUp、および ClrDn は、中間、上位、および下位の取引レベルの色です。 Style1 - Style5 – 取
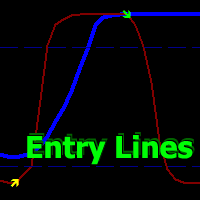
Volatility Trend System - a trading system that gives signals for entries. The volatility system gives linear and point signals in the direction of the trend, as well as signals to exit it, without redrawing and delays. The trend indicator monitors the direction of the medium-term trend, shows the direction and its change. The signal indicator is based on changes in volatility and shows market entries.
The indicator is equipped with several types of alerts. Can be applied to various trading ins
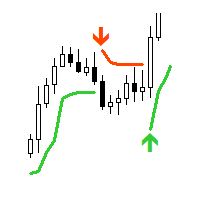
"AV SuperTrend MT5" is an indicator for MetaTrader 5. The supertrend indicator is popular for determining the trend and positioning stops or as trailing support. I use this indicator in several expert advisors for trend analysis.
Supertrend indicator signals can be selected in the form of entry arrows and notifications, as well as various sounds.
Settings:
- Period
- Multiplier
- Alert buy signal: arrow color
- Alert sell signal: arrow color
- Alert yes/no
- Sound: choice or no
- Email yes/

uGenesys AI - 90% Accurate Daytrading Indicator
Introducing the ultimate forex trading indicator system, uGenesys AI, powered by cutting-edge AI technology and advanced analytical techniques, including Time-Series Analysis and Genetic Algorithms. Our AI-powered trading system leverages the power of time-series analysis to identify trends and patterns in historical price data, allowing traders to make informed predictions about future market movements. By analyzing vast amounts of data, our syst
Introducing "Congestion Breakout MT5" - the indicator that helps you identify congestion zones in your chart and alerts you when the price breaks through them. Traders know that congestion zones can be key areas of price action and can indicate potential turning points in the market. However, spotting these zones and anticipating breakouts can be a difficult and time-consuming task. That's where "Congestion Breakout" comes in. This powerful indicator uses advanced algorithms to analyze the pri

A heatmap is a graphical representation of data in two dimensions, using colors to display different factors. Heatmaps are a helpful visual aid for viewers, enabling the quick dissemination of statistical or data-driven information. The MP Heatmap indicator provides a graphical representation of the relative strengths of major currencies compared to others, organizing data from pairs into color-coded results and producing a clear overview of the entire Forex market. The MP Heatmap indicator dis
FREE

The euro index on your chart, built live from your own broker's five euro pairs. When EURUSD falls you cannot tell from EURUSD alone whether the euro is weak or the dollar is strong. An index answers it. Put this under any chart and you are looking at the euro on its own terms, measured against the pound, the yen, the franc and the krona as well as the dollar. It uses the New York Board of Trade Euro Currency Index formula. EUR/USD 31.55% EUR/GBP 30.56% EUR/JPY 18.91% EUR/CHF 11.13% EUR/SEK 7.85
FREE
This is a simple arrow system based on MACD indicators Main/Base line and MACD Levels. It gives you alerts when MACD's Main Line crosses above/below certain level. Which type of alerts available? 1. It paints on chart Up/Down Arrows. 2. Popup message and sound alert in trading terminal window. 3. Push notification or Alert on your android and ios mobile phones (requires MT4 or MT5 app installed!)

Simple supply and demand indicator which should help identify and visualize S&D zones. Settings:
Color for supply zones, color for demand zones - default colors are set for dark (black) background.
Number of how much zones should be created above and below current price - value "3" means there will be 3 zones above current price and 3 zones below current price. Principle:
When price creates "V", reversal zone is registered. Rectangle filled based on zone type (supply / demand) is drawn if price
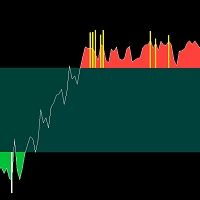
BS Trend Line是一款很好的买卖指示器,不含有未来函数,不会重绘,新版本已经加入了更好的过滤算法,开单成功率有了很大的提高,是一个很好的波段交易提示器,尤其是配合 SourcePoint 会有更明显的效果,它能帮你过滤掉接近70%以上的无效交易信号。 ===================参数列表===================== timeframe:M1
gip:30 sip:6 up line:80 down line:20 ===================使用方法===================== 配合 SourcePoint 使用时, SourcePoint 的参数 fastP: 96
slowP:208 avgP:72

This is a simple arrow system based on Engulfing Candlestick Pattern. It gives you alerts on your smartphone when there is an engulfing candlestick pattern happens. Which type of alerts available? 1. It paints on chart Up/Down Arrows. 2. Popup message and sound alert in trading terminal window. 3. Push notification or Alert on your Android and IOS mobile phones (requires MT4 or MT5 app installed!) *Note: Use it on higher timeframes like H4 (4 hours), D1 (1 Day) then find trade opportunities on s

Displays trends in current chart. You can display trends of multiple timeframes in one chart by inserting this indicator as often as you want. Key features: displays trend line by finding highs and lows counts number of high/low of current trend in different color (long/short) allows you to display multiple timeframe trends in one chart Settings: Indicator Name: if you want to show M5 and H1 on one chart add TITrend twice to your current chart and rename M5 to "TITrendM5" and H1 to "TITrendH1" C
It is important that the indicator works only in the charts of Japanese candlesticks and bars. So, this indicator is ideally combined with price pattern analysis Price Action and is used in classic Japanese candlestick analysis This forecasting tool consists of three elements: Price flip is a signal of a potential reverse. Setup filters out the signals, that is, it identifies where a new trend starts and when there is only a correction within the current trend. Countdown calculates the tre
非常にシンプルですが効果的なインジケーターです。
これは一目指標の基準線に基づいており、それに基づいて移動平均 MA が構築されます。これら 2 つの線が交差すると、売買のシグナルが発生します。私はトレードに KijunSen インジケーター ラインをよく使用します。価格がこのラインを上回っている場合は買いのみに焦点を当て、下にある場合は売りに重点を置きます。
さらに、基順線を平均して基順線移動平均を作成すると、これらの線の主な交点が重要になり、より明るく信頼性の高い取引シグナルが得られます。これらの交点は機会を示すだけでなく、市場で賢明な意思決定を行うための触媒としても機能し、トレーダーが明確かつ自信を持って変化を認識できるようにします。その結果、基準線は単なるツールではなく、金融変動の海における導きの星となるのです。
インジケーターのMT4バージョンへのリンク:
https://www.mql5.com/ru/market/product/96120
インジケーターパラメーター:
基準線 - 基準線の計算期間。
KijunSen_MA - KijunSen MA の
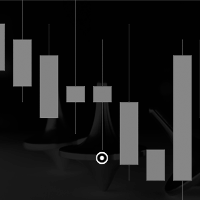
Real Spinning Top Indicator
It detects accurate spinning top on chart with balanced body and wick height ratio which is the true meaning of spinning top which differs it from Hammers and Doji or Null Candlestick.
This indicator plots an wingdings icon at number of spinning tops found on the chart.
Settings include
Number of Bars : To adjust search on number of bars
Color of Icon :change color of icon
Icon code : change code of wingdings for icon
FREE
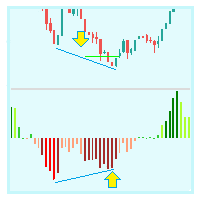
VWAP バンド ビジュアル スタイル 1.0 金融市場指標は、トレーダーや投資家が金融市場で分析および意思決定を行うために使用する不可欠なツールです。 VWAP とボリンジャー バンドは、トレーダーが市場のトレンドと価格の変動性を測定するために使用する 2 つの人気のあるテクニカル分析ツールです。この製品では、2 つの指標を組み合わせて、市場の動向とボラティリティを包括的に分析する独自の製品を作成することを提案します。この製品は、データ主導の分析に基づいて情報に基づいた意思決定を行いたいトレーダーや投資家にとって理想的です。
発散戦略は、トレーダーが市場の潜在的なトレンド反転を特定するために使用する一般的なテクニカル分析手法です。この戦略は、価格の動きとテクニカル指標の間の相違を特定することに依存しています。このセクションでは、ビジュアル スタイルとボリンジャー バンドを使用した発散戦略について説明します。
たとえば、ビジュアル スタイルとボリンジャー バンドを使用した発散戦略は、トレーダーが市場での潜在的なトレンド反転を特定するために使用する一般的なテクニカル分析手法です。こ

CZSC フラクタル型インデックス
特徴:
包含関係の徹底処理を実施
上下分類かどうかの判断にはEAコールを利用すると便利で、「株の教え93 2つのテーブルとトレンド構造の内部の関係2」でステータスを判断すると便利です。
上下の分類を矢印で表示
可能なペンをさまざまな色で表示する
隣接する 2 つの K ラインの包含関係は次のように定義されます。K ラインの最高点と最低点はすべて隣接する K ラインの範囲内にあり、この K ラインと隣接する K ラインは包含関係です。
K-lineチャートでは、関係のあるK-lineをよく見かけますが、包含関係にある2本のK-lineを1本のK-lineにまとめる、いわゆる包含処理です。
定義: 3 つの連続した K ラインを含めて処理したもので、中央の K ラインの高点が最も高い場合、この組み合わせはトップ タイプと呼ばれます。
定義: 包含処理後の 3 つの連続した K ラインで、中央の K ラインの最低点が最も低い場合、この組み合わせはボトム タイプと呼ばれます。
EA によって呼び出されるインジケーターの配列:
0.合併
The SD Indicator is a powerful tool in the world of Forex trading, that combines two classical strategies: Support/Resistance levels and Supply/Demand zones. The indicator helps traders to identify potential trading opportunities in the market with high accuracy.
Support and resistance levels are key price levels where buying and selling pressure converge, leading to potential price reversals. The SD Indicator identifies these levels in real-time and provides traders with a clear picture of whe
** All Symbols x All Timeframes scan just by pressing scanner button ** *** Contact me to send you instruction and add you in "Channel Scanner group" for sharing or seeing experiences with other users. + FREE Trading Utility MT5 Introduction: The Channel pattern is described as the area located between two trend lines. This area is used for a measure of a trading range. In this case, the upper trend line connects price highs while the lower trend line connects price lows. Also when it
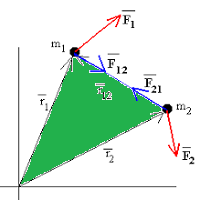
Sobre la base del concepto físco de "Cantidad de Movimiento" construimos este indicador/oscillador, que pretende darnos idea de entradas y salidas en el mercado. En mecánica clásica, la cantidad de movimiento se define como el producto de la masa del cuerpo (volumen) y su velocidad (rapidez con la varía el precio) en un instante determinado. p=M*V Se trata de un indicador/oscilador que pretende identificar momentos de entrada y salida basados en la fuerza o presión a ambos lados del preci

This indicator emulates volume delta (buy trades vs sell trades) based on per candle volume and candle shape (direction, size of body and wicks). Artificially separated buy and sell volumes then accumulated for specified number of bars. The indicator shows a histogram of volume delta per bar, as well as a sum of the delta for the given period. What is more important, the indicator allows you to combine current symbol quotes/volumes with quotes/volumes of other related symbols (futures, indices,
FREE

iHegde MA cross is a MultiTimeFrame Indicator which works by intersection of two moving averages
Signals- the indicator generates signals in the form of arrows when the intersection between short and long moving average occurs
Features 1. Works on All Time Frame 2. Works on All scripts, Index, Forex 3.No repainting 4. Smoothed for better appearance
Settings 1.Moving averages-short and long 2. Arrow-size 3. Colour customization 4. Alerts/Push/Email
Note: The signals are indicative of possibl
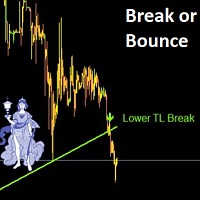
Trade like a pro and never miss Break or Bounce of a Support or Resistence Line
Get alert and suggested Trading points (entry, TP1, TP2 and SL) whenever there is a break of - Break or Bounce from Pivot Point Support or Resistence - Break or Bounce from a Trendline (upper and lower Trendline) - High and Low of a previous period Any suggestion on other types of Support / Resistence to add are more than welcome
As well as SuperTrend, SuperTrend Alerts offers alerts . You can also get alerts with SuperTrend Alerts . Besides SuperTrend, SuperTrend Alerts also offers alerts . SuperTrend Alerts offers alerts along with SuperTrend . In addition to SuperTrend, SuperTrend Alerts has alerts . Also , SuperTrend Alerts offers alerts . The SuperTrend Alerts add-on works with SuperTrend as well. As well as SuperTrend, SuperTrend Alerts has alerts too .
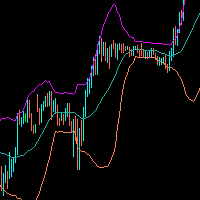
Bollinger Bands are a technical analysis tool that consists of a set of three lines plotted on a price chart. The middle line is a simple moving average, usually of 20 periods, and the upper and lower lines represent the standard deviation of the price from the moving average. The upper band is calculated by adding two standard deviations to the moving average, while the lower band is calculated by subtracting two standard deviations from the moving average. This creates a band around the moving

Smart Tape - это индикатор ленты всех сделок с возможностью агрегации по цене и времени и фильтрацией по величине объема, включает в себя два отключаемых варианта отображения. Вариант 1: перемещаемое окно по графику со списком сделок (Time Sales). Список обновляется сверху вниз и не имеет возможности просмотра истории. Количество отображаемых строк выбирается пользователем. Порядок отображения в строке: время с точностью до миллисекунд, тип сделки (B - покупка или S - продажа
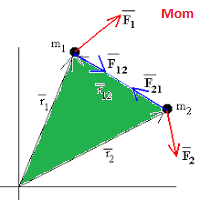
Indcador/Oscilador basado en el concepto de la física clásica, "Cantidad de movimiento". Fácilmente adaptable a diferentes pares y activos, como a períodos de time frame. Los parámetros de entrada son los que siguen, y pueden modificarse por el usuario: TrendPeriod = 14; // Trend period Smooth = 3; // Smoothing period TriggerUp = 0.05; // Trigger up level TriggerDown = -0.05; // Trigger down level
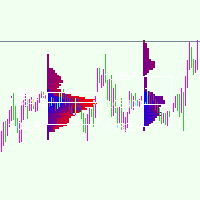
A Market Profile (time price opportunity) implementation with an option to mark a point of control (POC) based on volume .
Config: Hide default candles. Select a session time using exchange timezone. Experiment with tick multiplier value to achieve desired level of detail. Choose the symbols of your choice, e.g. squares or A-Z chars. For multiple sessions you will have to add additional instances of this script with a different time configuration.
Limitations: TradingView has a hard limi
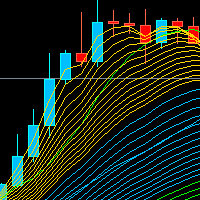
The Rainbow Multiple Moving Average (MMA) is a technical analysis tool used to identify trends and potential reversal points in financial markets. It is based on a system of moving averages that are designed to be used together, with each moving average having a different time frame. The Rainbow MMA consists of multiple exponential moving averages (EMAs) of different lengths, with each EMA plotted in a different color. Typically, the Rainbow MMA includes EMAs of 2, 3, 4, 5, 6, 7, 8, 9, 10, 11, a
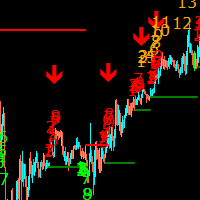
The Sequential Ultimate Indicator is a modified version of the Ultimate Oscillator that adds a sequential component to the calculation. It is designed to identify potential trend reversals by looking for divergences between the price action and the oscillator. The Sequential Ultimate Indicator works by adding a sequential count to the Ultimate Oscillator readings. The sequential count starts at 1 when the oscillator moves above 70 or below 30 and continues until a price reversal occurs. The sequ

Profesyonel iş hayatı boyunca sızma testleri ve güvenlik danışmanlığı konusunda birçok firmaya hizmet veren Tekno Fatih, web uygulama, mobil uygulama, network&sistem, kablosuz ağ gibi birçok alanda sızma testleri yapmış olup siber olaylara müdahale, ddos testleri ve kaynak kod analizi projelerinde de yer almıştır. Siber güvenlik alanında birçok konferansta yerini almıştır. Amerika Savunma Bakanlığına bağlı olan NSA.gov ( Ulusal Güvenlik Teşkilatı )'inde ve NGA.mil ( Ulusal Coğrafya-İstihbarat T
向けられます。 ワーキング チャートでは、古い期間から受け取ったレベルも表示されます。 レベルの表示とそのプロパティは、インジケーター設定で設定されます。 になった期間のレベルは、通常、優先度が高くなります。 各レベルには、レベルに関する必要な情報を含むツールチップがあります。 平均範囲値 (ATR) は、実際のレベルを取得するために使用されます。 ティックとリアル (利用可能な場合) の両方のボリューム値を使用できます。 ボリュームインジケーターは、インジケーター「The Better Volume Indicator」で実装されたアイデアに基づいています。 インディケータ アルゴリズムは、現時点で機能するように適合されており、履歴データの分析を目的としたものではありません。 表示されたイベント VCU - 大きなバー範囲でのボリュームアップのクライマックス VCN - 大きなバー範囲で中立的なボリュームのクライマックス VCD - 大きなバー範囲でのボリュームダウンのクライマックス HVC - 低バー範囲での高ボリューム VCHVC - VCU、VCN、VCD の組み合わせ L
この指標は 2 つの期間で動作し、作業チャートに直接波を視覚的に表示し、水平波レベルを表示します。 ZigZag インジケーターは、価格チャートの重要なトップとボトムを目に見える傾斜線で結び、波の動きを認識しやすくし、波をレベルごとに範囲に分割します。 極値は、 HighLow 価格または Close 価格を使用して計算されます。 波のレベルは次の波に投影され、サポート / レジスタンスのレベルを取得できます。 レベルは、フィボナッチ アルゴリズムまたは線形関係を使用して計算されます。 になった期間のレベルは、通常、優先度が高くなります。 各レベルには、レベルに関する必要な情報を含むツールチップがあります。 ZigZag インジケーターの特徴は、資産の価格の変化が以前の値の変化を引き起こす可能性があることです。これは、そのようなレベルにのみ基づいて取引の決定を行う際に考慮に入れる必要があります。 ただし、このようなレベルでは、方向を変更したり、動きを遅らせたりする可能性のある相場や価格値の動きの方向について判断を下すことができます。 インディケータ アルゴリズムは、現時点で機能する

Dual Striker - ゴールド取引向けの新しいEAです。 ライブシグナル +150% -> リアル口座 マーチンゲールなし、ナンピンなし お使いの取引プラットフォームで無料テスト: Dual Striker EA Universal Box は、チャート上に価格帯をプロットし、後に価格帯ブレイクアウトで取引するために使用することができます。このインディケータを適用できる戦略はたくさんあります。 このインディケータは、デフォルトで アジア、ヨーロッパ、アメリカの取引セッション の範囲をチャートにマークするように設定されています。レンジは長方形で表示され、その境界線は取引セッションの開始時刻と終了時刻、およびその期間の最高値と最低値のレベルとなっています。
インジケーターの設定は非常にシンプルです。
Time Open - 取引セッションの開始時刻 Time Close - 取引セッションが終了した時刻 Box color - 矩形の色 インジケーターには4つの価格帯を設定することが可能です。 On Box パラメータを使用して、各価格帯の表示の有効・無効を
FREE

MetaForecastは、価格データのハーモニクスに基づいて、どんな市場の未来を予測し視覚化します。市場が常に予測可能ではありませんが、価格にパターンがある場合、MetaForecastは可能な限り正確な未来を予測できます。他の類似製品と比較して、MetaForecastは市場のトレンドを分析することでより正確な結果を生成することができます。
入力パラメータ Past size (過去のサイズ) MetaForecastが将来の予測を生成するために使用するバーの数を指定します。モデルは選択したバー上に描かれた黄色の線で表されます。 Future size (将来のサイズ) 予測すべき将来のバーの数を指定します。予測された将来は、ピンクの線で表示され、その上に青い回帰線が描かれます。 Degree (程度) この入力は、MetaForecastが市場で行う分析のレベルを決定します。 Degree 説明 0 Degree 0の場合、価格の全てのピークや谷、そして詳細をカバーするために、「Past size」の入力に大きな値を使用することが推奨されています。 1 (推奨) Degre

価格波形パターン MT5へようこそ --(ABCD パターン)-- ABCD パターンは、テクニカル分析の世界で強力で広く使用されている取引パターンです。
これは、トレーダーが市場での潜在的な売買機会を特定するために使用する調和的な価格パターンです。
ABCD パターンを使用すると、トレーダーは潜在的な価格変動を予測し、いつ取引を開始および終了するかについて十分な情報に基づいた決定を下すことができます。 EA バージョン: Price Wave EA MT5
MT4バージョン: Price Wave Pattern MT4
特徴 :
ABCDパターンの自動検出。
強気パターンと弱気パターン。
任意のシンボルと任意の時間枠で機能します。 主要なレベルと価格目標。
カスタマイズ可能な設定と繊維レベルの調整。 アラートと通知。 今後 さらに多くの 機能が追加される 予定です 。
FREE

Trend Monitor VZ – トレンド構造に基づくマーケットモニター。 複数の銘柄を分析していると、トレンド方向を確認するだけでも多くの時間がかかることがあります。
Trend Monitor VZ は、その情報を1つのパネルに集約し、複数の銘柄と時間足のトレンド方向を同時に表示します。
市場全体をひと目で把握
チャート上にマーケットモニターが表示され、選択した銘柄と時間足のトレンド方向を確認できます。 トレンド方向は市場構造に基づいて判定されます: HH + HL → 上昇トレンド LH + LL → 下降トレンド 個別のチャートを1つずつ確認する代わりに、市場全体の状況を瞬時に把握できます。
全銘柄のトレンド確認を5分から5秒へ 市場分析で最も時間を取られる作業の一つが、トレンド方向を判断するために銘柄や時間足を何度も切り替えることです。 Trend Monitor VZ は、この作業をわずか数秒に短縮します。 1つのパネルで次のことが可能になります: 数十の銘柄を同時に監視する; 複数の時間足のトレンド方向を確認する; 日々の市場分析をより迅速に行う; 手作業を減らし

MT4 Version Order Blocks ICT Kill Zones SMT Divergences ICT Breakers
The ICT Breakers indicator is a powerful tool for traders looking to gain an edge in the market. This indicator is based on the order flow and volume analysis, which allows traders to see the buying and selling pressure behind the price action. This information can be extremely valuable in identifying key levels of support and resistance, as well as potential turning points in the market. Breaker blocks are areas where in
Supply or demand zones refer to price areas where a significant amount of supply or demand had previously entered the market, causing prices to either fall or rise. If the price returns to the demand or supply zone, it is likely to bounce off due to the large number of orders previously placed within the zone. These orders will be defended in these areas.
The Fair Value Gap (FVG) is a concept used to identify imbalances in the equilibrium of buying and selling. Fair Value Gaps are formed in a t

Your search for a perfectly simple ICT Killzone indicator for MT5 is now over because here it is. If you trade ICT concepts, then you know what ICT Killzones are. ICT Killzones (by default is adjusted to EST New York Time, no recalibrating to your timezone needed. Just load it onto your chart and you're good to go): Asian Open Killzone (06:00PM - 12:00AM EST New York Time) London Open Killzone (02:00AM - 05:00AM EST New York Time ) New York Open Killzone (07:00AM - 9:00AM EST New York Time )
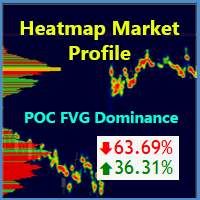
A Heatmap with a Volume Profile is like a thermal imager or x-ray machine. It will help you to estimate the relative distribution of volume during the price movement and to understand the relationship between volume and price. Indicator Volume Profile "Volumos Maxima" is a powerful tool for analyzing this relationship. After simple experimentation with heatmap, you can find that each trading instrument has its own “ characteristic ” way of distributing volume. And this will help you to make a b

The US Dollar Index on your chart, built live from your own broker's six currency pairs. The dollar index is the cleanest read there is on whether the dollar itself is moving, or whether it is the other side of your pair doing the work. When EURUSD falls you cannot tell from EURUSD alone whether the euro is weak or the dollar is strong. The index tells you. Put it under any chart and you are looking at the dollar on its own terms. It replicates the ICE US Dollar Index, widely quoted as DXY. Same
FREE

This indicator automatically draws horizontal lines at 00s, 20s, 50s and 80s levels. If you trade ICT concepts and are an ICT Student, then you know that these levels are used as institutional support/resistance levels and/or fibonacci retracement anchor points. Features
Draws horizontal lines at 00, 20, 50 and 80 levels above and below current market price . Choose the amount of levels to show on chart Customizable line colors Recommended for forex currency pairs. Saves time looking for thes
FREE

Candlestick bar, you can call it Candlestick Scalping Beast(CBS). This indicator is made specifically for scalping. The strategy on the indicator is that it gives signal on the close of a candle following this rule, if the close of the candle/bar is high then the previous candle/bar ,then it is a buying signal (up-trend),a green arrow and if the close of the candle/bar is lower than the previous candle/bar , then it is a selling signal (Downtrend), a red arrow. And the ATR is a secrete recipe
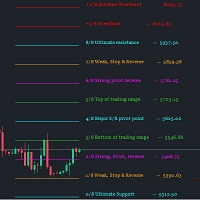
Murrey Math Lines The concept of this technical analysis system was developed by T. Henning Murrey in 1995 and described in The Murrey Math Trading System; For All Markets. The main concept here is that all markets behave in the same manner based upon the observations made by W.D. Gann. To date, the Murrey Math Line X it is one the most popular methods of Forex analysis and trading. Formula The Murrey Math Line X is calculated with the help of price movement segment, which, in accordance to Gan
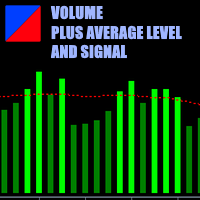
This is a volume indicator with the addition of a threshold level that can be set to a fixed value chosen personally or obtained from the average of the volume values themselves. The type of averaging method can be selected in the input parameters.
The input parameters are easy to interpret but let's examine them:
1 - Volume type Here you can select the type of volume you want to see represented and there are 2 choices, either TICK volume or REAL volume. Keep in mind that for forex, for examp
FREE
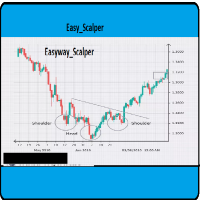
Forex BUY and SELL signals from the best Heiken Ashi Smoothed indicator. Draw bullish/bearish bars on the chart. Accurate trend detector. Heiken Ashi Smoothed is a simple MT5 indicator that draws bullish and bearish bars in the chart to reflect the direction of the trend. The indicator consists of orange bearish bars and green bullish bars. When the trend changes its direction, the indicator changes its color. The indicator is a modernization of the traditional Heiken Ashi indicator. Moving Aver
MetaTraderマーケットは、開発者がトレーディングアプリを販売するシンプルで便利なサイトです。
プロダクトを投稿するのをお手伝いし、マーケットのためにプロダクト記載を準備する方法を説明します。マーケットのすべてのアプリは暗号化によって守られ、購入者のコンピュータでしか動作しません。違法なコピーは不可能です。

取引の機会を逃しています。
- 無料取引アプリ
- 8千を超えるシグナルをコピー
- 金融ニュースで金融マーケットを探索