 MetaTrader 5
 专家
专家 指标
指标 程序库
程序库 实用工具
实用工具 窗口小部件
窗口小部件 规则
规则适用于MetaTrader 5的新技术指标 - 172
 技术指标的信号外汇和股票市场的开仓交易和平仓交易起着至关重要的作用。指标的本质就是一种交易品种的数学转换,旨在预测未来的价格变化。
测试技术指标可以更有利于预测市场行为并从中获利。
技术指标的信号外汇和股票市场的开仓交易和平仓交易起着至关重要的作用。指标的本质就是一种交易品种的数学转换,旨在预测未来的价格变化。
测试技术指标可以更有利于预测市场行为并从中获利。 
该指标从极值开始构建三周期信号和反转形态 123。信号出现在第二根蜡烛的开口处。 该形态可以通过不同方式(测试点 3、突破等)进行交易。退出通道或突破趋势线是寻找入场点的主要触发因素。 图标根据斐波那契水平着色。黄色图标表示对某一水平的测试,在该水平上信号会被放大。 使用多币种仪表盘,您可以跟踪 123 形态是在哪些货币对上发现的,以及有多少个条形图跟随该形态。 基于分形之字形。可重新绘制。因此,请在博客链接 - 123 Fractal Trading With UPD1 中研究该策略。
输入参数。
Bars Count – 显示历史记录。 Tooltip – 将鼠标悬停在对象上时是否显示工具提示。 Show Semaphore – 启用或禁用信号灯。 Show 123 – 启用或禁用显示 123 模式。
Period 1, 2, 3 - 信号周期。 Period 1, 2, 3 Visual – 启用或禁用单独周期的显示。
Arrow Coeff Period – 用于计算的条数。 Arrow Coeff – 平均烛台值的系数,

该指标背后的想法是在所有时间范围内找到穆雷水平并将它们组合成组合水平,其中包括基于强穆雷水平 (+2, +1, 8, 4, 0, -1, -2). 时间范围越短,您立即看到组合级别的机会就越大。 它将以颜色突出显示。 当您将光标悬停在任何数字上时,将显示该级别所属的时间范围的提示。 但您将始终将当前时间范围视为最左边的时间范围。 智能警报可帮助您传达与信号组合级别相关的价格。
视频中的仪表板不是声明的功能,也不包含在此处! 仍在开发中。
交易建议。 不建议在没有额外技术分析的情况下交易组合水平的反弹。 从蓝色和红色水平反弹的概率较高。 价格被磁力吸引至组合水平,但价格尚未对其进行测试(128 根蜡烛前)。在这种情况下,建议使用趋势策略,并采取水平取向(高/低一个水平)。 当价格向红色或蓝色水平移动时,不要在沿途反弹时交易黄色(这会破坏势头)。 强烈建议初学者在组合水平反弹时进行交易,除非有相反的组合水平。 最好在趋势方向反弹时进行交易。
在博客链接阅读更多内容 - Murrey Math Trading with UPD1 .
设置说明。
主要设置。 Period -

創建 MT5 的指標“HLC_bar_MT5 Wyckoff”是為了方便交易時的分析。 HLC Bar 由 Richard Wyckoff 使用,目前廣泛用於“VSA”操作。 Wyckoff 發現使用 High、Low 和 Close 使圖表更清晰、更易於分析。 指標“HLC_bar_MT5 Wyckoff”允許: # 改變條寬; # 保持條形相同的顏色; # 並突出顯示以相同價格開盤和收盤的柱。 顏色和寬度很容易在設置中修改 要使用該指標,只需將其拖到圖表上即可。 當與成交量一起使用時,威科夫將 HLC 圖表稱為條形圖。 他們試圖隱藏這些信息多年,但現在每個人都可以訪問這些信息,並可以使用此類圖表改進他們的操作。 HLC bar MT5 Wyckoff Chart 可用於任何市場和任何圖表時間,使操作員更加舒適。

VZO Plus is an indicator that shows overbought and oversold regions based on traded volume. #When the indicator line is between -40 and -60 it is oversold #When the indicator line is between 40 and 60 it is overbought.
Outside these regions, the market is following its natural path by inertia. Above the green line, it means that the market is positive, Another way to analyze the indicator is through divergence regions. When we have the bottom higher than the other in a downtrend or One bottom

The VSA Smart Money indicator tracks the movement of professional traders, institutional trades and all compound man movements. The VSA Smart money Indicator reads bar by bar, being an excellent tool for those who use VSA, Wyckoff, PVA and Any other analysis that uses price and volume. There are 10 indications that you will find in your Chart: *On Demand *Climax *UT Thrust *Top Reversal bar *Stop Volume *No Supply *Spring *Reversal Bottom *Shakeout *Bag Holding Using this indicator you will be o

该指标在图表上显示圆形水平。 它们也被称为心理、银行或主要参与者级别。 在这些水平上,多头和空头之间存在真正的斗争,许多订单的积累导致波动性增加。 该指标会自动调整到任何工具和时间范围。 当80水平被突破然后测试时,我们买入。当20级被突破然后测试时,我们卖出。目标是00。 注意力。由于强大的支撑 。 和阻力位,价格可能略低于 00 水平。
输入参数 。
Bars Count - 线条长度(以条为单位) 。 Show 00 Levels - 显示或不显示 00 级 。 Show 10, 90 Levels 。 Show 20, 80 Levels 。 Show 30, 70 Levels 。 Show 40, 60 Levels 。 Show 50 Levels 。 N Lines - 限制图表上级别数的参数 。 Distance 00 Levels - 层间距离(自动或手动) 。 Line Position - 图形前面或后面的线 。
Visual Button - 按钮显示(启用/禁用) 。 Corner - 按钮锚定角度 。 X indent - 以像素为单位的水平填充
FREE

MQL4 has also been converted to MQL5 exposure info for friends using iexposure. It shows the total number of positions that have been opened, how many buy or sell positions there are, the net amount of position numbers and their order prices, the profit and loss status of all total positions. I didn't write their code, it's open source, but I wanted to share it with everyone because it's an indicator I like!
https://www.mql5.com/en/charts/14801856/usdjpy-fix-d1-idealfx-llc
Amiguinho's Bar Counter is a price action indicator to display the bar count (candles) with some interesting options.
About the "Period of analysis" parameter: if the current timeframe is in minutes, then the analysis period will be considered in days; if the current timeframe is in days, then the analysis period will be considered in months; or if the period of analysis will be considered in years.
FREE

I have been trading and designing indicators and EAs for the last 5 years, and with great pride and excitement, I am honored to present FMC Alert(Forex Market Conditions Alert) to you all!
If you are a fan of the traditional indicators like the stochastic indicator, macd and moving averages, but if you would like a complete indicator that can utilize all these indicators, and some others, then the F.M.C Alert is the indicator for you. F.M.C Alert is an indicator that allows traders to customize
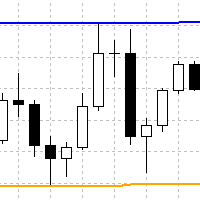
Indicator finds swing highs and lows, which are located between x bars to the left and y bars to the right. It plots such high and lows in form of continuous lines. Here is description of inputs. High Left Length - count of bars to the left for finding of swing high High Right Length - count of bars to the right for finding of swing high Low Left Length - count of bars to the left for finding of swing low Low Right Length - count of bars to the right for finding of swing low

This is an indicator for MT5 providing accurate signals to enter a trade without repainting.
It can be applied to any financial assets: Forex Cryptocurrencies Metals Stocks Indices It will provide pretty accurate trading signals and tell you when it's best to open a trade and close it. How do I trade with the Entry Points Pro indicator? Buy and install the indicator in your terminal Start trading by receiving signals from the indicator telling you about the ideal moment to enter a trade. E

SL Sniper I coded. to trade with the trap system of the main market with vsa for more information and you want vsa system please pm me
Suggested timeframes to trading : M1- M2- M3- M5 - M15-M30 -H1 Wait london and newyork markert open after wait best then select the best strong index and weakest index by sniper Histogram is indicated by one arrow at a time. The signal in the end direction of weak and strong All red and green mean trending index,natural market is displayed only in white SL

该指标绘制可能成为未来显着支撑位和阻力位的潜在水平。
该线越长,在该水平击穿后价格反转或价格变动增加的可能性就越高。 随着电平形成概率的降低,线的长度减小。
该指标不需要调整。
在设置中,您可以更改指示器的设计。
" Line_Length "按钮放置在图表上以调整线的长度(为了便于感知指标)。 所选的" Line_Length "设置将为每个时间段和仪器保存。 " Line_Length "按钮可以用鼠标拖动。 当悬停在按钮的左边缘时,它会用选定的颜色突出显示,按下时,数字会减少,指示线会缩短。 当您将鼠标悬停在按钮的右边缘时,它会以选定的颜色突出显示,按下时,数字会增加,指示线会延长。
_________________
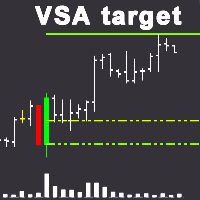
VSA目标 该指标使用Vsa(成交量点差分析)系统在图表上识别专业买家或专业卖家,并建立相对于这些柱(烛台)的趋势支撑区,以及目标水平。 特征: 1. 在该指标中,您可以选择一种模式,其中只有专业买家或专业卖家将被确定,并且两个专业参与者将在同一时间被确定。 2. 您可以在符号上设置任何时间帧来确定支持区域和目标水平。 交易时,设置更大的时间框架来确定支撑区域和目标水平,并且交易本身可以在更小的时间框架上进行,以便更准确地进入交易。 3. 在指标设置中,如果使用分时交易量,您可以选择分时交易量,如果使用实际交易量,则可以选择实际交易量。 4. 在确定大型卖家或买家时,您可以手动选择该卷的卷大小和搜索期。 5. 可用于创建专家。 资料描述: 绿色虚线是买方的支持区。 绿色实线(粗线)(TP1,TP2)是您需要平仓的目标价位。 红色虚线是卖家的支持区域。 红色实线(粗线)(TP1,TP2)是您需要平仓的目标价位。
开设购买仓位的建议 在绿色条纹(专业买家)出现后,形成客户支持区。 在此区域中,您可以以最小的风险进行购买交易,前提是销售柱的点差很小。 止损位于买方支持区域下方。 T
A huge number of traders use the VolumeProfile/MarketProfile analysis method. And I think there is no need to explain such concepts as POC and VAH/VAL. However, the standard VolumeProfile representation has a drawback - we only see the current picture of the market. We see the "convexity" of the volume distribution within the period. But we don't see the main thing - the "migration" of the POC level during the price movement. Our indicator is unique. It is dynamic. The first feature is that the
MultiVWAP A radical reworking of the well-known VWAP, which is in fact a completely new unique tool. It gives you the opportunity to put 5 types of different VWAPs on the chart: Volume - standard VWAP calculated based on volume No volume - no volume in calculations, which allows using the indicator on the charts, for which the broker does not supply volumetric data Volatility - new development, the calculation is based on unsteady volatility Buyer - VWAP calculation is based on current market bu

The QRSI indicator is one of the most important and well-known indicators used by traders around the world. It is also obvious that this indicator is capable of showing good entries in every local area. For which it usually needs to be optimized or just visually adjusted. This development is intended for automatic optimization of the indicator. Once placed on the chart, the indicator will automatically re-optimize itself with the specified period (PeriodReOptimization) and display the chart wit

This indicator shows the direction of the trend and trend change. Ganesha Trend Viewer is a trend indicator designed specifically for gold and can also be used on any financial instrument. The indicator does not redraw. Recommended time frame H1. Ganesha Trend Viewer is perfect for all Meta Trader symbols. (currencies, metals, cryptocurrencies, stocks and indices..)
Parameter setting
MA Short Period ----- Moving Average short period MA Long Period ----- Moving Average long period Alerts ON
FREE
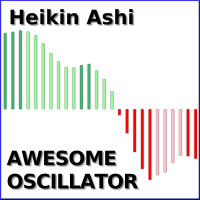
Check out my TRADE PLANNER MT5 – strongly recommended to anticipate account scenarios before risking any money. This is the Bill Williams Awesome Oscillator indicator calculated from Heikin Ashi candles. Here you find multi-colored histogram which is helpful when identify weakness or strength of trend in the market. To use it, just simply drop it on the chart and you don't need to change parameters except one: switch between Heikin Ashi or normal candles (see attached picture).
FREE

Melhor regra de coloração pra RENKO no MT5. Lucre de forma simples no mercado Brasileiro e também no Forex. Gatilhos precisos, indicando ótimos pontos de compra e venda no mercado.
Pode ser utilizado no Mini Dólar e Mini índice Pode ser utilizado no mercado Forex.
O indicador contém a regra de coloração aplicada ao RENKO.
O indicador permite a alteração dos parâmetros: período e tamanho do renko
O indicador permite a alteração das cores dos renkos.
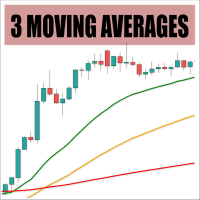
Check out my TRADE PLANNER MT5 – strongly recommended to anticipate account scenarios before risking any money. This is a customizable three-moving-averages indicator designed for crossover trading strategies. You can configure each moving average individually, including calculation method (e.g., exponential, simple), period, and price type, all from a single input dialog.
Parameters: Period <1,2,3> - Period of a moving average Shift <1,2,3> - Shift of a moving average Method <1,2,3> - Method
FREE

Are you having trouble with too many events in the economic calendar? This reduces to the minimum number you need. You can filter by country code importance any key words and you can receive alerts before the set time of the event. ++++++++++++++ If country code is blank, display available code on the expert tab. You need to turn off the automatic calendar update setting in MT5. Any sound file of .wav format in Sounds directory. The length of keyword characters is limited by MT5.
FREE

Indicador baseado no ATR (Avarage True Range) que exibe o tamanho em pips ou pontos do ativo. O indicador ATR SIZE ALERT dispara um alerta caso o preço atinja o numero de pips pre definido pelo usuário: Input: Periodo (periodo do indicador ATR) Pips (tamanho do movimento esperado) Alert (alerta sonoro) Além do alerta sonoro, o indicador também possui alerta visual.
FREE
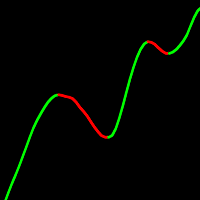
一款拥有极其丰富设置能力的移动平均线: 25 种平滑算法 、 13 种计算价格 、对所得均线进行离散化(量化)、按趋势为线条着色、趋势转变箭头、价格与均线互动的 4 种形态 、提醒通知以及直接在图表上显示盈利。 UniversalMA 指标汇集了现代交易中最受欢迎的均线构建方法。您不再需要在图表上挂十几个不同的指标——一个就够了。 K 线收盘后,指标不再改变其数值(不重绘)。 适用于任何交易品种和任何时间周期。 不占用计算机资源(代码经过优化)。 可不受限制地用于您自己的 EA(均线数值在缓冲区 0)。 您是否使用两条移动平均线的交叉进行交易? 请领取我们的第二款免费指标—— Moving Average Cross Signal — 免费下载 。它会在快线与慢线的交叉点标注箭头,并将提醒发送到终端、手机和邮箱,让您不错过任何一笔交易。 移动平均线有什么用。 移动平均线是基于价格的滞后指标,显示交易品种在设定时间段内的平均价格。本质上,它平滑了"噪音",让您能够从容不迫地解读图表。移动平均线是评估动能、确认趋势以及判断支撑与阻力区域的良好方式。 最常见的使用方法: 移动平均线的方向。
FREE
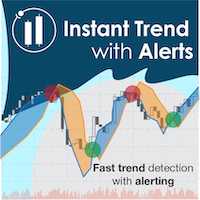
Catch major price movements, early in the trend. Alerts you to enter at the likely beginning of a trend, and if it's incorrect, quickly alerts you to exit to limit any loss. Designed to capture large, profitable price movements, with early entrance to maximize your returns. As shown in screenshots, typical behavior is several quick entrance/exists with small loss , and then capture of a large trend with high profits . The Instantaneous Trend indicator is a lag-reduced method to detect price t

As you know, the main invariable indicator of all traders is the moving average; it is used in some way in most strategies. It is also obvious that this indicator is capable of showing good entries in every local area. For which it usually needs to be optimized or just visually adjusted. This development is intended for automatic optimization of the indicator. Once placed on the chart, the indicator will automatically re-optimize itself with the specified period ( PeriodReOptimization ) and dis

The QRSI indicator is one of the most important and well-known indicators used by traders around the world. All signals are generated at the opening of the bar. Any closing price or zero bar prices are replaced with the corresponding price of the previous bar in order to avoid false results. This indicator is suitable for those who are interested in the classic calculation method but with improved functionality. There is a version for both MT4 and MT5.
By its nature, the QRSI indicator is an o
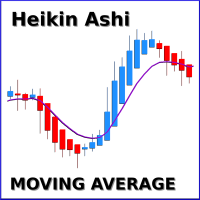
Check out my TRADE PLANNER MT5 – strongly recommended to anticipate account scenarios before risking any money. You get a professional moving average indicator with multiple calculation methods available, including exponential, linear, smoothed and linear weighted approaches. The indicator is designed to work on smoothed Heikin Ashi candles, which are included in the 'Examples' folder of Meta Trader 5. By applying this tool, traders can significantly reduce unwanted market noise.
FREE
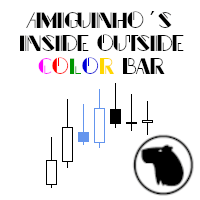
A simple price action indicator to highlight inside and outside bars (candles) with colors. It is possible to choose what type of bar can be highlighted among: inside, ouside or both. It is can be possible to choose a first specific color for the shadow and the border of bars (candles), a second specific color for high/bull bar (candle) and a third specific color for down/bear bar (candle)
FREE
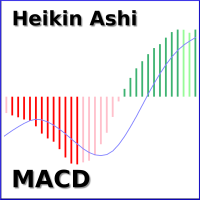
Check out my TRADE PLANNER MT5 – strongly recommended to anticipate account scenarios before risking any money. This is the moving average convergence divergence (MACD) indicator based on Heikin Ashi calculations. Here you find multi-colored histogram which corresponds to bull (green) / bear(red) trend. Dark and light colors describes weakness/strenght of price trend in time. Also you can switch calculations between normal and Heikin Ashi price type.
Note: Buffers numbers for iCustom: 0-MACD,
FREE
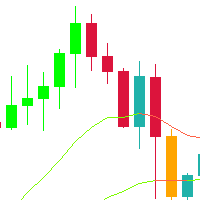
This indicator is a very simple indicator that draws candlesticks on a chart. However, it is possible to draw not only on the main chart but also on several sub-charts. In addition,it is possible to draw different symbols and timeframes from the main chart. features. 1. any symbols 2. any timeframes 3. two candle type(normal and heikin ashi) 4. many candle colors(intersection with ma_1) 5. pivot line (ver1.2) In case of positive candle, FULL : change color if low is over ma_1 PARTIAL :
FREE

"Driver Road Bands" indicator that is designed to be used in the 1H, 4H and 1D timeframes in the most ideal way. If we compare timeframes to roads and streets; main streets and highways with high traffic volume are similar to high-time timeframes in technical analysis. If you can interpret the curvilinear and linear lines drawn by this indicator on the graphic screen with your geometric perspective and develop your own buy and sell strategies; you may have the key to being a successful trader.
FREE

Moving Average Convergence/Divergence — схождение/расхождение скользящих средних — технический индикатор, разработанный Джеральдом Аппелем (Gerald Appel), используемый в техническом анализе для проверки силы и направления тренда, а также определения разворотных точек. Встроенный в MetaTrader 5 индикатор MACD не соответствует задумке автора (Gerald Appel):
-линия MACD графически изображена в виде гистограммы, однако гистограммой отражается разница между линией MACD и сигнальной линией;
-сигнальн
FREE
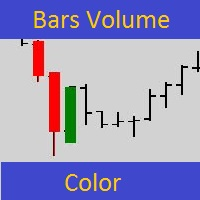
Все знают какую большую роль играют объемы в трейдинге. Основной индикатор объемов чаще всего находится в дополнительном окне и визуально плохо воспринимается. Этот простой инструмент разработан для быстрого и наглядного представления заданного объема непосредственно на графике с котировками для лучшей наглядности. Можно сразу оценить в каких местах на графике сконцентрировались большие объемы. Индикатор подкрашивает свечи по заданному объему от хая или лоу свечи до цены закрытия свечи. Если све
Binary Options Assistant (BOA) KAM Signals Indicator provides signals based on gkNextLevel Binary Options Strategy. Indicators: 3 Moving Averages & Stochastic
Stop missing trades, stop jumping from chart to chart looking for trade set-ups and get all the signals on 1 chart! U se any of the BOA Signals Indicator with the Binary Options Assistant (BOA) Multi Currency Dashboard . All BOA Signal Indicator settings are adjustable to give you more strategy combinations. The signals can be seen vis

The Moving Average
( https://www.youtube.com/c/TheMovingAverage/ )
inspired to create All in One 4MA-s with his color setting.
It Put up 4 Smoothed Moving Averages
With Arty chosed colors.
You can modify the settings / Parameters of the indicator
It's easy to use don't have to waist time to set up all 4 MA-s
just put this up.
Hope its helpfull and Arty don't mind it.
You can donate my work here:
https://discotechnika.hu/MQL/PayPal_Donate.jpg
or here
PayPal.Me/HunSkippy
FREE
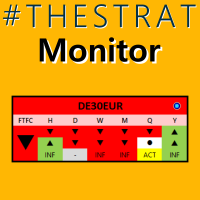
如果您还没有了解 Strat 交易策略 ,现在就去谷歌搜索吧。我保证这不会浪费您的时间,而且无论您是否使用它,您都可能会学到一些新技巧。 好的,现在您知道 TheStrat 是什么,您将能够理解该指标可以为您做什么。 主要特征
简而言之,该指标将: 显示所有支持的时间范围的时间范围连续性 支持两种时间视图,即日交易者和波段交易者 显示任何 4 个连续时间帧的全时间帧连续性何时到位 显示每个时间范围的当前蜡烛状态 显示所有时间范围内的当前形态(如果有) 显示有效和可操作模式 每 5 秒更新一次(可从 1 秒开始配置) 允许您单击面板以在选定的交易品种和时间范围内打开图表 您可以选择用于打开图表的图表模板 您选择要显示的组和这些组中的符号 该指标显示您经纪商支持的任何交易品种的所有关键 Strat 元素、时间框架连续性、当前模式和当前蜡烛状态的快照概览。它针对所有受支持的时间范围执行此操作,因此您可以准确地看到市场上正在发生的事情。 您可以根据需要对符号进行分组,并选择与每个组相关的按钮的标题。同时在屏幕上显示特定类型的所有符号可以让您发现整个组的相似之处,从而有助于您的分析。 有关配置
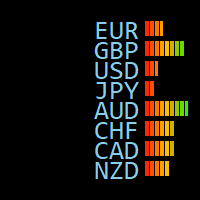
介绍 这是一个交易助手,信息面板类的指标,集合货币统计信息、账户统计信息、仓位信息、服务器和本地时间、货币强弱、K线剩余时间、支撑和阻力线,服务器时间偏移,货币波动率等功能。 可用于所有类型的账户和货币。 优秀的性能,占用的资源非常少 可以自定义位置、颜色、字体大小 任意模块可单独显示或禁用
特性
1.货币统计信息
日线的Open、High、Low、Close 日线当天的High-Low 日线昨天的High-Low 5天的平均波动 10天的平均波动 20天的平均波动 50天的平均波动 当天的涨跌幅 当天的涨跌的Points 当前点差 货币和当前价位
UseSidebar = true; SideFontSize = 10; XLocation = 90; 水平方向上的位置 YLocation = 20; 垂直方向上位置 SideXGap = 90; 水平方向上的间距 SideYGap = 19; 垂直方向上间距
OpenColor1 = clrLime; OpenColor2

METATRADER 5 的警报向上 - 向下
当价格离开 UP 和 DOWN 线之间的区域时,该指标会生成警报。
您可以生成各种类型的警报,例如:
> 声音
> 留言框
> 在专家框中留言
> 邮件(之前配置)
> 推送通知(先前配置)
线条必须从指标属性配置,而不是从线条属性配置,因为如果从线条属性完成,finonacci 可能会受到影响。
在这些设置中,您可以更改颜色、线条样式和宽度。 线条必须从指标属性配置,而不是从线条属性配置,因为如果从线条属性完成,finonacci 可能会受到影响。
在这些设置中,您可以更改颜色、线条样式和宽度。 线条必须从指标属性配置,而不是从线条属性配置,因为如果从线条属性完成,finonacci 可能会受到影响。
在这些设置中,您可以更改颜色、线条样式和宽度。
[ MT4 Version ] DoIt Order Blocks - Multi-Timeframe Order Block Indicator for MT5 Most multi-timeframe order block indicators for MT5 give you two bad options: keep switching between charts or display so many rectangles that none of them feels important. DoIt Order Blocks detects bullish and bearish zones from up to four timeframes on one chart. It tells you which timeframes are active and when price is touching one of their blocks, so you can stop searching and start waiting for price to reach
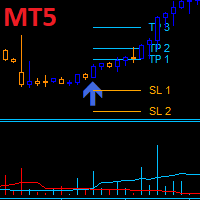
Dark Power is an Indicator for intraday trading. This Indicator is based on Trend Following strategy, also adopting the use of an histogram to determine the right power . We can enter in good price with this Indicator, in order to follow the strong trend on the current instrument. The histogram is calculated based on the size of the bars and two moving averages calculated on the histogram determine the direction of the signal
Key benefits
Easily visible take profit/stop loss lines Intui

The multi-currency indicator Currency Strength Index Plus can be set on the chart of any of the 28 currency pairs formed by 8 currencies (USD, EUR, GBP, AUD, NZD, CAD, CHF and JPY), for example, on EURUSD, H1. The indicator is designed to determine the direction of strength of each of the 8 currencies relative to each other. Using the strength and its direction of two opposing currencies, it is possible to make a currency pair with the best trading potential. Currency indices have flexible smoot

Auto Order Block with break of structure based on ICT and Smart Money Concepts (SMC)
Futures Break of Structure ( BoS )
Order block ( OB )
Higher time frame Order block / Point of Interest ( POI ) shown on current chart
Fair value Gap ( FVG ) / Imbalance - MTF ( Multi Time Frame )
HH/LL/HL/LH - MTF ( Multi Time Frame )
Choch MTF ( Multi Time Frame )
Volume Imbalance , MTF vIMB
Gap’s Power of 3
Equal High / Low’s
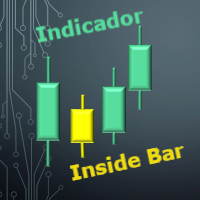
Identificador de Inside Bar O Inside Bar é uma formação de vela de reversão / continuação, e é um dos padrões de Candle mais operados pelos trader. Esse indicador permite que você identifique um O Inside Bar no gráfico de forma rápida e fácil, lhe permitindo uma tomada de decisão muito rápida e precisa. Sendo ideal para lhe ajudar nas suas diversas estratégias de Day Trade ou swing trade. O visual e a marca registrada da análise gráfica por esse motivo esse indicador conta com 3 opções visuais p
This indicator shows the breakeven line level for the total number of open positions of the current symbol with P/L value and total volume. This indicator is helpful to decide the exit level when using a trading grid strategy. The style of the breakeven line is customizable to choose the color, line shape and font size of the positions description. Send mobile notification when crossing a positive P/L target
FREE

Santa Bollinger Indicator is an efficient way to detect price retracement in any market. A common approach is to identify overbought or oversold market conditions. When the price of the asset breaks below the lower band of the Bollinger Bands, prices have perhaps fallen too much and are due to bounce. On the other hand, when price breaks above the upper band, the market is perhaps overbought and due for a pullback . Advantages Generates instant buy and sell signals. Never repaints, never back
FREE

Santa Trend Indicator is an efficient way to forecast and detect the trend in any market. Advantages Generates instant buy and sell signals. Provides an alternate exit strategy to your existing trading system. Never repaints, never backpaints, never recalculates. Works in all symbols and all timeframes. Perfect trend filter for any strategy or expert advisor. Fully compatible with Expert Advisor (EA) development. Does not lag.
FREE

Santa Donchian Indicator is an efficient way to detect support, resistence and break outs in any market.
The Donchian channel measures the high and the low of a previously defined range. Typically, a trader would look for a well-defined range and then wait for the price to break out to either one side for a trade entry trigger. Advantages Never repaints, never backpaints, never recalculates. Works in all symbols and all timeframes. Perfect trend filter for any strategy or expert advisor. Full
FREE
Reversal candles indicator , use in second window with rsi,levels 10-20-50-80-90 so u can see where the reversal candles pop upat the overbought oversold rsi levels.Great oppertunity to get in early and get out at the best moment. Candle turns blue at the 10-20 level "buy" candle turns red at the 90-80 level "sell" Always look at the major trend beore taking a buy or sell!!!
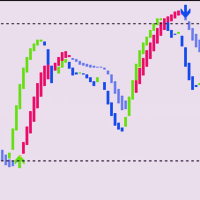
Necessary for traders: tools and indicators Waves automatically calculate indicators, channel trend trading Perfect trend-wave automatic calculation channel calculation , MT4 Perfect trend-wave automatic calculation channel calculation , MT5 Local Trading copying Easy And Fast Copy , MT4 Easy And Fast Copy , MT5 Local Trading copying For DEMO Easy And Fast Copy , MT4 DEMO Easy And Fast Copy , MT5 DEMO
Auxiliary indicators It waits for the hunt, waits for the price limit to appear, waits for a

Moving Wizard indicator will guide you to work with Trend and give pure Entry point depending on crossing on the chart it work on all currency and all Timeframe you can use it daily or scalping or swing its good with all and This indicator you can make it your strategy i work on it on H1 Timframe and make a good money you can take alook on it and you see a great resault on chart .Gold moving is to Know the Trend of price other moving below it mean we looking to sell orders . if above it we loo
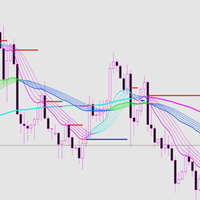
This indicator has good trend malleability and a good trend resistance support line. Index characteristics The color changes, following the trend of different levels . The support and resistance line means that the price follows or reverses.
Basic display A price tag showing historical support and resistance. Shows the approximate recommended range of historical entry positions, as well as take-profit and stop-loss recommendations, and target forecasts. Display the judgment of the current direc
with JR Trend you will able to enter and exit every trade with just a signals appear no need for any strategy just flow the indicator it work on all pairs and all Timeframe i usually take a look on higher timeframe and return to the lowest timeframe and make an order with indicator signals you can see the amazing result so you can depend only on it intraday or swing as you wish
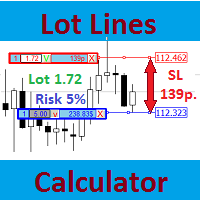
Большинство профессиональных трейдеров декларируют строгое соблюдение управления рисками. Этот простой инструмент разработан для быстрого расчета размера лота, чтобы торговать в соответствии со следующими базовыми правилами риск-менеджмента: Максимально допустимый риск устанавливается как фиксированный процент от общего количества средств на счете (например, 1-2%). Риск измеряется расстоянием в пунктах между открытием ордера и установленным стоп-лоссом. Так как для новичков всегда затруднительно

High and Low
The indicator marks bars with a simple trend definition“ each subsequent high above/below the previous one and each subsequent low above/below the previous one ”. Charles Dow
Formula:
Max – The current maximum Min – The current minimum MaxK – Maximum per period MinK – Minimum per period
Min>MinK & Max>=MaxK – Symbol on top Max<MaxK & Min<=MinK – The symbol on the bottom
Input parameter:
Number of bars in the calculated history Period for current timeframe The distance to th
FREE
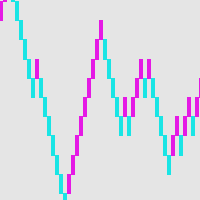
砖块图——一种备用的交易方式 如果你是一个对无数图表中的蜡烛图感到困惑的交易者,又或者说并不知道要怎么画线,也不知道支撑线阻力线怎么画,这个时候就应该另找一个适合自己的交易方法了。就像一个司机在反复遇到问题后会停下来进行全面检修一样, 一笔交易也是如此。 砖块图为盘中交易员提供了一种简单的交易方法,实际上这种方法和K线来说,具有同样的历史,并且也是起源于日本。 为了定义一个砖块图,他们只描述了一个设定点或基点的价格趋势。例如,一个10点的砖块图只能描绘出价格变动中10点的上升趋势或10点的下降趋势。 砖块图有一个得天独厚的优势,就是它的价格不和时间挂钩,也就是说只有价格变化达到了设定的数值,才会有一个新的砖块图出现,并且砖块图去掉了价格的毛刺,所以从感官上感觉会非常的舒服。

"Elder Ray" or "Ray" indicator is based on the Dr. Alexander Elder's oscillators: Bulls & Bears Power. Both of them works with an EMA. This indicator is used by traders to identify divergence, market directions and more... Dr. Elder's method generally uses a 13-day EMA Period but this can be modified based on your personal demand. The calculations are: Bulls Power= high candle - EMA close Bears Poder= low candle - EMA close Lime line represents Bulls Power and OrangeRed line, shows Bears Power
FREE

Ing (inguz,ingwar) - the 23rd rune of the elder Futhark ᛝ, Unicode+16DD. Add some runic magic to your trading strategies. The correct marking of the daily chart will indicate to you the successful moments for counter-trend trading. Simple to use, has high efficiency in volatile areas. Be careful in lateral movements.
Signals ᛝ are generated when the main lines of construction intersect.
Red arrow down - recommended sales
Blue up arrow - recommended purchases
rare purple arrows indicate exce

GRat Clusters is an indicator that shows various data in the form of clusters on a price chart: volume, delta, ratio of sales and purchases, etc. It allows you to visually see the market profile in real time and on history at a given depth. Capabilities 1.8 types of cluster data: volume, delta, purchases and sales , volume and delta, imbalance between sales and purchases , volume profile, delta profile, buy and sell profile. 2. A cluster period can be either any available in MT5 timeframe or
Moving average, moving average (English Moving average, MA) is a general name for a family of functions, the values of which at each point of determining the level of some average value of the original function for the previous period.
CalcPipsOn - In order to add rozruhunok on the chart, you must activate this field.
The previous development of a variant of this indicator differed in that it had an extended functionality for calculating averaging in the set, as well as advanced possibiliti

Vegas Tunnel, with up to 20 levels, allowing you to plot or not each level with color change, line thickness and ON/OFF visualization for easy use 100% free and lifetime Recommended use for time frames: Original --> H1 Fractals --> M15, M30, H4, D1 and W1 When the black dots are above the tunnel, start short positions. When the black dots are below the tunnel, start long positions. It's important to remember that just because the market breaks the line of lying doesn't mean it's time to enter a
FREE
An indicator of patterns #50 and #51 ("Triple Bottoms", "Triple Tops") from Encyclopedia of Chart Patterns by Thomas N. Bulkowski.
Parameters: Alerts - show alert when an arrow appears Push - send a push notification when an arrow appears (requires configuration in the terminal) PeriodBars - indicator period K - an additional parameter that influences the accuracy of pattern shape recognition. The smaller the value is, the smoother the row of peaks/valleys should be, so fewer patterns will be
An indicator of patterns #45 and #46 (Three Falling Peaks and Three Rising Valleys) from Encyclopedia of Chart Patterns by Thomas N. Bulkowski. Parameters: Alerts - show alert when an arrow appears Push - send a push notification when an arrow appears (requires configuration in the terminal) PeriodBars - indicator period K - an additional parameter that influences the accuracy of pattern shape recognition. The smaller the value is, the smoother the row of peaks/valleys should be, so fewer patt
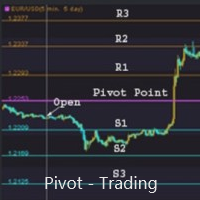
支点交易 : 1.pp 支点 2. r1 r2 r3 , s1 s2 s3 交易实用必备工具指标 波浪自动计算指标,通道趋势交易 完美的趋势-波浪自动计算通道计算 , MT4版本 完美的趋势-波浪自动计算通道计算 , MT5版本 本地跟单复制交易 Easy And Fast Copy , MT4版本 Easy And Fast Copy , MT5版本 本地跟单复制交易 模拟试用 Easy And Fast Copy , MT4 模拟账号运行 Easy And Fast Copy , MT5 模拟账号运行
支点( pivot points) 作为一种交易策略已经很长时间了,最初是场内交易员使用这种方法。使用这种方法通过几个简单的计算就可以了解市场在一天中的去向。 支点法中的支点是一天中市场方向的转向点,通过简单地计算前日的高点、低点和收盘价,可以得到一系列点位。这些点位可能形成关键的支撑和阻力线。支点位,支撑和阻力位被统称为支点水位。 你所看到的市场每天都有开盘价、高价、低价及收盘价(有一些市场是 24 小时开盘,比如外汇市场,通常用 5pm EST 作为开盘和收盘时间)。这些信息
CandleVolume is an indicator that colors bars according to increasing or decreasing volume. You can use it to identify strategic regions of the chart and complete an analysis. White means low volume, yellow means medium volume and red means climax volume. It is a recommended indicator if you like to interpret market contexts and understand how market cycles work.

Все паттерны из книги Томас Н. Булковский "Полная энциклопедия графических ценовых моделей" в одном индикаторе со сканером. Cканер включается параметром ScannerMode. При ScannerMode=false индикатор ищет один паттерн (выбирается переменной Pattern). При выявлении паттерна индикатор рисует стрелку, открывает окно сообщений, выполняет push-уведомление. У индикатора много параметров, некоторые их них задействованы всегда, некоторые выборочно. Включите переменную ShowHelp - на графике отобразится по
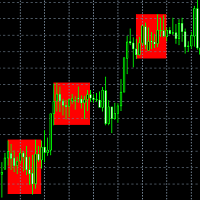
该指标检测平仓,并在发现的区域画上一个彩色的矩形。
该指标的主要思想是,当价格填满图表上的某个区域时,检测出一个平盘。
输入参数:
Color rectangle - 要着色的矩形的颜色。
Bars in rectangle - 矩形中允许的最小条数。
Density in % - 扁平的密度,设置为矩形区域的百分比。 __________________________________________________________________ __________________________________________________________________ ________________________

iPump 指标是一种多功能指标, 结合了三类指标的优点。
多个 TF 上的同时趋势检测 定义阻力和支撑区域 确定超买和超卖区域 指标功能: 定义趋势 对于希望客观评估当前市场方向并避免主观性的所有交易者来说,此功能将是必需的。在一瞬间,您将能够在最重要的时间范围内比较趋势的方向,这将变得清晰直观。 确定支撑位和阻力位 使用 iPump 指标,您将能够在几秒钟内评估资产的潜在价格障碍。
而且该指标会告诉您您面前的级别是什么类型: 测试水平(阻力/支撑) 反转水平 弱水平 未测试级别 确定超买和超卖区域 对于此任务,该指标具有非滞后和非重绘信号振荡器,显示资产的当前状态,基于此数据,您可以:
确切地知道哪些区域何时值得购买 什么时候出售资产会很有趣的区域 振荡器优势: 独特的计算算法 该算法实际上能够帮助我和我的同事以及我的同事进行交易,该算法用于 Pump and Dump Expert Advisor。 无需重绘 当超卖或超买价格高于平常时,该指标将准确显示信号。这将使您能够及时就开仓的可取性做出决定 毫不拖延 该指标每秒处理有关价格状态的报价的传入数据,这使交易者可以随时

Implements a channel based on integrated comparison of moving average values with improved functionality. As a result, the chart displays a channel of deltas of moving averages in the center line and an indentation of the channel boundaries over a specified range.
What is the channel? This is the price range (limited), in which all its dynamics (movement) takes place over a certain period of time. This method is very old, the Forex channel strategy dates back to a long time, when the theory
MetaTrader 市场 - 在您的交易程序端可以直接使用为交易者提供的自动交易和技术指标。
MQL5.community 支付系统 提供给MQL5.com 网站所有已注册用户用于MetaTrade服务方面的事务。您可以使用WebMoney,PayPal 或银行卡进行存取款。
