 MetaTrader 5
 エキスパート
 インディケータ
 ライブラリ
ライブラリ
 ユーティリティ
 ウィジェット
 ルール
ルール
YouTubeにあるマーケットチュートリアルビデオをご覧ください
ロボットや指標を購入する
仮想ホスティングで
EAを実行
EAを実行
ロボットや指標を購入前にテストする
マーケットで収入を得る
販売のためにプロダクトをプレゼンテーションする方法
MetaTrader 5のための無料のエキスパートアドバイザーとインディケータ - 24
 自動売買ロボットとインジケータを使用して、外国為替取引の収益性を高めます。 自動売買ロボットを使用すると、取引の開始と終了を自動化でき、インジケータは市場の行動をより正確に予測するのに役立ちます。
このページには、MetaTrader5アプリケーションのカタログが掲載されています。
自動売買ロボットとインジケータを使用して、外国為替取引の収益性を高めます。 自動売買ロボットを使用すると、取引の開始と終了を自動化でき、インジケータは市場の行動をより正確に予測するのに役立ちます。
このページには、MetaTrader5アプリケーションのカタログが掲載されています。 
MT5 Trade Manager is a MetaTrader 5 trade management panel designed to provide order execution, position monitoring, and risk control tools within a single interface. It operates as an on-chart dashboard with multiple pages for different trading functions. The tool is designed to support manual trading by centralizing trade operations and account monitoring in one place without requiring external applications. Interface Structure The dashboard is organized into six main sections: Dashboard
Provi
FREE

Trendline Breaker Mechanical Trendline Breakout Trading for MetaTrader 5 Trendline Breaker is a fully automated Expert Advisor for MetaTrader 5 built around a simple concept: Confirmed Swings → Trendline Detection → Breakout → Entry → Safety Line Management → Exit Instead of relying on manually drawn trendlines, the EA converts trendline trading into objective and repeatable rules. The system automatically detects confirmed swing highs and lows, evaluates valid trendline structures, waits for a
FREE

RoundNumbers indicator is a simple and powerful psychological price levels. Trader usually use these levels as a Support and Resistance (SnR). Indicator Input: Levels - Numbers of levels drawn on chart. Default 30 levels. BoxSize - Box size drawn on each levels, indicate buffers around levels. Default value 1pips (10point) above and below each levels. ZoneSize - Distance between each levels, default value 10pips (100point). Style & Colours - User inputs customization. For MT4 version, p
FREE

Trend Reversal Marker は、MetaTrader 5 向けの 非リペイント 型・11 本移動平均リボン系トレンドインジケーターです。10・20・30・40・50・60・70・80・90・100・200 本の 11 本の単純移動平均線(Simple Moving Averages)を計算し、それぞれについて 14 本分の変化率(Rate of Change:ROC)で傾きを解析します。200 期間 MA がメインのトレンド方向を定義します。多くの短期 MA が反対方向へ傾き始めると、インジケーターは反転した本数をカウントし、その数値を 0%〜90% の反転確率に変換して、右上のダッシュボードにリアルタイム表示します。200MA の ROC がゼロラインを抜けるタイミングで出る構造的な Bull / Bear ラベルと、ユーザーが設定した感度しきい値をカウントが越えたときに出る ReversalBull / ReversalBear ラベルという 2 種類のラベルにより、4 チャンネル対応のアラート付きで明確なエントリー&警告シグナルを発します。 MT4 版はこちら:
FREE

The GoldMiner EA is a reliable and straightforward Expert Advisor designed for gold trading. It was developed to deliver stable and transparent performance—without making exaggerated promises. This EA is completely free because I want to show that you don’t have to buy an expensive product to use a functional and well-designed trading bot.
Important: The GoldMiner EA is not a “get-rich-quick” scheme and will not make you a millionaire. Instead, the focus is on realistic, solid performance that
FREE
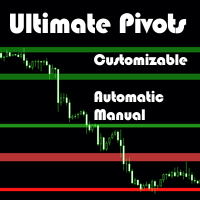
Ultimate Pivot Levels indicator for MetaTrader 5 Ultimate_Pivot_Levels is versatile tool designed to enhance your trading experience by accurately plotting pivot levels on your charts. It allows entering your desired values manually or using well known pivot calculation methods to create pivot levels. It draws the levels in the background and allows you to customize levels, size and colors of areas, and it keeps your adjustments while extending the levels to every new bar. Whether you are a novi
FREE

1. Overview The Scalping PullBack Signal indicator is a powerful technical analysis tool designed to help traders identify scalping opportunities based on potential pullback and reversal signals. This tool is particularly useful on lower timeframes (below 15 minutes) but can also be applied on higher timeframes for longer-term trades. This indicator integrates several key analytical components, providing a comprehensive view of trends and potential entry/exit points, helping you make quick and e
FREE

This EA is complete, multi-strategy , free , Brazilian and translated into English . If you prefer, download the EA in English:
https://www.mql5.com/en/market/product/59417 Light box robot , that is, you define the settings, which strategy you will use to operate.
More than 5,150 different input / output signals ;
More than 362.273148.218.750.000 possibilities combining up to 5 options of purchase (entry or exit) or sale (entry or exit), that's right, I checked this account!
Over 1,0
FREE

Strategy Lab Gann Swing Signals (free indicator, MT5)
Backtest figures below are simulated. Past results do not guarantee future results.
What it does - Builds a classic Gann swing chart: a swing turns after 2 (adjustable) higher highs or lower lows. - Draws an arrow when a bar CLOSES beyond the last swing top (buy) or swing bottom (sell). - Every signal shows a Stop Loss just beyond the opposite swing, plus TP1 / TP2 / TP3 at 1x, 2x and 3x the stop distance. - Optional Gann 1/8 octave levels
FREE

手動で取引サイズを決定する場合、プレッシャーのかかる状況下でピップ価値や手数料の計算を行わなければならないか、あるいは金や指数のロットサイズを誤算してしまう可能性のある単一の計算ツールに頼らざるを得ません。ロットサイズの誤算があると、手数料やロット単位の切り捨てを考慮した時点で、当初計画していた1%のリスクが全く異なるものになってしまいます。
「Phoenix Position Size & Risk Calculator MT5」は、取引サイズを算出し、エントリー、ストップロス、テイクプロフィットのラインをドラッグしてチャート上で直接設定できるようにし、ワンクリック注文にふさわしい安全チェックを経て、自動的に注文を実行します。金や指数を含め、あらゆるブローカーや銘柄で利用可能で、無料でご利用いただけます。
機能
ロットサイズは2つの独立した方法で計算され、相互に照合されるため、一部の計算ツールで発生しがちな金や指数のロットサイズ設定ミスを防ぎます 取引履歴から手数料を抽出するか、手動で入力し、ロットサイズ決定前にリスク予算から差し引くため、ストップロス発動時の実際の損失が設定
FREE

Five pivot point methods and three periods in one clean indicator. How it works The indicator reads the high, low, close and open of the previous completed Daily, Weekly or Monthly candle and calculates the levels for the period you choose. You can pick Classic, Fibonacci, Camarilla, Woodie or DeMark. Levels are drawn as horizontal segments from the start to the end of each period, so every period keeps its own levels. The current period gets labels with the level name and price. Previous period
FREE

ユーザーガイド:Custom Regression Signals MT5 Custom Regression Signals は、線形回帰(Linear Regression)という数学的手法を用いて動的な価格チャネルを構築する、MetaTrader 5用のプロフェッショナルなテクニカル分析ツールです。通常の静的なチャネルとは異なり、このインジケーターは価格の動向を能動的に分析し、相場が活発なトレンドにあるのか、あるいは横ばい(レンジ)状態にあるのかを判断するのに役立ちます。 1. インジケーターの仕組み インジケーターは設定された期間に基づいてチャネルを構築し、現在の相場フェーズに応じて自動的に色を変更します。 緑色のチャネル(上昇トレンド): 価格が着実に上昇しています。このフェーズでは、インジケーターはチャネルの下限で発生する**買い(BUY)**シグナルのみをフィルタリングして表示します。 赤色のチャネル(下降トレンド): 価格が着実に下落しています。このフェーズでは、チャネルの上限で発生する**売り(SELL)**シグナルのみを生成します。 灰色のチャネル(レンジ/フラット
FREE

Trend Sentinel V2 — The Ultimate Directional Guard Trend Sentinel V2 is a powerful, visually intuitive indicator designed to give you a crystal-clear view of the market trend across any asset class . Whether you are trading Spike Markets (Boom, Crash, Step, Bull, Bear, Pain, Gain), Forex pairs , Indices , Commodities , or Crypto , the Sentinel provides a single, clean, dynamically colored midline that tells you exactly who is in control of the market—the buyers or the sellers. Instead of cl
FREE
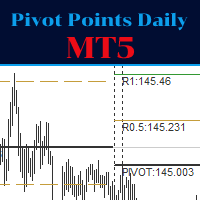
The Indicator show Daily Pivot Points. It is possible to specify the number of days to display. For forex it doesn't consider the sunday session data. It is possibile to modify the color, style and width for every level. It is better to use this indicator with timeframe not higher than Н1. 4 Levels of support and resistance with also Intermediate Levels that is possible to hide.
FREE

複雑なインジケーター、特にボラティリティの高いゴールド市場での取引にうんざりしていませんか?EasyTrend Gold MT5は、あらゆる時間足でゴールドのボラティリティを抑制するために設計されました。ATRの力を活用して、ゴールドの急激な動きを、ノイズを排除した一本の明確でダイナミックなトレンドラインに変換します。 M1でのスキャルピングであれ、H4でのスイングトレードであれ、トレンドの方向性と強さを視覚化し、レンジ相場(持ち合い期間)を容易に特定し、XAU/USDでいつ行動すべきかについての直感的な洞察を得ることができます。 その他の推奨資産 EasyTrendはゴールドのようなボラティリティの高い資産に最適化されていますが、そのロジックは、強いトレンドで知られる様々な市場でも非常に効果的です。 主要FX通貨ペア: EUR/USD, GBP/USD, USD/JPY 株価指数: US500 (S&P 500), US100 (NASDAQ), GER30 (DAX) 暗号資産: BTC/USD (ビットコイン), ETH/USD (イーサリアム) 商品 (コモディティ
FREE

Donchian Trend Engine Donchian Trend Engine is an institutional-grade dual-clock trend-following and channel breakout suite engineered for MetaTrader 5, combining Richard Donchian's breakthrough channels with the complete tactical rules of the legendary Turtle Trading experiment . The Two-Clock Architecture Unlike standard Donchian channel indicators that merely compute static highest highs and lowest lows, Donchian Trend Engine is built on a mathematically rigorous two-clock foundation : The P
FREE

MT5用NAS100 Auto SL and TP Makerをご紹介します:
MetaTrader5でナスダック100市場をナビゲートするトレーダーにとって不可欠なアシスタントであるNAS100オートSLおよびTPメーカーで、ストップロスおよびテイクプロフィットの設定をもう見逃すことはありません。このツールは、ストップロスとテイクプロフィットのレベル管理を自動化するシームレスなソリューションを求める方々のために設計されています。
主な特徴
簡単な自動化:
ストップロスやテイクプロフィットのないナスダック100取引を自動的に監視します。
ユーザーが構成した設定に基づいてレベルを動的に調整します。
注文タイプの多様性:
Nasdaq100の成行注文と未決済注文の両方に対応。
MetaTrader 5で利用可能なさまざまな注文タイプをサポートします。
カスタマイズされた設定:
ユーザーフレンドリーなパラメータ設定により、トラッキング設定とストップロス/テイクプロフィットレベルのカスタマイズが可能です。
柔軟な範囲:
実行する特定のNAS100商品または取引されるすべての商品に対してスト
FREE

OneClick Trading Assistant lets you trade straight from the chart. Set your lot, stop loss and take profit once, then click BUY or SELL. Your stops are attached for you. It is a manual tool. You choose when to enter. It manages your stops after that.
Supported for all brokers, instruments, timeframes and currencies.
WHAT IT DOES: BUY and SELL with one click, stop loss and take profit included. CLOSE ALL, Close Buys, Close Sells. All trades are closed at the same time, not one by one. Trailing
FREE

VR ドンチャン インジケーターは、ドンチャン チャネルの改良版です。改善はチャネルのほぼすべての機能に影響を与えましたが、主要な動作アルゴリズムとチャネル構造は維持されました。現在のトレンドに応じてレベルの色の変化がボールインジケーターに追加されました。これは、トレーダーにトレンドまたはフラットの変化を明確に示します。スマートフォン、電子メール、または MetaTrader ターミナル自体で 2 つのチャネル レベルのうちの 1 つのブレイクアウトについてトレーダーに通知する機能が追加されました。値札が追加されており、これを利用してトレーダーはチャート上の価格レベルを確認できます。古典的なドンチャン指標の操作アルゴリズムは、トレーダーが指標が計算する期間を自分で設定できるという事実により、最適化され高速化されています。古典的な Donchian インジケーターは、MetaTrader ターミナルで利用可能な履歴全体を計算します。これにより、MetaTrader ターミナルに数学的計算の負荷が大きくかかります。 VR Donchian インジケーターは、トレーダーが設定で設定した金額の
FREE

VWAP Volume Profile Pro プロフェッショナルなマーケット構造分析 VWAP Volume Profile Pro は、 VWAP(出来高加重平均価格) 、 Volume Profile(出来高プロファイル) 、 Point of Control(POC) 、 Value Area High(VAH) 、 Value Area Low(VAL) を1つのインジケーターに統合したプロフェッショナル向け分析ツールです。 出来高分布とフェアバリュー(Fair Value)に基づいて市場構造を客観的に分析し、重要なサポート・レジスタンス、機関投資家の出来高集中ゾーン、買い手と売り手のバランス、そして高確率のトレード機会を特定することができます。 対応市場: Forex(外国為替) CFD 株式 株価指数 先物 貴金属 原油 暗号資産(仮想通貨) VWAP Volume Profile Pro を選ぶ理由 多くのトレーダーは、VWAP と Volume Profile を別々のツールで分析しています。 VWAP Volume Profile Pro は、それらを1つのインジケ
FREE

Secura Gold Wave EA v1.0
Institutional-Grade Pullback Trading System for Higher Timeframes Trade with the rhythm of the market using Secura Gold Wave EA , a professional expert advisor built for patient, higher-timeframe traders. It systematically identifies high-probability pullback entries within a confirmed trend, using a multi-moving-average framework for precision. Core Strategy: Identifies price retracements to a dynamic moving average, waiting for a strong confirmation candle to signa
FREE

Are you tired of drawing trendlines every time you're analyzing charts? Or perhaps you would like more consistency in your technical analysis. Then this is for you. This indicator will draw trend lines automatically when dropped on a chart. How it works Works similar to standard deviation channel found on mt4 and mt5. It has 2 parameters: 1. Starting Bar 2. Number of bars for calculation The starting bar is the bar which drawing of the trend lines will begin, while the number of bars for c
FREE

**What it does**
Trend Pulse Lite draws a 50 EMA on the chart and paints it according to the market state:
- Green: uptrend. - Red: downtrend. - Gray: range, or a trend too weak to be taken seriously.
A moving average alone always has a slope, even if the price has been moving sideways for hours. That is why here the trend requires two conditions: an ADX above the minimum and a moving average slope large enough relative to the ATR. Because the slope is divided by the ATR, the same threshold
FREE

The Position Duplicator is an Expert Advisor for MetaTrader 5 (MT5) designed to work with two main features:
1. Automatic duplication of trades within the same MT5 terminal; 2. Copy Trading between different MT5 terminals, using a locally shared file.
The EA also provides additional features for lot control, symbol mapping, asset filters, and protection based on the number of open positions and Drawdown (DD). Communication between terminals is performed through a shared CSV file.
Warning: Th
FREE

Market Structure Scanner is a professional Smart Money Concepts (SMC) indicator designed to help traders identify high-probability market opportunities through advanced price action analysis. The indicator automatically detects and displays: Market Structure (BOS & CHoCH) Higher Highs (HH), Higher Lows (HL), Lower Highs (LH), and Lower Lows (LL) Order Blocks (Bullish & Bearish) Fair Value Gaps (FVG) Equal Highs (EQH) and Equal Lows (EQL) Buy and Sell Signals based on institutional price behavior
FREE

Strong Pressure Zones Strong Pressure Zones is a professional MT5 indicator designed to provide a clear visual representation of important market pressure areas directly on the trading chart. The indicator highlights significant support and resistance pressure zones using dynamic visual markers, colored levels, strength scores, and zone-based chart elements. It is designed to help traders quickly identify areas where price may encounter increased buying or selling pressure. Key Visual Features D
FREE

Most SMT indicators mark the divergences. This one also checks whether they work. ICT Correlation SMT Divergence Honest Stats compares your chart with a related market (gold with silver, EURUSD with GBPUSD, BTC with ETH, US500 with US100) and marks every SMT divergence. A table measures on your own chart whether price turned after an SMT more often than after a normal new high or low. Free, part of the Honest Stats series. MT4 version | ICT Killzones Honest Stats (free) | ICT FVG Honest Stats (f
FREE

FOREXPANDA Performance Dashboard A complete visual overview of your trading account — directly on your MetaTrader 5 chart. Turn your account statistics into a clean, professional dashboard. FOREXPANDA Performance Dashboard helps you monitor trading results, drawdown, floating profit and loss, profitability metrics, daily performance, and account balance history in one convenient place. Designed for traders who value clarity and efficient account monitoring, the dashboard brings essential perform
FREE

Detect rapid gold price expansions and define your response with configurable entries, visual setup levels, and automated trade management.
Gold Quote Expansion is a MetaTrader 5 Expert Advisor designed around short-term bullish price bursts in XAUUSD. It combines the frequency of broker quote updates with price movement and recent volatility to identify expansions as they develop within a candle.
You choose how to respond: enter with the upward move, wait for a pullback, or trade a retracemen
FREE

Protect your capital and turn winning trades into risk-free positions instantly. Auto Break-Even is an automated trade management utility that shifts your Stop Loss to your entry price (plus a customizable offset) the moment your trade reaches a defined profit target. Take the emotion out of trade management. By automating your break-even process, you prevent winning trades from turning into losers, allowing you to confidently hold positions for larger targets. [ Get the MT4 Version Here ]
FREE
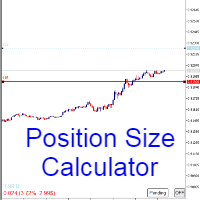
Calculating the volume of orders every time you create an order is an extremely important thing in risk management Let this tool simplify your work! ----------------------------------------------------- How to use? Attach the indicator to the chart and set its parameters: Risk size in % or money and Risk Reward Ratio. Click on the ON button and locate the horizontal line to your would-be StopLoss level. Options: Click on the Pending/Instant button to locate the horizontal line to your would-b
FREE

SMMA RSI Pulse EA — Systematic Trend & Momentum Trading System SMMA RSI Pulse EA is a fully automated Expert Advisor designed for disciplined, trend-following traders. It filters out market chop by combining higher-timeframe trend alignment with multi-layered momentum confirmation, backed by an adaptive, fixed-distance trailing stop. The system trades strictly on completed bar closes, preventing intra-bar noise, repainting issues, and false triggers. Core Advantages No Dangerous Strategies: No
FREE

入力パラメータ 初期値 説明 InpDaysToDraw 10 開始日が当日および過去9暦日以内にある取引セッションを描画します。10営業日ではなく暦日で数えます。市場データのない日にはボックスを描画しません。 InpMaximumTimeframe 1時間 インジケーターを表示するチャートの最大時間足です。H1を選択すると、H1以下の時間足でボックスを表示し、H4やD1などの上位時間足では削除します。 InpShowLabels true ボックスの上にセッション名と高値/安値を表示します。例:Asia 1.12583 / 1.12217。 false にするとラベルを非表示にします。 InpLabelFontSize 8 ラベルのフォントサイズです。値を大きくすると文字が大きくなります。設定可能な範囲は6~40です。 InpFillBoxes true 各セッションのボックスを指定色で塗りつぶします。 false にすると枠線のみを表示します。 InpDrawInBackground true ボックスと延長線を価格チャートの背面に描画します。この実装では、この設定に関係なくラベ
FREE

Forex Analyzer Pro MT5取引口座分析ダッシュボード Forex Analyzer Proは、MetaTrader 5ユーザー向けに設計されたWebベースの取引分析プラットフォームです。 Forex Analyzer ProはMetaTrader 5の口座アクティビティを同期し、取引情報を分析、レポート作成、モニタリング、およびトレードジャーナル機能として構造化されたダッシュボード上に整理します。 このプラットフォームでは、対応するデスクトップおよびモバイルWebブラウザを通じて取引ダッシュボードへアクセスできます。 Forex Analyzer ProはMT5口座に接続し、取引アクティビティを一元化されたダッシュボードに整理します。これにより、ポジションの監視、履歴の確認、統計分析、および取引記録の管理を行うことができます。 主な機能 • MT5口座ダッシュボード • オープンポジション監視 • 取引履歴分析 • トレードカレンダー • ストラテジー管理 • トレードジャーナル • 口座統計 • パフォーマンスレポート • 取引通知 • 複数口座対応 MT5口座ダッ
FREE

90 DEGREES V2.433 90 DEGREES is an automated Expert Advisor for MetaTrader 5 designed primarily for XAUUSD / GOLD . The EA is supplied with ready default settings, so no additional configuration is required for initial use. More experienced users can change lot sizing, risk parameters, market profiles, filters and other available settings for their own testing and trading conditions. Recommended setup: Platform: MetaTrader 5 Account type: Hedging Preferred account: Cent account Account currency:
FREE

RelicusRoad Multi Timeframe Trendbar は MetaTrader 4 および MetaTrader 5 向けのマルチタイムフレームトレンドインジケーターで、M1 から MN1 までの 9 つの時間足について Uptrend、Neutral、Downtrend のいずれかの状態を、チャートの隅に色付きドットの行として表示します。 各時間足には、その名前が上に付いた 1 つのドットがチャート右下の隅に表示されます。色が状態を示すため、チャートを切り替えなくても、どの時間足が一致しているかが分かります。 仕組み 各時間足について、インジケーターはその時間足の現在の足で 2 つの標準的なツールを比較します。ステップ 0.02、最大値 0.2 の Parabolic SAR と、期間 14 の ADX の +DI・-DI ラインです。方向を表示するには、この 2 つが一致している必要があります。 Uptrend:Parabolic SAR が終値より下にあり、+DI が -DI より上。初期値はライム。 Downtrend:Parabolic SAR が終値より
FREE

今日はどんな日ですか?トレンド日、レンジ日、反転日、インサイドデイ、それともアウトサイドデイでしょうか?Day Type Map は、チャート上の各日にその種類を表示し、今日がここまでどの種類か、そしてこの銘柄の過去の日が6つの種類にどう分かれたかを示します。金の直近250日では、32%がレンジ日、17%が上昇トレンド日、16%が反転日でした。無料で、わかりやすく、別の実装で確認済みです。 機能 最近の各日に下線が引かれ、それぞれの色で種類が表示されます。上昇トレンド、下降トレンド、レンジ、反転、インサイド、アウトサイドです。今日の種類は、形づくられるにつれて表示されます("Range so far")。小さな表に6つの種類が一覧表示され、過去の日に占める割合、各種類の日数、各種類が最後に現れてからどれくらいたったかを示します。今日の種類は強調表示されます。オプションのアラートで、今日の種類が変わったときに通知します。 仕組み 各日の種類は、その日自身の始値、高値、安値、終値と、前日の高値と安値から、すべての銘柄で同じシンプルな固定ルールで決まります。インサイドデイは前日の範囲内にとど
FREE

This indicator plots the volume profile by Price on the chart
There are 5 ways to view it:
By Total Volume Traded (Premium Version); Volume Ticks(Forex) Separated by Buyers and Sellers (Premium Version); Buyers Only (Premium Version); Sellers Only (Premium Version); Business balance (Buyers - Sellers) (Premium Version); .
It is possible to select how many days the profiles will be calculated.( Premium Version)
On the current day it recalculates the histogram data for each new candlestick.
FREE
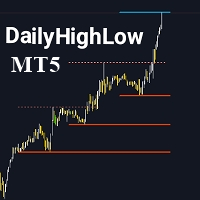
インジケーターを評価して、可視性向上にご協力いただければ幸いです。 DailyHighLow インジケーターは、MetaTrader 5 (MT5) プラットフォーム用に設計されており、トレーダーが日々の価格変動を監視するのに役立ちます。このインジケーターは、指定した期間の最高値と最低値に基づいて自動的にトレンドラインを描画し、正確な市場情報を視覚的に提供します。 主な特徴: トレンドラインのカスタマイズ: トレーダーの好みに合わせて、トレンドラインの色、スタイル、幅を調整できます。トレンドラインには、ブレイクとノンブレイクの両方の設定が可能です。 動的な更新: トレンドラインは最新の市場データに基づいて自動的に調整され、ブレイクの状況を示す視覚的なマーカーが用意されています。 柔軟なパラメータ設定: 表示する日数の設定、ブレイク後のラインの終了時間、および高値と安値のトレンドラインの外観をカスタマイズできます。 明確な視覚効果: ブレイクラインとノンブレイクラインを異なる色とスタイルで区別し、市場の主要レベルを迅速に識別できます。 このインジケーターは、トレンドライン
FREE

Quick Draw Palette for MT5 Quick Draw Palette for MT5 is a compact drawing panel for MetaTrader 5. It gives fast access to common chart markup tools without repeatedly opening the standard MT5 drawing menus. The panel is designed for traders who want to mark charts quickly while keeping the workspace clean and organized. Key Features Fast access to rectangles, trendlines, and horizontal levels Predefined visual settings for consistent chart markup Draggable on-chart panel with saved position Op
FREE

CRYSTAL THEMES: The Ultimate MT5 Workspace Upgrade Transform Your Trading Environment in One Click Staring at default, cluttered, neon-green charts for hours causes severe eye strain, mental fatigue, and loss of focus. A clean, aesthetically pleasing workspace is not just a luxury; it is the foundation of professional trading. Crystal Themes instantly transforms your MetaTrader 5 terminal from a basic grid into a premium, high-contrast, distraction-free environment. Clean your charts, protect yo
FREE

Astra BB RSI Arrows — ボリンジャーバンドとRSIを使用した視覚的なトレードシグナルインジケーター Astra BB RSI Arrowsは、市場における潜在的なエントリーポイントと決済ポイントを、分かりやすく素早く見つけたいトレーダー向けに開発されたインジケーターです。 このインジケーターは、テクニカル分析で広く使用されている2つの手法、ボリンジャーバンド(Bollinger Bands)と相対力指数(RSI)を組み合わせています。 複数のウィンドウを切り替えながら、クロス、買われすぎ、売られすぎの状態を手動で監視する必要はありません。必要な情報が、視覚的なシグナルとしてチャート上に直接表示されます。 インジケーターは不要な要素でチャートを埋め尽くしません。ボリンジャーバンド、エントリー矢印、決済マーク、重要なタイミングを見逃さないための通知など、必要な情報だけを表示します。 Astra BB RSI Arrowsの基本的な考え方 価格が極端な領域に入り、その後通常の範囲へ戻り始めるとき、市場ではトレード機会が発生することがあります。このインジケーターは、そのよう
FREE

Candle Close Timer Matrix – MT5 Candle Countdown Indicator Candle Close Timer Matrix is a lightweight and powerful MetaTrader 5 (MT5) candle countdown indicator that shows exactly how many minutes and seconds are left before the current candle closes on any symbol and any timeframe. Download MT5 EA Products Whether you are a scalper , intraday trader or swing trader , knowing the exact candle close time helps you: Time your entries on candle close Avoid impulsive mid-candle decisions Sync your t
FREE

Rating Meter:26本のインジケーターを1つの総合レーティングに Rating Meter は、人気の高い26本のインジケーターのシグナルを自動で計算し、「売り/中立/買い」というシンプルなレーティングにまとめます。インジケーターのウィンドウをひとつずつ開いて数値を見比べる必要はありません。パネルをひと目見るだけで、選択した時間足で相場がどちらに傾いているかが分かります。 Our products: https://www.mql5.com/en/users/trendhunter/seller パネルの表示内容 **Oscillators ゲージ:**11本のオシレーターで構成されるグループのレーティングです。RSI、Stochastic、CCI、ADX、Awesome Oscillator、Momentum、MACD、Stochastic RSI、Williams %R、Bulls/Bears Power、Ultimate Oscillator が含まれます。 **Moving Averages ゲージ:**15本のトレンド系インジケーターで構成されるグループのレーティン
FREE

概要 Breakout Adaptiveは、ATRベースのリスク管理、段階的利益確定、ブレークイーブンおよびトレーリングによる決済管理、利益戻し防止、連続損失後の適応的ロット調整を備えたドンチアンチャネル・ブレイクアウトEAです。資金曲線を滑らかにすることを目的としています。 仕組み 設定可能なドンチアン期間における最高値・最安値のブレイクアウトを検出。 チャネル外での終値確定後にエントリー、ATRベースの損切りを設定。 Tier 1(R倍数)到達時に一部決済、損切りをブレークイーブンへ移動。 Tier 2(R倍数)到達時に一部決済。 Tier 2後、残りポジションにATRベースのトレーリングストップを適用。 利益がピークRから設定%以上戻した場合にポジションを決済(利益戻し防止)。 連続損失後にリスク倍率を下げ、連続利益後に段階的に回復。 入力パラメータ Trading(取引) Magic Number — マジックナンバー Order Comment — 注文コメント Max Spread Points — 最大スプレッド(ポイント) Signal (Donchian)(シグナル・
FREE

ピボットポイントは、市場のかなりの部分が毎セッション意識している支持と抵抗の水準で、どのチャートでも計算式は同じです。この Pivot Points は直前に確定した足からそれを組み立てて描きます。中心のピボット、抵抗、支持のそれぞれに価格を表示し、現在値からの距離も出します。 三つの計算方式 Classic 、いわゆるフロアピボット。中心のピボットと R1 から R3、S1 から S3 まで。 Fibonacci 。前の値幅の 0.382、0.618、1.000 の比率に抵抗と支持を投影します。 Camarilla 。終値をもとにした水準で、反転の R3 と S3、抜けの R4 と S4 を含みます。 日足、週足、月足のいずれかで ピボットを組み立てる期間を選べます。その日のセッションなら日足、週や月をまたいで効く上位の水準なら週足や月足です。一度に一つの期間だけを描くので、チャートが読みにくくなりません。 どの水準もひと目で読めます 各水準は価格を表示した線として引かれ、コンパクトなフォージパネルには Resistance、Pivot、Support の順にまとめられ、各グ
FREE

Do you love VWAP? So you will love the VWAP Cloud . What is it? Is your very well known VWAP indicator plus 3-levels of Standard Deviation plotted on your chart and totally configurable by you. This way you can have real Price Support and Resistance levels. To read more about this just search the web for "VWAP Bands" "VWAP and Standard Deviation".
SETTINGS VWAP Timeframe: Hourly, Daily, Weekly or Monthly. VWAP calculation Type. The classical calculation is Typical: (H+L+C)/3 Averaging Period to
FREE

The RSI Engine は、MetaTrader 5 用の無料エキスパートアドバイザー(EA)で、プロップファーム(Prop Firm)対応です。RSIダイバージェンスとRSIリバーサルのシグナルで取引し、日次ドローダウン保護・最大ドローダウン保護・ニュースフィルターを搭載しています。マーチンゲールなし、グリッドなし、ナンピンなし――すべての取引にストップロスを設定します。
プロップファームのチャレンジや資金提供口座(ファンデッドアカウント)で取引するトレーダー向けに設計されており、日次損失ルールと最大損失ルールを自動的に守れるようサポートします。1日の失敗で口座を失うことを防ぎます。
(ご利用のプロップファームのルールに合わせた設定が必要ですか?コメント欄に口座ルールを書いていただければ、設定をお手伝いします。)
THE RSI ENGINE がプロップファームに対応している理由
- 日次ドローダウン制限:日次損失上限に達する前に、その日の取引を自動停止 - 最大ドローダウン制限:有効証拠金が最大損失に近づくとEAを完全停止(固定型・トレーリング型の両方に対応) -
FREE

Pyramidsは、私の新しいピラミッドシステムであるパーシャルクロージングを使用するエキスパートアドバイザーです。買われすぎ、売られすぎのゾーンでエントリーされます。資本を保護するための証券も用意されています。 Recommended for default settings: EURUSD-H1-1000$ .
Can work on any pair but need optimizations .
Discord: https://myx.gg/discord
Live trading: https://myx.gg/mql5 Recommended Broker : ICMarkets (4.8/5 on Trustpilot for 10k+ reviews) Recommended autolot & balance per pair : low risk: +3000$, medium risk: +1,000$, high risk: ±500$ Inputs: Global TP: Set the main take profit o
FREE
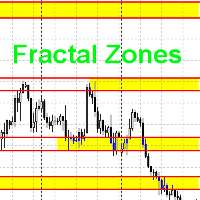
This indicator draws trading zones based on fractals from higher periods, which simplifies trading by levels.
This indicator draws two types of trading zones on one chart.
For example, if the current period is H1, then trading zones will be searched for by fractals from H4 and D1.
In the standard settings, fractal zones from H4 will be drawn in yellow, and from D1 - in green.
When zones are superimposed, colors are mixed at the intersection of zones. I don’t know how to fix this at the mome
FREE

M51H Dashboard: see the trend on two timeframes at a glance M51H Dashboard is a small panel in the corner of your chart. It shows whether the higher timeframe and your trading timeframe agree on direction, and how long each trend has been running. You don’t need to switch charts or add several indicators. What it shows Row What it checks Possible states H1 (anchor chart) EMA 8 vs EMA 21 Bullish, Bearish, Neutral M5 (trading chart) EMA 8, 13 and 21 lined up in order Bullish, Bearish, Waiting Each
FREE

My Products:
View My Products My Profile / Support / Contact:
Visit My Profile My Channel:
Follow My Channel
MA Ultra Trend is a professional technical indicator for MetaTrader 5 designed to help traders identify market trend, momentum shifts, pullback opportunities and potential reversal points through a combination of a configurable Moving Average and a normalized oscillator. Instead of relying on a single traditional indicator, MA Ultra Trend combines trend direction + oscillator momentu
FREE

前日の高値と安値、週の始値、先週の値幅。多くのトレーダーが毎朝手で引き直している、まさにその線です。 Daily Weekly Monthly Key Levels は、お使いの業者の足からそれらを自動で引き、いまの価格が各水準からどれだけ離れているかを示します。どれだけ拡大しても消えません。 表示範囲の外に出た水準はチャートの端に貼り付き 、名前と価格の付いた価格チップと矢印で残るからです。売買サインなし、リペイントなし、ごちゃつきもなし。 引く線 前日 の高値、安値、終値。 前週 の高値と安値。 当日と当週の始値 。日中に強く意識される、進行中の始値です。 前月 の高値と安値(任意)。 各水準は名前の付いた線で、期間ごとに色を分けてあります。コンパクトなパネルは期間ごとにまとめて、すべての水準と、その価格、そして現在値がどれだけ離れているかを並べます。距離の表示はピップス、価格、パーセントから選べます。 拡大しても消えない水準 日中足では、重要な水準の多くが表示価格帯の外に出ます。金ならほとんどが、ほとんどの時間そうです。見えない水準は役に立たないどころか有害です。遠くにあるも
FREE

Tired of SMC indicators that clutter your chart with random lines and overlapping boxes, obstructing your view of the price action? The Ultimate SMC Assistant is not just another structure mapping indicator; it is a Smart AI Trader Assistant designed specifically for Smart Money Concepts (SMC) traders and for successfully passing Prop Firm evaluations. The indicator constantly scans the market to detect the freshest and strongest reversal zones, providing you with a professional live dashboard
FREE
UPD: https://t.me/mql5_neuroExt актуальная версия и обсуждение. -作成されたトレーニングベースを成功させるために、一時的に使用するためのアドバイザーを無料で提供します。 -トレーニングの進行に伴い、トレーニングベースが配置されます。 -トレーニングには約20エポックが必要です。 なぜならExpert Advisorはリソースを大量に消費し、市場はそれを処理できません。Market値を持つTypeOfWorkパラメーターが導入されました。 他の希望する値に切り替える必要があります! 共同学習のために公開されました! 入力データのセットの深さは、設定で指定された時間枠の50バーです。 ThresholdOUTは効果がありません。 場合によっては、速度は非常に大きな値にのみ影響します。 トレーニングモードでは、SLとTPが等しい最小ロットで1つの注文のみを開きます。スケジュールは統一されている必要があります。このモードでは、利益自体は重要ではありません。 距離は、MaxOrders> 1でのみ機能します。 MaxOrde
FREE
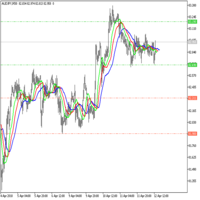
The EA tries not to open more than two positions of each type (BUY and SELL). The following rule is used: if there is a position, then the next position of the same type can be opened no earlier than after Trade once in the "timeframe of checked elements" * number of seconds on the History: timeframe of checked elements timeframe.
Input Values Trade once in "timeframe of checked elements" - the minimum time interval, after which the second position can be opened (the parameter value i
FREE
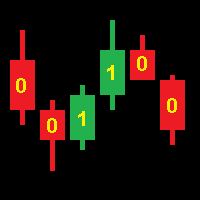
Operation of the CodEx Expert Advisor is based on patterns composed of consecutive candles. Positions are closed when opposite signals appear. Sequences of candles are encoded into an integer according to the following rule. The code number must be converted to binary form and the highest bit must be discarded. The resulting sequence of bits encodes a continuous sequence of candles, where 1 is a bullish candle, 0 is a bearish candle. The higher bits encode the earlier candles. For example: 19[10
FREE

Lot by Risk tradingパネルは、手動取引用に設計されています。 これは、注文を送信するための代替手段です。
パネルの最初の特徴は、管理線を使用した注文の便利な配置です。 第二の特徴は、ストップロスラインの存在下で与えられたリスクのための取引量の計算です。
制御線はホットキーを使用して設定されます:
利益を取る-デフォルトではTキー;
価格-デフォルトではPキー;
ストップロス-デフォルトでは、Sキー;
取引パネルの設定で自分でキーを設定できます。
操作のアルゴリズム:
1)-レベルを希望の場所に配置します(すべてのレベルを配置する必要はありません);
2)-リスクを指定します(オプション);
3)-緑の送信注文ボタンをクリックします;
4)-注文が行われるのを待っているか、エラーメッセージ付きのアラートが表示されます;
5)-マジックでExpert Advisorにリンクされている現在のシンボルのすべての注文を閉じる場合は、注文を閉じるボタンをクリックします。
注文を送信ボタンを何度も押すべきではありません。 一度で十分です。 注文後、ボタンは「
FREE

ScriptBot é um robô multi estratégia desenvolvido para ser prático e robusto, com o ScriptBot você é capaz de criar diferentes estratégias próprias, instale até 51 indicadores do seu gosto e monte o seu próprio gatilho utilizando uma expressões lógica simples.
WARN: Este Expert esta desatualizado , um novo ScriptBot esta sendo reescrito do zero. Abaixo contaremos um pouco sobre a estrutura: Indicadores: ScriptBot não possui indicadores na sua codificação, isso significa que você tem total co
FREE

Force Scanner MT5 is a real-time market strength indicator that analyzes 10 technical indicators and summarizes them in an intuitive panel with clear BUY or SELL signals.
Works on any asset: Forex, Synthetic Indices (Crash, Boom, Volatility), Commodities, Cryptocurrencies and more.
WHAT IT DOES: - Calculates Buying and Selling Force as a percentage - Shows BUY or SELL signal with confidence level - Analyzes: RSI, ADX, EMA, Bollinger Bands, Stochastic, MFI, CCI, Williams %R, Current Candl
FREE

Trend Signal Navigator EA – free companion EA for the Trend Signal Navigator indicator This EA trades the confirmed, non-repainting signals of the Trend Signal Navigator indicator automatically, with professional risk and trade management. It is free: you don't need to send a private message or wait for a "bonus EA". How it works Live and demo charts : the EA reads the signals, stop loss and targets of the Trend Signal Navigator indicator through iCustom (default path Market\Trend Signal Navigat
FREE

Cross-Asset Order Flow EA: Automated ETHUSD Trading on H1 In Plain Language If you've never used an EA (Expert Advisor) before: this is a program that watches the market and places trades on your MT5 account automatically, following one fixed strategy, without you having to sit and watch charts. DriftLock ETH uses a cross-asset approach : Bitcoin acts as an external source of market information, while ETHUSD is the asset actually traded by the EA. The EA continuously evaluates market conditions
FREE
マルチタイムフレーム対応、カスタマイズ可能なビジュアルシグナル、高度に設定可能なアラートシステムを備えたTraders Dynamic Index(TDI)インジケーター。
フリーランスプログラミングサービス、アップデート、その他のTrueTL製品は私の MQL5プロフィール でご覧いただけます。
フィードバックとレビューを大変お待ちしております!
TDIとは? Traders Dynamic Index(TDI)は、ディーン・マローンが開発した複合インジケーターで、RSI、RSIに適用されたボリンジャーバンド、RSIの2本の移動平均を1つの表示にまとめています。モメンタム、ボラティリティ、トレンド方向を含む市場ダイナミクスの包括的な見方を提供します。 インジケーターは5つのラインで構成されています:RSI価格ライン(生のRSI)、トレードシグナルライン(RSIの速いMA)、RSIシグナルライン(RSIの遅いMA、ボラティリティバンドの中心線でもある)、ボラティリティバンド高値と安値(RSIに適用されたボリンジャーバンド)。 機能: 5つの独立してスタイル設定されたライン:RSI
FREE

AI Volume Spike Scanner automatically flags candles that combine an unusually large range with unusually high tick volume - the classic footprint of big-player activity - and marks them directly on the chart with a clear directional arrow, so you never miss a significant move again. The indicator compares each new bar's range and volume against the recent average. When both exceed your chosen thresholds at the same time, the bar is marked as a bullish or bearish volume spike, giving you an objec
FREE
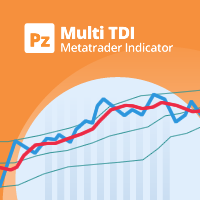
All-in-one trading powerhouse: trend, reversal, and exhaustion detection
This indicator is a personal implementation of the famous Traders Dynamic Index, which uses RSI, moving averages and volatility bands to find trends, reversals and price exhaustions. However, this particular implementation supports not only RSI, but many others. It is suitable for scalping, day trading, and swing trading and aims to provide a full picture of the current market conditions. [ Installation Guide | Update Guid
FREE

QCL Dynamic RSI Zones — MetaTrader 5 QCL Dynamic RSI Zones combines a smoothed RSI signal with adaptive boundaries to help you assess momentum in the context of recent market conditions. Instead of relying on fixed overbought and oversold levels, the indicator adjusts its zones using recent RSI behavior. A dynamic balance line, a color-changing signal, and excursion columns provide a clear view of momentum shifts in a separate chart window. Key Features Adaptive zones: Upper and lower boundaries
FREE

動的出来高/価格変動曲線
出来高/価格変動曲線は、ユーザーが定義したチャート範囲内で計算された出来高分布と価格変動値を表示します。選択範囲の矩形を移動またはサイズ変更することで、異なる時間枠を分析できます。このインジケーターは、出来高分布、プラスとマイナスの価格変動、コントロールポイント(CP)、出来高の高値(MV)と安値(MM)を表示します。
出来高分布は、オーダーブックまたは下位時間枠に基づいて計算でき、オーダーブックまたは実出来高(該当する場合)をサポートします。設定可能なパラメータには、価格線の数、値域の割合、出来高分布計算方法、曲線の幅、リアルタイムプレビュー、水平投影、ラベル、色、線種、初期選択サイズなどがあります。
設定可能なパラメータ
データと計算
曲線計算方法:オーダーブックまたは下位時間枠のヒストグラムの計算方法を選択します。
下位時間枠曲線期間:下位時間枠の計算方法で使用するヒストグラム期間を設定します。
ボリュームソース:ヒストグラムのボリュームソースを選択します。自動ボリューム、オーダーブックボリューム、または実際のボリュームから選択できます
FREE

効率的な手動取引のためのカスタムトレードパネル
このトレードパネルは、MT5での手動取引をサポートするツールを提供し、取引管理に役立つ機能を備えています。パネルは、注文の実行、注文管理、ポジションの監視機能をコンパクトなインターフェースで提供します。 なぜこのトレードパネルを選ぶのか? 複数の取引を管理したい場合でも、取引プロセスを効率化したい場合でも、このカスタムトレードパネルは、ポジションを効率的に管理するためのすべての機能を提供します。リスクをコントロールし、取引パフォーマンスを簡単にモニターできます。
主な機能 パネルには、以下の市場注文管理ツールが含まれています: あらかじめ設定したストップロスとテイクプロフィットを使って市場注文を実行 指定した価格ポイントに指値・逆指値注文を配置 ひとつのインターフェースから複数の注文タイプを管理 現在のポジションや保留中の注文をモニター 注文管理機能 ユーザーは、以下の主要な取引管理機能にアクセスできます: 注文ごとにストップロスとテイクプロフィットレベルを設定 アクティブなポジションにブレークイーブン設定を適用 特定の注文タイプ(買
FREE

SmartTrailingStop is a universal trailing stop utility that works on any positions — manual trades or orders opened by any EA. Pick from four trailing modes, add break-even and partial close, and let it manage every position on your account. Also check our gold EAs: Aurora Golden Goddess | Midas The Golden Touch | Golden Fatima
Designed for swing traders who hate watching charts, scalpers who need precise stops, and anyone running multiple EAs that lack a quality trailing module.
Fo
FREE

150+ downloads and counting - thanks to everyone who's already running it.
Risk Calculator is a free MetaTrader 5 tool that removes the manual math from position sizing. Drag the Stop Loss line to where your setup actually invalidates, and the dashboard instantly tells you the correct lot size for your risk — no calculator, no spreadsheet, no guesswork.
What it does: - Draggable SL line — drop it exactly where your stop belongs; the tool reads the distance in real time. - Draggable TP line —
FREE
MetaTraderマーケットは、他に類のない自動売買ロボットやテクニカル指標の販売場所です。
MQL5.community ユーザーメモを読んで、取引シグナルのコピー、フリーランサーによるカスタムアプリの開発、支払いシステムを経由した自動支払い、MQL5Cloud Networkなど、当社がトレーダーに対して提供するユニークなサービスについて詳しくご覧ください。

取引の機会を逃しています。
- 無料取引アプリ
- 8千を超えるシグナルをコピー
- 金融ニュースで金融マーケットを探索