 MetaTrader 5
 エキスパート
 インディケータ
 ライブラリ
ライブラリ
 ユーティリティ
 ウィジェット
 ルール
ルール
YouTubeにあるマーケットチュートリアルビデオをご覧ください
ロボットや指標を購入する
仮想ホスティングで
EAを実行
EAを実行
ロボットや指標を購入前にテストする
マーケットで収入を得る
販売のためにプロダクトをプレゼンテーションする方法
MetaTrader 5のための無料のエキスパートアドバイザーとインディケータ - 18
 自動売買ロボットとインジケータを使用して、外国為替取引の収益性を高めます。 自動売買ロボットを使用すると、取引の開始と終了を自動化でき、インジケータは市場の行動をより正確に予測するのに役立ちます。
このページには、MetaTrader5アプリケーションのカタログが掲載されています。
自動売買ロボットとインジケータを使用して、外国為替取引の収益性を高めます。 自動売買ロボットを使用すると、取引の開始と終了を自動化でき、インジケータは市場の行動をより正確に予測するのに役立ちます。
このページには、MetaTrader5アプリケーションのカタログが掲載されています。 
TPS SMC [7-in-1] for MetaTrader 5 The TPS SMC is a premium, all-in-one custom indicator engineered for MetaTrader 5. Faithfully ported from a highly regarded TradingView Pine Script, this indicator consolidates seven elite analytical modules into a single, highly optimized MT5 environment. It is purpose-built for traders who utilize Smart Money Concepts (SMC), order flow, and volume delta to navigate complex markets like XAUUSD, Forex majors, and indices. By eliminating the need to stack multipl
FREE

AlgoRhythm ZLSMA - The Ultimate Trend Trading Solution Unlock the power of precision trading with AlgoRhythm ZLSMA , an advanced technical indicator designed to deliver razor-sharp trend signals. Engineered for MetaTrader 5, this cutting-edge Zero Lag Smoothed Moving Average (ZLSMA) combines sophisticated smoothing techniques, multi-timeframe analysis, and dynamic bands to give traders a competitive edge in any market. Whether you're a scalper, swing trader, or long-term investor, AlgoRhythm ZLS
FREE

MetaTrader 5 用 Liquidity Zone 説明 Liquidity Zone は、重要な価格変動が発生した領域を視覚的に識別するために開発された MetaTrader 5 用インジケーターです。 このインジケーターはローソク足の値幅を分析し、現在の動きを過去のローソク足の平均値幅と比較します。値幅がインジケーター設定で定義された水準を超えると、そのローソク足の領域に対応するゾーンがチャート上に作成されます。 動作 ゾーンはローソク足の方向によって区別されます。買いゾーンは終値が始値より高いローソク足に対応します。売りゾーンは終値が始値より低いローソク足に対応します。 ゾーンはチャートの右側へ延長でき、新しいローソク足が形成されても該当領域を継続して確認できます。 分析期間、検出感度、ゾーンの延長範囲、同時に表示するゾーンの最大数を設定できます。 パラメータ Lookback Bars
分析に使用するローソク足の本数を設定します。 Extend Bars
ゾーンを右方向へ延長するバーの数を設定します。 Range Mult
検出感度を調整します。値を大きくすると判定基準
FREE
This utility tool shows the ticker symbol, timeframe, and description information as a watermark on the chart. Text resizes automatically according to chart size. It is useful to identify the correct chart when multiple charts are shown on the screen. Want more control over text apperance? Check out our Chart Watermark MT5 Premium utility. See the demonstration video below!
Inputs: Font Size: Initial font size for the ticker symbol and timeframe text (Default; 50). Description text font size
FREE

PIVOT MONSTER EA 概要
PIVOT MONSTERは、日次ピボットレベル(Classic、Camarilla、Woodie)と前日高値・安値のブレイクアウトを組み合わせて取引を行います。Bounce(反発)、Breakout(ブレイクアウト)、Combo(合流)の3つの戦略を切り替え可能で、1日1回の指値・逆指値注文と、ATR倍数または価格に対するパーセンテージで統一されたSL/TP設定を備えています。固定インジケーターではなく、完全に最適化可能なルールベースのピボットシステムを求めるトレーダー向けに設計されています。 動作の仕組み 各取引日の開始時に、前日の高値・安値・終値からピボットレベル(PP、R1-R3、S1-S3)を計算し、前日の高値・安値も記録します。 選択した戦略に応じて、S1/R1付近にBuy Limit/Sell Limit注文(Bounce)、前日高値・安値を超えた位置にBuy Stop/Sell Stop注文(Breakout)、またはピボットレベルと前日高値・安値が近接していることを要求する合流フィルターを伴う両方(Combo)を発注します。
FREE

Money Machine 7 Money Machine 7 is an automated trading tool designed for the MetaTrader 5 platform. This expert advisor focuses on trading the XAUUSD (Gold) symbol through an implementation of Smart Money Concepts (SMC) and an adaptive grid system. Main Strategy Features Smart Money Concepts (SMC): The system is designed to identify market structures, including Break of Structure (BOS) and Change of Character (CHoCH). It attempts to detect supply and demand zones based on Order Blocks and Fair
FREE

Auto Trade Manager EA – Black Hole Quantum Pro The Auto Trade Manager EA – Black Hole is a sophisticated Expert Advisor (EA) designed for MetaTrader 5, tailored for trading GOLD (XAUUSD) & FX, BTC with advanced automation and risk management features. Below are its most prominent features: Automated Entry with Support/Resistance : Utilizes dynamic support and resistance levels based on pivot points and historical price data to identify optimal entry points. Configurable parameters like PivotPer
FREE

CommunityPower EA — is the Expert Advisor for MetaTrader 4/5, created by community and for community. It is free, versatile and very powerful, and allows to trade a wide range of strategies. The idea is simple Your suggestions + my code = a win-win for everyone!
Is it a ready-to-use money-making machine? No, it is definitely not. It is a tool, which allows you to create and run your own trading strategy, and it is up to you to find profitable settings and take the responsibility for your tra
FREE

This EA will make it Entry setup based on first FVG formed, and if the price come back it will open the Order You can set silver bullet time A.M or P.M based on your broker server time
Silver bullet time ( EST NY Time +4 ) London : 3 A.M. to 4 A.M. NewYork AM : 10 A.M. to 11 A.M. NewYork PM : 2 P.M. to 3 P.M.
Set the time for beginning setup.
For increace Accuracy you can set DAILY BIAS with BUY = True / False SELL = True / False You can learn from TTrades video daily bias
https://www.yout
FREE

TickChart transforms your MetaTrader 5 chart into a full-screen tick-by-tick price visualization, giving you the same live tick chart found in the MT5 "New Order" panel — but expanded across your entire chart window with no size limitations. Who Is This For Scalpers who need to see micro price structure that candlesticks hide between bar closes News traders who need to watch the exact moment price reacts to a release tick by tick Manual traders who place orders directly on the chart and need to
FREE

The "Breakout Finder" is a technical indicator designed to automatically identify potential price breakouts and breakdowns on a chart. The highlight of this indicator is its robust signal filtering system, which helps traders avoid false signals (fakeouts) and focus on higher-probability trading opportunities. Key Features Automatic Pivot Point Detection: The indicator automatically identifies significant pivot highs and lows on the chart to establish potential support and resistance levels. Bre
FREE

VinoScalper VWAP-Powered XAUUSD Scalping Expert Advisor for MetaTrader 5 VinoScalper is an automated Expert Advisor developed for XAUUSD (Gold) , with a VWAP-based scalping engine at its core. The EA is designed to identify short-term trading opportunities using VWAP mean-reversion logic, supported by additional entry engines for session breakouts, support/resistance bounces and range conditions. Instead of relying on a single market condition, VinoScalper combines multiple entry approaches with
FREE

Asterion EA — ゴールド向けマルチインジケーター・コンフルエンスシステム ゴールド専用に設計された7インジケーター加重コンフルエンスエンジン。エントリー前にモメンタム、トレンド、ボラティリティのシグナルが一致することを要求し、ノイズと確信度の低いセットアップを排除します。XAUUSDで機械的な規律あるトレードを求めるトレーダーのために構築されました。 概要 Asterion EAは、7つの独立したインジケーター(RSI、MACD、ADX、ROC、ボリンジャーバンド%B、ウィリアムズ%R、MFI)を用いて強気・弱気の条件をスコアリングし、加重スコアが明確に一方向に傾いた場合のみトレードを実行します。ストップロスとテイクプロフィットはATRに基づいて自動調整され、固定pips値ではなくゴールドのボラティリティに応じて自動的に変化します。最大ドローダウン時の強制停止機能と、流動性が低い局面やギャップ発生時のエントリーを避けるためのスプレッドフィルターを搭載しています。 動作の仕組み 新しいバーが形成されるたびに、確定した直近のバーから7つのインジケーターすべてを読み取ります。 各
FREE
Counterattack EA is a fully automatic Grid Expert Advisor for Trend Scalping Trading on XAUUSD timeframe M1 but also in others.
Recommendations The Expert is programmed to work on XAUUSD M1, but you can use all others timeframes also. An ECN broker is always recommended A low latency VPS is always recommended. The recommended Leverage is 1:100 or more. The recommended capital is 10000 ($/cent) per 0.01 Lots or more. For higher Lots please test by yourself Please test Demo before you b
FREE

ATR Trend Channel — Adaptive ATR-Based Trend Channel Indicator For MetaTrader 5 · Main chart window indicator Overview ATR Trend Channel is an adaptive trend channel indicator drawn directly on the price chart. It builds an upper band and a lower band around the median price of each bar, using ATR (Average True Range) as the scaling unit. Unlike a regular moving-average channel, this channel does not slide smoothly from bar to bar. It stays anchored to a specific bar and is re-anchored — and
FREE

マルチタイムフレーム対応、カスタマイズ可能なビジュアルシグナル、設定可能なアラートシステムを備えたBollinger Bandsインジケーター。
フリーランスプログラミングサービス、アップデート、その他のTrueTL製品は私の MQL5プロフィール でご利用いただけます。
フィードバックと評価を歓迎します!
ボリンジャーバンドとは? ボリンジャーバンドは3本の線で構成されるテクニカル分析ツールです:中央バンド(移動平均線)、上部バンド、下部バンド。上部バンドと下部バンドは中央バンドからの標準偏差として計算され、その幅は市場のボラティリティによって動的に変化します。 バンドが狭くなる(スクイーズ)と、ボラティリティが低いことを示し、強い価格変動の前触れとなる場合があります。価格がバンドに触れるか超えると、買われ過ぎまたは売られ過ぎの状態を示します。TrueTL MTF Bollingerは現在のチャートに任意の上位タイムフレームの値を表示できます。 機能: 矢印と垂直線によるビジュアルシグナルマーカー 設定可能なトリガーを持つ3つの独立したシグナルスロット シグナル検出オプション:
FREE

Trend Reversal Probability Overview Trend Reversal Probability is an analytical indicator for MetaTrader 5. It does not open, close or manage trades. Its purpose is to describe one specific property of the market in numbers: how long the current directional state of a smoothed momentum oscillator has already lasted, and how unusual that duration is compared with the same measurement on previous occasions. The indicator runs in a separate window. On every bar it updates the duration of the curren
FREE

HBトレーディングソリューション - 無料版
MetaTrader 5用自動金(XAUUSD)エキスパートアドバイザー
こちらはHBトレーディングソリューションの無料版です。 設定不要、プラグアンドプレイで簡単に使用できるよう設計されているため、フルバージョンへのアップグレードを検討する前に、EAの動作を実際に確認できます。
任意の金チャートにEAをアタッチするだけで、自動的に実行されます。
設定や入力値の調整は一切不要です。
----------------------------------------------------------------------- 無料版で利用できる機能 ----------------------------------------------------------------------- - 手動操作不要の完全自動ゴールド取引 - 自動シンボル検出(XAUUSD、XAUUSD.sc、ゴールドなどに対応) - 連携グループによる複数ポジション管理 - 利益、グリッドレベル、取引状況を表示するリアルタイムチャートパネル - クリー
FREE

EasyTrading Panel Basic by Vexo EasyTrading Panel Basic is a free manual trade execution panel for MetaTrader 5. It provides a streamlined workflow for placing market orders with automatic risk-based lot sizing, stop loss, and take profit calculation. The panel works on any symbol and any timeframe. How It Works The panel displays on-chart with your account balance, current lot size, risk percentage, reward-to-risk ratio, and calculated stop loss. All values update in real time as you adjust par
FREE

Zlatobot は、M1時間足でゴールド(XAUUSD)を取引する完全自動売買EAで、2ヶ月間のサイバネティクス研究プロジェクトとして開発されました。(changed to H1!) free for firs 10 users!! price will be increased by 10usd for every copy. ADX、EMA 200、RSI、ATRを組み合わせてトレンド入場を確認します。主にアジアセッション(00:00–08:00)で取引し、ロンドンセッションにも対応。売りトレードは買いよりもはるかに厳しい条件が必要です。 主な特徴: - 全指標が一致した場合のみエントリー - セッション別の差別化フィルター - ATRベースの動的SL/TP(RRR 3.0) - TP50%時点でのブレイクイーブン保護 - 完全なリスク管理:最大DD、日次損失制限、連続損失制限 バックテスト結果(99%品質、2025年1月–2026年5月、$10,000): - 純利益:+$27,346(+273%) - シャープレシオ:15.43 - 最大ドローダウン:20.7
FREE

This indicator implements the QQE (Qualitative Quantitative Estimation) algorithm for MetaTrader 5, incorporating volatility bands logic. The indicator combines the Relative Strength Index (RSI) with Average True Range (ATR) to determine market direction. The histogram changes color based on the interaction between the RSI momentum and the calculated volatility channel. Technical Logic: The algorithm smoothes the RSI values and constructs upper and lower bands. When the smoothed RSI breaks these
FREE

概要 AI Donchian Breakout Traderは、MetaTrader 5用の完全自動売買のエキスパートアドバイザーです。ローリング価格チャネル(設定可能なルックバック期間における最高値と最低値)を追跡し、そのチャネルを超える真のブレイクアウトを探します。取引を検討する前に、AI風の信頼度エンジンによってスコア付けされます。 仕組み EAは、形成中および直前に確定したバーをチャネル計算自体から除外しながら、直近の高値と安値から価格チャネルを継続的に計算します。 直近に確定したバーの価格がそのチャネルの上限または下限を超えて引けたとき、ブレイクアウトシグナルが現れます。 ブレイクアウトの強さは、現在のATRボラティリティに対して正規化された、チャネルの端を超えた距離として測定されます。 各ブレイクアウトは、その動きに基礎となるトレンドの強さがあることを確認するため、シグナルとして扱われる前にADXインジケーターのメインラインと照合されます。 任意のEMAトレンドフィルターは、ブレイクアウトの方向が長期トレンドと一致することを要求できます。 0-100のAI風信頼度スコアは、
FREE

Hassila Multi-Intraday is an intraday robot for GBPUSD. It reads the market on H1 and looks for moments when price starts to recover inside a bigger move. When it finds one, it opens buys and can add up to 5 positions while the signal stays active.
Every order goes out with its stop loss and take profit already in place, and everything is closed at 4:00 pm New York time, so nothing stays open overnight or over the weekend.
Risk per entry is a percentage of the account and it adjusts on its ow
FREE

相場を無視するのではなく、相場に合わせて速くも遅くもなるトレーリングストップ。Var Trail Tracker MTFは支持平均をVIDYAで駆動します。その重みはモメンタムの尺度に従います。そのうえで周囲にパーセント指定のストップを置き、原典と同じ二本の遅れで両者を比べます。シグナルは支持平均がその遅らせた線と交差することであり、手法が定義するとおりです。無料です。試用期間なし、機能制限なし、上位版への誘導なし。 支持平均はVAR、すなわち平滑化の重みが九本のモメンタムの尺度で駆動される可変指数の動的平均です。モメンタムが強いときは平均が価格に密着し、弱いときは平均が減速して雑音に反応しなくなります。 その平均の周りにパーセント指定のトレーリングストップを置き、できあがった線を原典とまったく同じく二本遅らせて描きます。シグナルは支持平均がその遅らせた線と交差することです。だからシグナルは値動きの最中ではなく、相場が値動きを確認した後に届きます。 チャートに表示されるもの 価格ウィンドウには、側で色付けされ交差をまたいで途切れないトレール線、VAR支持平均を細い線として、その間を二種
FREE

ARCA bot - a full-featured, non-syndicated, automated system that uses a time-tested grid strategy adapted to modern conditions. This methodology has appeared since the inception of the financial markets and is still used by many professional traders and hedge funds, as it has shown good results for decades. The expert is fully automated and must be on 24 hours a day to work, so we recommend to use VPS-server, which will provide uninterrupted work of the expert.
Characteristics: Platform: MT5
FREE

NareshHTFCandles — Features 6 configurable HTF slots (default: M15 · M30 · H1 · H4 · D1 · W1) Each slot independently enable/disable, set timeframe, candle count, and trace Candles drawn to the right of price as chart objects — no subwindow Bullish/bearish body coloring with separate bull/bear wick colors Adjustable candle width, spacing between candles, and spacing between slot groups Wick thickness control via divisor (thick → thin) Forming (current) candle updates live on every tick FVG detec
FREE

Tested on pair EURUSD Prop Firm Challenge Features This is the core highlight of this Expert Advisor. It ensures strict adherence to proprietary trading firm rules: Daily Loss Limit: The bot monitors all closed trades for the current day and compares the real-time Equity with the starting daily balance. If the drawdown exceeds the DAILY_LOSS_LIMIT , the bot immediately closes all positions, deletes pending orders, and halts trading to protect the account. Pass Criteria (Profit Target): Onc
FREE

Global Session Timeline Dashboard MT5
「Global Session Timeline Dashboard」は、主要な外国為替市場(シドニー、東京、ロンドン、ニューヨーク)の取引時間をチャート上に直感的に表示するユーティリティ・インジケーターです。ドラッグ可能なダッシュボードを通じて各セッションの現在の状況をリアルタイムで確認できるほか、チャート上に描画されるセッションの垂直線の表示・非表示を個別に切り替えることができます。
[主な機能]
インタラクティブ・ダッシュボード:チャート内で自由に移動(ドラッグ)可能なパネルを提供し、4つの主要市場セッションの取引時間を進行バー(Bar)の形で視覚的に表示します。
セッションラインの個別制御:ダッシュボード左側の「 ON/OFF」ボタンをクリックすることで、各セッションの開始(Open)および終了(Close)時間を示す垂直線の表示・非表示を個別に設定できます。
状態保持機能:チャートの時間足(タイムフレーム)を変更しても、ユーザーが移動させたダッシュボードの位置座標(X, Y)や、各セッ
FREE
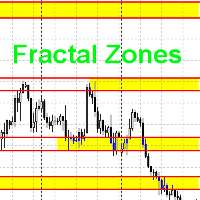
This indicator draws trading zones based on fractals from higher periods, which simplifies trading by levels.
This indicator draws two types of trading zones on one chart.
For example, if the current period is H1, then trading zones will be searched for by fractals from H4 and D1.
In the standard settings, fractal zones from H4 will be drawn in yellow, and from D1 - in green.
When zones are superimposed, colors are mixed at the intersection of zones. I don’t know how to fix this at the mome
FREE

"Your False Hope" is a fully automated trading strategy. It trades three symbols: AUDCHF, EURCHF, GBPCHF. Timeframe H6. Run it on any single chart — the advisor trades all its symbols automatically. The strategy is powered by an ensemble of 9 LSTM models trained on multiple timeframes: H12, H8 and H6. Each timeframe sees the market differently. The ensemble combines these perspectives and makes a weighted decision. This is more reliable than a single model trained on a single timeframe. The advi
FREE

[ マイプロダクト ] , [ マイチャンネル ] OMG Trading Panel スマートフォンからトレードパネルを直接操作できるようになりました。MQL VPSにOMG Trading Toolをインストールすれば、パネルを24時間稼働させながら、モバイル版MetaTrader 5アプリで快適にトレードできます。 また、2つの便利な戦略「スマート・マージン・プロテクション(証拠金保護)」と「グリッド戦略」も追加しました。価格下落時に作動するアラートを設定することも可能です。 主な機能 モバイル版MT5によるリモートコントロール スマートフォンを使って、どこからでもトレードツールの操作が可能です!注文のコメント欄に特別なコマンドを入力して待機注文(予約注文)を出すだけで、ツールが自動的に指示を実行します。柔軟性と機動力を求めるトレーダーに最適です。 コマンド例: omg auto- オートモードのON/OFF切り替え omg auto on - オートモードを有効化 omg auto off - オートモードを無効化 omg profit X - 利確(TP)金額をXドルに設定
FREE

SWING HIGHS LOWS DETECTOR
Swing Detection with Divergence Analysis
--------------------------------------------------
Identify swings. Spot divergences. Trade with confluence.
--------------------------------------------------
WHAT THIS INDICATOR DOES
This indicator automatically detects structural swing highs and lows using configurable depth and deviation filtering. It then analyzes RSI and MACD to detect regular and hidden divergences between consecutive swings of the same type.
Diver
FREE

The VWAP Session Bands indicator is a powerful tool designed for Meta Trader 5. This indicator calculates the Volume Weighted Average Price (VWAP) and its standard deviation bands within customizable daily sessions, offering traders a clear view of price trends and volatility. Unlike traditional VWAP indicators, it ensures smooth, continuous lines across session boundaries by using the previous candle's values for the current (incomplete) bar. Ideal for scalping or day trading on instruments lik
FREE
The Impulse MACD is a technical indicator that combines the power of multiple moving averages to create a unique momentum oscillator. Unlike traditional MACD indicators, this tool uses three different moving averages applied to high, low, and weighted price data to generate more precise market impulse signals. Its strength is its excellent filtering capability during ranging markets. Visual Elements Color-coded Histogram : Dynamic green/red bars that change color based on momentum direction Sign
FREE

「Agulhadas」戦略を発見しよう この戦略は、ブラジル市場で人気のあるコンセプトに着想を得たもので、トレンド、市場の強さ、モメンタムに基づいてエントリーおよびエグジットポイントを特定するために、5つのテクニカル指標を組み合わせています。使用されている指標の中には、有名なDidiインデックスもあり、これは移動平均線のクロスを示すことで知られており、Odair Aguiarによって開発されました。 株式スキャナーをこちらからダウンロード 使用されている指標 Didiインデックス ADX ボリンジャーバンド Trix ストキャスティクス この戦略の仕組み あらかじめ定義された条件に基づいて、チャート上に買いと売りの矢印を表示します。また、エグジットポイントには「X」を表示します。 買いシグナル エントリーポイントを確認するために、以下の3つの条件が観察されます: ADXが上昇トレンド ADXが32以上、または上昇中で、DI+がDI-を上回っている。 Didiインデックスのゴールデンクロス 短期平均線が中期平均線を上抜け。 ボリンジャーバンドが拡大 上下のバンドが同時に広がっている。 売
FREE

ZigZag Support and Resistance Levels は、複数の時間足におけるZigZagの転換点を使用して、サポートラインとレジスタンスラインを特定するインジケーターです。選択した時間足のレベルを1つのチャートに統合し、トレーダーが潜在的なコンフルエンスゾーン(複数のレベルが重なる領域)や重要な価格水準を把握できるようにします。ATRに基づいて近接するレベルをサポートゾーンとレジスタンスゾーンにグループ化し、有効なレベルとブレイクされたレベルを区別します。また、チャート上のインタラクティブなコントロールパネルにより、表示内容をリアルタイムで調整できます。
主な機能 1. マルチタイムフレーム分析 複数の時間足のサポートラインとレジスタンスラインを同時に分析します。 M1,M5,H1 のように、カンマ区切りで時間足を自由に組み合わせることができます。 時間足が指定されていない場合は、現在のチャートの時間足を自動的に使用します。 上位時間足のサポートラインとレジスタンスラインを現在のチャート上に直接表示します。 異なる時間足のレベルが集中する潜在的なコンフルエンス
FREE

Profitable Scalper EA - Rôla Scalper! Tested on EURUSDm Symbol on Micro Account created in XM Broker, but you can try it in any market or broker, any way I recommend that you use it on markets with volatility similar to EURUSD.
This EA can open a lot of positions, so I recommend that you use a broker that don't have comission fee and provide low spread.
You can use settings on 5 minutes timeframe, since I started to use it, and in tests, the maximum drawdown with this settings and M5 timefram
FREE

A Trading Approach Introduced for the Very First Time in Smart Trading! I don't believe in backtesting—anyone can curve-fit settings to past data. The real test happens in the live market! Test the EA yourself via Live Forward Testing on a Demo Account , and let the real-time results speak for themselves. Note: This code was originally built for private use and was never meant to be released publicly. It is available now for a strictly limited time only. Institutional & Bank Trading Ex
FREE

これはMetaTrader 5用のマルチタイムフレーム(MTF)高値・安値インジケーターです。過去の期間(日足、週足、月足、およびオプションで4時間足・8時間足)の高値・安値に加え、現在進行中の日足高値・安値をチャート上に直接表示します。
主な機能
1. 高値・安値レベルの表示
現在の日足(進行中の日) — CDH/CDLと表示
前日の日足 — PDH/PDLと表示
前週の週足 — PWH/PWLと表示
前月の月足 — PMH/PMLと表示
4時間足(オプション) — P4HH/P4HL
8時間足(オプション) — P8HH/P8HL
2. 視覚的要素
各高値・安値の水平線(色、スタイル、太さをカスタマイズ可能)。
各期間の範囲全体を示す色付きの背景ボックス。
右側に表示される価格ラベル(以下の情報を表示):
価格の値
現在価格からの距離(パーセンテージ表示、例:高値から-12.4%)
オプションのタッチ回数 [T:n] — 価格がそのレベルに何回タッチしたか
オプションのレベル滞在バー数 [B:n] — そのレベル付近で費やされた時間(バー数)
スマ
FREE

Rating Meter:26本のインジケーターを1つの総合レーティングに Rating Meter は、人気の高い26本のインジケーターのシグナルを自動で計算し、「売り/中立/買い」というシンプルなレーティングにまとめます。インジケーターのウィンドウをひとつずつ開いて数値を見比べる必要はありません。パネルをひと目見るだけで、選択した時間足で相場がどちらに傾いているかが分かります。 Our products: https://www.mql5.com/en/users/trendhunter/seller パネルの表示内容 **Oscillators ゲージ:**11本のオシレーターで構成されるグループのレーティングです。RSI、Stochastic、CCI、ADX、Awesome Oscillator、Momentum、MACD、Stochastic RSI、Williams %R、Bulls/Bears Power、Ultimate Oscillator が含まれます。 **Moving Averages ゲージ:**15本のトレンド系インジケーターで構成されるグループのレーティン
FREE

JT360 Volume – Free Volume Indicator for MT5 Simple. Clear. Configurable. JT360 Volume is a lightweight volume indicator for MetaTrader 5, designed to help traders monitor market activity and compare current volume with its moving average. The indicator displays a color-coded volume histogram together with a configurable volume moving average in a separate chart window. Key Features Color-Coded Volume Histogram Royal Blue: Volume increased compared with the previous candle. Dim Gray: Volume decr
FREE

Trading Session Indicator The Trading Session Indicator visualizes the high and low points as well as the start and end times of the Asian, London, and New York trading sessions directly on your chart. Features: Visualization of major trading sessions Highlighting of high and low points Display of start and end times for each session Customizable session times User-friendly and efficient Customizability: Each trading session (Asian, London, New York) can be individually customized to match speci
FREE

Rally-Base-Rally (RBR) demand zones and Drop-Base-Drop (DBD) supply zones directly on the MetaTrader 5 chart. The indicator combines ATR-based candle analysis, optional EMA trend filtering, market structure, and automatic trade planning. It is designed to help traders locate potential pullback and continuation areas with clear entry, Cut Loss, and Take Profit levels. Main Features Detects fresh RBR demand and DBD supply zones. Uses ATR, candle range, body ratio, and closing strength. Optional EM
FREE

Introducing our advanced Forex Trading Robot, designed to work seamlessly with all currency pairs and Gold. How it works: This intelligent robot utilizes a dynamic Grid strategy, specifically optimized for trending markets. When the market is in an Uptrend, the robot will open buy positions and progressively add new buy trades as the trend strengthens. Conversely, in a Downtrend, it will open sell positions and add additional sell trades as the market moves lower. The robot's entry signals are b
FREE
Ekom Spike Detector
Navigate the volatile world of Boom and Crash indices with the Ekom Spike Detector Indicator. This powerful tool detects explosive price movements, providing traders with precise buy and sell signals 24/7.
Key Features:
Spike Detection : Identify high-probability spike patterns in real-time Clear Visual Signals : Displays clear buy and sell arrows on the chart for easy decision-making Customizable : Easily switch from either Boom based on individuals choice Reliable : Te
FREE

UT Bot Gold ATR Trailing Stop MT5
Free MT5 port of the well known UT Bot Alerts indicator, tuned for gold (XAUUSD) on M15. Buy and sell signals from an ATR trailing stop, with alerts.
Original Pine Script by Yo_adriiiiaan, core idea by HPotter, alerts version by QuantNomad. The algorithm is public and this port is free.
WHAT IT DOES
An adaptive trailing stop follows price at a distance set by the Average True Range. When price crosses the stop line, the indicator prints a buy or sell arrow
FREE

トレーディングパネル,手動取引,注文管理,リスク管理,トレードマネージャー,ワンクリック取引,ストップロス,テイクプロフィット,部分決済,スキャルピング
重要
JoPanel Prime を正しく動作させるには、MetaTrader 5 の「Algo Trading」を有効にする必要があります。この設定が有効になっていない場合、パネルは動作しません。
JoPanel Prime は、MetaTrader 5 用に開発されたプロフェッショナルな裁量取引パネルです。注文の実行とポジション管理をより迅速かつ効率的に行えるよう設計されており、MT5 標準の取引画面を、チャート上で直接操作できるモダンなトレードパネルに置き換えます。
主な機能
• ワンクリックで Buy / Sell の成行注文を実行 • チャート上でプレビュー表示付きの指値・逆指値注文(Shift:Buy、Alt:Sell) • ホットキー(X:すべて決済、I:ポジション反転、M:パネルの最小化) • Take Profit と Stop Loss を個別に設定可能 • 指値・逆指値注文で OCO(One-Cance
FREE

El indicador utiliza múltiples marcos de tiempo para analizar las mejores entradas de compra en el auge 1000. Está diseñado para ayudar a operar únicamente en picos de auge. el indicador tiene dos flechas; los rojos y azules. la formación de la flecha roja indica que debe estar preparado para una flecha azul que es una señal de entrada de compra. el indicador no ofrece puntos de salida. siempre recopile 3 pips, es decir, si ingresó a una operación a 10230,200, puede salir a 10260,200 con SL a 1
FREE

SuperTrend Hedge EA: Precision XAUUSD M1 Trend Engine with Instant Pullback Hedging & Prop-Grade Equity Protection
======================================================================== SUPERTREND HEDGE EA (v1.00) — XAUUSD M1 to any MULTI-TIMEFRAME SYSTEM ========================================================================
SuperTrend Pro Hedge EA is a precision-engineered automated trading system built specifically for Gold (XAUUSD) on the M1 timeframe. Unlike dangerous grid or martingale
FREE

RSI 隠れダイバージェンス アラート EA(MT5) RSI Hidden Divergence Alert EA は、最新の確定足と検証済みの過去の価格極値との間の RSI 隠れダイバージェンスを検出し、ポップアップアラートで通知する MetaTrader 5 ツールです。ダイバージェンス・パターンを探して常にチャートを見張ることなく、トレンド継続の可能性のあるセットアップを発見できます。 チャートに装着すると、EA は直近の確定足を検証済みの過去のスイングポイントと比較し、隠れダイバージェンスが出現したときにポップアップアラートを送信します——RSI が売られすぎで価格がより高い安値を形成する場合が強気ダイバージェンス、RSI が買われすぎで価格がより安い高値を形成する場合が弱気ダイバージェンスです。これにより、チャートをすばやく確認し、トレンド継続の可能性を評価できます。 特徴 強気の RSI 隠れダイバージェンスを検出(売られすぎの RSI とより高い安値) 弱気の RSI 隠れダイバージェンスを検出(買われすぎの RSI とより安い高値) ローカルのローソク足ウィンドウで過
FREE
Peak Trough Analysis is the great tool to detect peaks and troughs in your chart. Peak Trough Analysis tool can use three different peaks and troughs detection algorithm. The three algorithm include the orignal Fractals Indicator by Bill Williams, the Modified Fractals indicator and ZigZag indicator. You can use this peak and trough analysis tool to detect the price pattern made up from Equilibrium Fractal-Wave process. For further usage, there are good guide line on how to use this peak trough
FREE
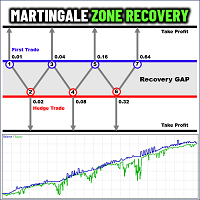
Martingale Zone Recovery MT5 EA Revolutionize your trading with the Martingale Zone Recovery MT5 EA , a powerful expert advisor designed for traders who want robust and dynamic trade management with unmatched versatility. Key Features: RSI-Based Signal Generation : Utilizes the Relative Strength Index (RSI) to identify high-probability trade opportunities in both trending and ranging markets. Advanced Zone Recovery System : Employs a martingale-based strategy to recover losing trades within pred
FREE

MetaTrader 5用 KS Pattern Indicator
このインジケーターは、あらゆるチャートおよび時間足において、ローソク足パターンとプライスアクション・パターンを自動的に識別します。
検出されるローソク足パターン(ShowCandlestick = true で有効化):
Doji(十字線) – 市場の迷いを示す中立的なパターン(表示名:"Doji")
Bullish Engulfing(強気の包み足) – 強気への反転シグナル(表示名:"Bullish Engulfing")
Bearish Engulfing(弱気の包み足) – 弱気への反転シグナル(表示名:"Bearish Engulfing")
Hammer(ハンマー) – 強気への反転シグナル。潜在的な底値圏で出現しやすい(表示名:"Hammer")
Shooting Star(流れ星/上ヒゲ大陽線) – 弱気への反転シグナル。潜在的な天井圏で出現しやすい(表示名:"Shooting Star")
Morning Star(明けの明星) – 強力な強気反転パターン(表示名:"Morning Star")
E
FREE

Nadaraya Watson Envelope MTF は価格に沿った滑らかな中心線と、その周囲を包むエンベロープを描き、価格がエンベロープの外で取引されたあとに内側へ戻ってきたバーを印で示します。 答える問いは狭く、そして本製品が答えると主張するのはその一つだけです。価格が自身の直近の中心から大きく離れ、いま離れることをやめた、という事実です。それを平均回帰の入り口と見るか、トレンドポジションの利益確定の場所と見るか、あるいは何とも見ないかは、利用者の判断です。インジケーターは事象の位置を示すだけで、その良し悪しを評価しません。 線の作り方 中心線は Nadaraya-Watson のカーネル回帰です。各バーはそれ以前のバーの加重平均であり、重みは距離とともに減衰するガウスカーネルで与えられます。エンベロープはその中心から上下に、指定した数の平均絶対誤差だけ離れた位置に置かれます。したがって価格が線の周りで荒れていた場所では広がり、おとなしかった場所では狭まります。 推定は因果的です。バー i はバー i、i-1、i-2 とさらに過去のバーから計算され、右側のバーが使われることは決
FREE
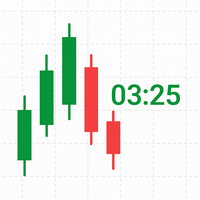
TimeLeftCandle – Countdown Clock for Candles in MT5 Overview
TimeLeftCandle is an indicator for MetaTrader 5 that displays in real time the remaining time until the current chart candle closes. Its design is minimalist, clear, and movable, adapting to any type of chart and trading style. Ideal for traders who need to precisely track candle closing times and make timely decisions. Main Advantages Clear and precise display: A digital-style counter to know exactly how much time is left before the
FREE

Strifor Chart Sync — MetaTrader 5でチャートとテクニカル分析を同期 Strifor Chart Sync は、複数のチャートを同期し、同一銘柄のマルチタイムフレーム分析を効率化するために設計されたMetaTrader 5用Expert Advisorです。 開いているすべてのチャートで銘柄を手動で変更する代わりに、 Master チャートの銘柄を変更するだけで、接続されているすべての Slave チャートが自動的に同じ銘柄へ切り替わります。各チャートのタイムフレームはそのまま維持されます。 例えば、以下のような構成で分析できます。 D1 — 市場全体の状況 H1 — 現在の市場構造 M5 — トレードセットアップ M1 — エントリーポイント Masterチャートの銘柄を US500 から XAUUSD に変更すると、接続されているすべてのチャートが自動的にXAUUSDへ切り替わります。 D1はD1のまま H1はH1のまま M5はM5のまま M1はM1のまま これにより、体系的なマルチタイムフレーム環境を構築し、各チャートを個別に更新することなく銘柄を切
FREE

Spike Catch Pro 22:03 release updates Advanced engine for searching trade entries in all Boom and Crash pairs (300,500 and 1000)
Programmed strategies improvements Mx_Spikes (to combine Mxd,Mxc and Mxe), Tx_Spikes, RegularSpikes, Litho_System, Dx_System, Md_System, MaCross, Omx_Entry(OP), Atx1_Spikes(OP), Oxc_Retracement (AT),M_PullBack(AT) we have added an arrow on strategy identification, this will help also in the visual manual backtesting of the included strategies and see ho
FREE
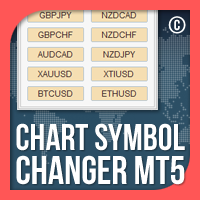
MT5のチャートシンボルチェンジャーは、パネルのシンボルボタンをクリックするだけでアタッチされている現在のチャートシンボルを変更するオプションを提供するインジケーター/ユーティリティです。 MT5のチャートシンボルチェンジャーは、あなたが注目して最もトレードしたいペアを追加することにより、あなたの個人的な好みに合わせて32のシンボルボタンを設定するオプションを提供します。このようにすると、数回クリックするだけでチャート上で市場をより速く表示できるため、チャンスを逃すことはありません。
MT5インストール/ユーザーガイド用チャートシンボルチェンジャー | 購入した製品の更新
特徴 パネル上の32のカスタマイズ可能なシンボル。これにより、同じチャートでお気に入りの機器を監視できます。 あらゆるシンボル/金融商品、口座タイプ、ブローカーでスムーズに機能します
MT5のチャートシンボルチェンジャーは、トレードとリスク管理、および一般的な手動トレードを支援するために、トレードパネルの形式でも提供されます。 手動トレードパネルMT5: https://www.m
FREE

本インジケーターは、チャート上で重要なサプライゾーンおよびデマンドゾーン(市場反応が期待される価格帯)を自動的に検出します。計算は構造化されたピボットロジックとATR(平均真の値幅)に基づく動的なゾーン幅を組み合わせて行われ、市場状況に応じて柔軟に表示が調整されます。 検出されたゾーンはチャート上に矩形として表示され、定義された価格動きによってミティゲーション(無効化)されるまで有効な状態を維持します。 動作仕様 ゾーンの自動検出: ピボット分析によりローカルの高値・安値を識別し、サプライゾーンおよびデマンドゾーンとして解釈します。 動的ゾーン幅: ゾーンのサイズはATR(平均真の値幅)によって制御され、倍率で調整可能です。 ミティゲーションロジック: 価格がゾーン内の設定された閾値を超えた場合、そのゾーンは無効と見なされます。 重複フィルター: 同種のゾーンが近接している場合、自動的にフィルタリングされ、視認性を向上させます。 マルチタイムフレーム分析: 計算は任意の時間足で実行でき、現在のチャートとは独立して設定可能です。 ゾーンはチャート上に色付きの矩形として表示され、各ゾーン内
FREE

Welcome to the future of algorithmic trading.
The Nascore Scalper EA is a precision-engineered, AI-inspired scalping robot built exclusively for trading NAS100 (US Tech 100 Index) . It analyzes smart money footprints, breakout zones, and high-timeframe bias to capture high-probability scalping entries. Key Features: Optimized for NAS100 (US100) – Fast-moving Nasdaq-based index trading Smart Money Concepts – Integrates structure, breakout logic, and bias Minimal Margin Usage – Ideal for traders
FREE

概要 KeltnerBB Fade は MetaTrader 5 向けの平均回帰型エキスパートアドバイザーです。ボリンジャーバンドがケルトナーチャネルに接近または交差する極端なボラティリティ拡大を捉え、平均への回帰方向にエントリーします。すべての取引で ATR ベースのストップロスと動的ポジションサイジングを使用します。 仕組み ボリンジャーバンドとケルトナーチャネルは現在の時間足で計算されます。選択したシグナルモードに応じて、厳密なクロスまたは接近しきい値のいずれかを用い、ボリンジャーバンドの上限または下限がケルトナーチャネルの対応するバンドに接近または交差した時点でエントリーが発生します。ポジションサイズは口座残高とリスク率の入力値から計算され、ストップロスは ATR に基づきます。決済方法は5つの設定可能なモードから選択できます。中央バンドへの回帰、チャネルへの再進入、スクイーズの反転、逆シグナル、RSI モメンタム減衰です。オプションの利益保護レイヤーとして、R倍数による部分決済ラダー、ブレイクイーブンロック、含み益時間による決済、口座残高比率のトレーリングラダーを追加できます
FREE

複雑なインジケーター、特にボラティリティの高いゴールド市場での取引にうんざりしていませんか?EasyTrend Gold MT5は、あらゆる時間足でゴールドのボラティリティを抑制するために設計されました。ATRの力を活用して、ゴールドの急激な動きを、ノイズを排除した一本の明確でダイナミックなトレンドラインに変換します。 M1でのスキャルピングであれ、H4でのスイングトレードであれ、トレンドの方向性と強さを視覚化し、レンジ相場(持ち合い期間)を容易に特定し、XAU/USDでいつ行動すべきかについての直感的な洞察を得ることができます。 その他の推奨資産 EasyTrendはゴールドのようなボラティリティの高い資産に最適化されていますが、そのロジックは、強いトレンドで知られる様々な市場でも非常に効果的です。 主要FX通貨ペア: EUR/USD, GBP/USD, USD/JPY 株価指数: US500 (S&P 500), US100 (NASDAQ), GER30 (DAX) 暗号資産: BTC/USD (ビットコイン), ETH/USD (イーサリアム) 商品 (コモディティ
FREE

Nicks Gold Quantum Master
Welcome to the premium promotional launch of the Quantum Series. This is an institutional-grade, fully automated high-frequency algorithm developed natively for the MetaTrader 5 terminal. Engineered specifically for the extreme liquidity pools of XAUUSD (Gold) on the M1 framework , this Expert Advisor uses a hyper-responsive Dual Exponential Moving Average (EMA) Strategy to capture micro-momentum swings. Equipped with our signature Virtual Target Execution System , th
FREE

Hi-Lo is an indicator whose purpose is to more precisely assist the trends of a given asset - thus indicating the possible best time to buy or sell.
What is Hi-lo?
Hi-Lo is a term derived from English, where Hi is linked to the word High and Lo to the word Low. It is a trend indicator used to assess asset trading in the financial market.
Therefore, its use is given to identify whether a particular asset is showing an upward or downward trend in value. In this way, Hi-Lo Activator can be tran
FREE
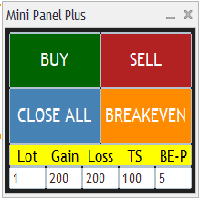
Remodeling the BoletaMiniPanel, the Mini Panel Plus has the same functionalities, but is now in the form of a box that allows it to be minimized and placed anywhere on the chart. Simple Panel with Stop loss (Loss), Stop gain (Gain), Trailing stop (TS) and Breakeven (BE-P). The Lot is the number of contracts to be traded. Gain is the number, in points, at which the stop gain will be positioned. If you don't want to place a stop gain, just put 0 (zero) in its place and when you open the order it w
FREE

PratikAlgo Universal Signals
PratikAlgo Universal Signals は、MetaTrader 5 向けの適応型マルチタイムフレーム・テクニカル分析インジケーターです。市場状況を分析し、ローソク足の確定後に潜在的な方向性セットアップを検出することを目的としています。
このインジケーターは、さまざまな銘柄と時間足で使用できます。分析パラメータは、現在選択されているチャートの時間足に応じて自動的に調整されます。
適応型トレーディングモード
短い時間足では、スキャルピング分析に適した短期的な市場変動を中心に分析します。
中程度の時間足では、デイトレードの市場環境に適応し、中程度の値幅を想定したセットアップを探します。
長い時間足では、より広い市場構造を分析し、スイング分析に適した広めの価格レベルを算出します。
主な機能
- 複数銘柄に対応 - 複数の時間足に対応 - 時間足に応じた自動適応 - ローソク足確定後のシグナル確認 - Buy / Sell シグナル矢印 - 市場トレンドの判定 - ADXによるトレンド強度分析 - 適
FREE
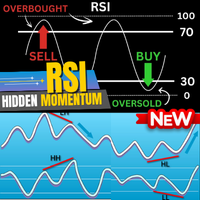
The Real RSI – プロフェッショナル・ダイバージェンス・ハンター 概要 The Real RSI は、RSI に基づく反転およびトレンド継続シグナルを高精度に検出するために設計された、プロフェッショナル向けのダイバージェンス検出インジケーターです。
価格と RSI の間に生じる 通常のダイバージェンス および 隠れたダイバージェンス を自動的に検出し、スマートなピボットロジックとリアルタイム構造検証によって各セットアップを確認します。
このインジケーターは、精度・安定性・実用性を重視して開発されており、実際の市場環境で 再描画せず遅延もない 動作を実現しています。 これらのダイバージェンスシグナルを自動取引で活用したい場合は、以下のEAを使用できます:
The Real RSI BOT – Auto Divergence Trading EA 主な機能 1. 自動ダイバージェンス検出 • 通常および隠れたダイバージェンスを自動検出(強気・弱気両対応)。
• Forex、Gold、Indices、Crypto など、すべての銘柄・時間足に対応。
• 反転型およびトレンド継続型
FREE

TM Price Stretch Map は、ローソク足の終値がバンドの外に出た後、次の確定足がバンド内に戻ったかどうかをチャート上に表示します。 実線のバンドは、その時点までに利用可能な価格だけを使う因果的なガウスカーネル計算に基づきます。上側バンドを超えて確定した足には赤い点、下側バンドを下回って確定した足には青緑の点を表示します。その次の確定足が両バンドの内側に戻ると、上側からの戻りには下向き矢印、下側からの戻りには上向き矢印を表示します。点と矢印は実線バンドだけで判定します。 任意の破線バンドは過去をさかのぼって平滑化するため、新しい足によって過去の線がリペイントされることがあります。破線は表示専用で、点や矢印の判定には使用しません。帯域幅、バンド幅、価格ソース、表示履歴、色、中心線、マーカーを設定できます。自動売買は行わず、反転を保証するものでもありません。
FREE
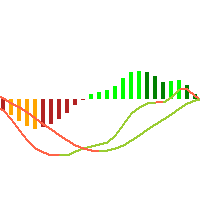
This is just a MACD with multi symbols, multi timeframes, and multi colors. features. different symbols and timeframes from the main chart. draw main line, signal line, and histogram. each line can be erased. the ascent and descent can be distinguished. Due to the above features, this MACD is suitable for multiple lineups in a single chart. This can be used in the same way as MiniCandles.
FREE

"Fakey PA" is a technical indicator for the MetaTrader 5 platform, designed to automatically identify the Fakey pattern (false breakout) on the chart. The Fakey pattern is a combination of an Inside Bar followed by a false breakout, which often precedes a strong price movement in the opposite direction.
What is the Fakey Pattern: Fakey is a three-bar false breakout formation: 1. Mother Bar - a wide bar that contains the next bar 2. Inside Bar - a bar completely within the range of the mother ba
FREE
MetaTraderマーケットは、履歴データを使ったテストと最適化のための無料のデモ自動売買ロボットをダウンロードできる唯一のストアです。
アプリ概要と他のカスタマーからのレビューをご覧になり、ターミナルにダウンロードし、購入する前に自動売買ロボットをテストしてください。完全に無料でアプリをテストできるのはMetaTraderマーケットだけです。

取引の機会を逃しています。
- 無料取引アプリ
- 8千を超えるシグナルをコピー
- 金融ニュースで金融マーケットを探索