 MetaTrader 5
 エキスパート
 インディケータ
 ライブラリ
 ユーティリティ
 ウィジェット
 ルール
YouTubeにあるマーケットチュートリアルビデオをご覧ください
ロボットや指標を購入する
仮想ホスティングで
EAを実行
EAを実行
ロボットや指標を購入前にテストする
マーケットで収入を得る
販売のためにプロダクトをプレゼンテーションする方法
MetaTrader 5のための無料のエキスパートアドバイザーとインディケータ - 21
 自動売買ロボットとインジケータを使用して、外国為替取引の収益性を高めます。 自動売買ロボットを使用すると、取引の開始と終了を自動化でき、インジケータは市場の行動をより正確に予測するのに役立ちます。
このページには、MetaTrader5アプリケーションのカタログが掲載されています。
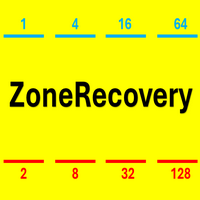
This is a high-risk strategy; it is recommended to set appropriate parameters.
1. Pending Opposite Stop Order – Used for breakout trading.
2. Multiplier – Determines the lot size of the opposite order.
3. Recovery Point – the distances of Pending Opposite Stop Order. For example, setting 200 for EUR/USD is reasonable.
4. Built-in Strategies – AutoSpike or AutoVolatility or Manually click-to-trade with your own strategy.
5. SL USD and TP USD – Money-based stop-loss or take-profit to close all
FREE
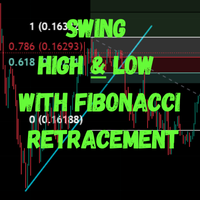
The Swing High Low and Fibonacci Retracement Indicator is a powerful technical analysis tool designed to identify key price levels and potential reversal zones in the market. It automatically detects recent swing highs and swing lows on the chart and overlays Fibonacci retracement levels based on these points. This indicator helps traders: Visualize market structure by highlighting recent swing points. Identify support and resistance zones using Fibonacci ratios (e.g., 38.2%, 50%, 61.8%). Adapt
FREE

Technical and Professional Description of the Indicator Price Structure, Fibonacci, Financial Volume, and Interest Zone Indicator This indicator was developed based on in-depth studies of price structure, Fibonacci levels, financial volume behavior, and the identification of market interest zones . Its primary purpose is to transform these different analytical elements into a structured visual tool, allowing users to identify key levels and areas of greater structural relevance on the chart in a
FREE

WaveMaster Oscilloscope
transforms your MT5 chart into a professional-grade oscilloscope - a precision instrument that converts market behavior into a live, multi-channel waveform. Instead of guessing what price is "doing," you simply watch it happen in real time. Inspired by the signal-analysis tools used in advanced electronics laboratories, WaveMaster oscilloscope reads the pulse of the market and renders it as a beautiful, animated waveform directly on your chart. This is not another lin
FREE

Master FlowPulseは、MetaTrader 5向けに開発されたプロフェッショナルな市場フローインジケーターです。 視覚的なフロープロファイル、方向別ゾーン、ローソク足のカウントダウン、動的なヒゲ反発検出を、1つの独立したインジケーターに統合しています。 プロファイルは価格目盛りの近くに表示されるため、メインチャート領域を確保しながら、買い圧力と売り圧力を明確に確認できます。 主な機能: 買いと売りのフローを示す視覚的プロファイル 動的な流動性および強度ゾーン 強気圧力と弱気圧力の自動分析 現在の銘柄と時間足の識別 W1、D1、H4、H3、H2、H1の視覚的基準 H1、M30、M15、M5のローソク足カウントダウン 現在のローソク足の横に表示される移動式カウントダウン 上ヒゲと下ヒゲの動的検出 反発の可能性を検出した際の視覚的パルス シアン系の色による買い反発表示 マゼンタ系の色による売り反発表示 黄色系の色による両方向反発表示 古い矢印と確認済みローソク足表示の自動削除 異なるチャートサイズに対応するレスポンシブレイアウト 通常チャートおよびストラテジーテスターのビジュア
FREE

**What it does**
Trend Pulse Lite draws a 50 EMA on the chart and paints it according to the market state:
- Green: uptrend. - Red: downtrend. - Gray: range, or a trend too weak to be taken seriously.
A moving average alone always has a slope, even if the price has been moving sideways for hours. That is why here the trend requires two conditions: an ADX above the minimum and a moving average slope large enough relative to the ATR. Because the slope is divided by the ATR, the same threshold
FREE
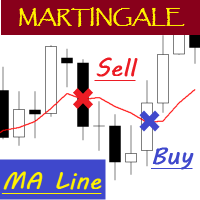
EA "MA Line" with martingale feature
To see how EA works, please watch the video below. In the video, I perform parameter optimization and do a backtest. The parameters that are optimized are: - MA Period - Stop Loss - Take Profit
For the future, I will try to optimize and test EA, especially the expert advisors in the mql5 community. hopefully it can be useful for colleagues in the mql5 community.
FREE

Smart Risk Panel Smart Risk Panel (SRP) は、手動トレーダー向けのインタラクティブなオンチャート管理パネルです。エントリー判断はユーザーが行い、SRPは注文発注、オープンポジション管理、口座保護を整理された作業スペースで行えるようにします。通常の変更のたびにEA Inputsへ戻る必要はありません。 強みは作業レイアウトです。注文入力、エントリー後の管理、任意のTelegramコマンド一覧が分かりやすいタブに分かれ、Quick Actionsは常にチャートの近くにあります。 3つのタブ、1つの作業スペース GUIは Trading Panel 、 Modify Orders 、 Telegram に分かれています。それぞれの役割が明確なので、チャートを見ながら注文と管理の流れを追いやすくなっています。 主なコントロールと機能 Trading Panel — 価格、ロット、数量、間隔を指定してBUY、SELL、BUY LIMIT、BUY STOP、SELL LIMIT、SELL STOPを実行できます。 Modify Orders — Trailin
FREE
エキスパートアドバイザーバージョン 手動シグナルではなく自動売買を好む場合は、こちらから本インジケーターのエキスパートアドバイザー版をご利用いただけます: https://www.mql5.com/en/market/product/148310
False Breakout Detector は、価格が直近のサポートまたはレジスタンスレベルを一時的に超えた後、すぐに元の範囲内に戻る状況を自動的に検出するインジケーターです。このような フェイクブレイクアウト は、逆張り戦略や裁量的なテクニカル分析に役立つ可能性があります。 主な機能: 過去N本のローソク足に対する フェイクブレイクアウトの自動検出 矢印、ライン、背景色 による視覚的なシグナル表示 ポップアップ通知およびプッシュ通知 によるリアルタイムアラート機能 パラメーターのカスタマイズ :分析するローソク足の本数、許容ピップ数、矢印の表示距離、カラー設定など 軽量かつ高速 なコード設計で、バックテストや実取引に最適化 互換性: タイムフレーム :M1 ~ H4 対応資産 :FX、株価指数、株式、商品など このインジケーターは、
FREE

CandleCloseTimer — ローソク足の確定までの時間を完全管理 CandleCloseTimerは、現在のローソク足が確定するまでの残り時間をチャート上に直接表示する、MetaTrader 5用のコンパクトなユーティリティです。タイマーは現在価格の近くに表示されるため、トレーダーが最も頻繁に確認する価格スケール付近で、必要な情報を常に確認できます。 このユーティリティは取引を開始せず、売買シグナルを提供せず、取引プラットフォームの動作にも干渉しません。選択した時間足の現在のローソク足が確定するまで、あとどれくらい時間が残っているかを正確に表示することが目的です。 CandleCloseTimerの主な機能 1. 現在のローソク足の確定までのタイマー 現在のローソク足が確定するまでの残り時間を、00:00:00形式で表示します。 2. 現在価格付近への表示 タイマーを価格スケールの近くや現在価格の下に配置できるため、チャート分析を妨げません。 3. 時間足の自動切り替え M1、M5、M15、H1、H4などの時間足を切り替えると、タイマーが残り時間を自動的に再計算します。 4.
FREE
デュアルライン信号、単一レベルシステム、マルチタイムフレーム対応、カスタマイズ可能なビジュアル信号、高度に設定可能なアラートシステムを備えた高度なMACD(移動平均収束拡散)。
フリーランスプログラミングサービス、アップデート、その他のTrueTL製品は私の MQL5プロフィール からご利用いただけます。
フィードバックとレビューを心よりお待ちしております!
MACDとは? MACD(Moving Average Convergence Divergence)は、資産価格の2本の指数移動平均の関係を示すトレンドフォロー型モメンタムインジケーターです。2本のラインで構成されています:MACDライン(高速EMAと低速EMAの差)とシグナルライン(MACDラインのEMA)。 トレーダーはMACDを使用してトレンド方向、モメンタムの転換、潜在的なエントリー/エグジットポイントを識別します。MACDラインとシグナルラインのクロスオーバー、およびゼロレベルの通過は、最も広く使用される取引シグナルの一つです。 機能: 単一レベルシステム(ゼロライン)を備えたデュアルラインMACD(メインライン
FREE

======================================================== OFX LIQUIDITY 1 - MQL5 MARKET PRODUCT DESCRIPTION (formatting notes: **bold** = editor Bold button; lines starting with "•" = bullet-list button; UPPERCASE lines = section headings) ========================================================
SHORT TITLE (product name field): OFX Liquidity - Buy-Side / Sell-Side Liquidity Pools for XAUUSD (Gold)
------------------------------------------------------- OVERVIEW ----------------------------
FREE

This tool is designed to visualize the position and trades history and its information, such as the entry and exit points, sizes of the trades, Reward to risk ratio, Risk percent, Profit, Target and stop-loss on the chart. it makes showing trades on the chart more informative and easier to use. it's a strategic tool that enhances your trading experience on MT5 platforms. By providing a clear visual representation of your trades and customizable settings, it empowers traders to make informed deci
FREE

Do you love VWAP? So you will love the VWAP Cloud . What is it? Is your very well known VWAP indicator plus 3-levels of Standard Deviation plotted on your chart and totally configurable by you. This way you can have real Price Support and Resistance levels. To read more about this just search the web for "VWAP Bands" "VWAP and Standard Deviation".
SETTINGS VWAP Timeframe: Hourly, Daily, Weekly or Monthly. VWAP calculation Type. The classical calculation is Typical: (H+L+C)/3 Averaging Period to
FREE

The Expert Advisor is only designed for manual trading. The EA sets stop loss and take profit for positions and pending orders on the current symbol. It also has trailing stop and breakeven functions.
Input Parameters Stop loss - stop loss value; Take profit - take profit value; Close all if profit reached the x percent of balance or - close all positions once the total profit reaches x percent of balance; close all if profit reached the x profit amount in currency - close all positions
FREE
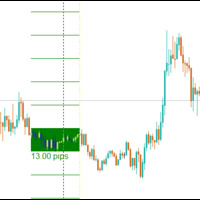
The Central Bank Dealers Range (CBDR) is a key ICT concept, used to project potential highs and lows for the day based on market conditions during a specific time window. The CBDR is utilized to forecast price movements in both bullish and bearish market conditions. By identifying this range, traders can better anticipate the price levels that may form as the day progresses.
CBDR and Standard Deviation A key feature of the CBDR is its application of standard deviation , a statistical measure u
FREE

TradeInfo is a utility indicator which displays the most important information of the current account and position.
Displayed information: Information about the current account (Balance, Equity, Free Margin). Current spread, current drawdown (DD), planned profit, expected losses, etc. Number of open position(s), volume (LOT), profit. Today’s and yesterday’s range. Remaining time to the next candle. Last day profit information. MagicNumber filter. Comment filter.
Indicator parameters: ShowPro
FREE

Supply Demand KPG – 需給ゾーンインジケーター for MetaTrader 5 Supply Demand KPGは、価格行動と出来高に基づいて需給ゾーン(レジスタンスとサポート)を自動的に識別します。ゾーンを手動で描く代わりに、インジケーターがチャート上に直接表示し、トレーダーが価格反転やブレイクの可能性がある領域を素早く見つけるのを助けます。
主な利点
1. スマートな需給ゾーンの検出 - 供給ゾーンはオレンジ色で表示 – 潜在的なレジスタンス領域。 - 需要ゾーンは青色で表示 – 潜在的なサポート領域。 - インジケーターはチャートを自動スキャンし、関連するゾーンのみを保持し、破られたまたは重複したゾーンを削除します。
2. 出来高に基づくゾーン強度評価 - 各ゾーンは累積出来高と全体に対する割合を表示します。 - 太い枠線 = 信頼性の高いゾーン。 - 細い枠線 = 信頼性が低いゾーン(追加確認が必要)。
3. 動的な更新と自動ゾーン削除 - 破られたゾーンは自動的に消え、チャートをクリーンに保ちます。 - 古いゾーンは削除され、最新のゾーンに焦点
FREE

Risk Calculator Veqrix
Risk Calculator Veqrix is a risk calculation, visual trade planning, and manual order execution tool for MetaTrader 5.
The EA automatically calculates the trade volume using the configured risk, entry price, and distance to the Stop Loss. It also displays the planned trade directly on the chart and distributes the total volume across up to three Take Profit targets.
This tool does not generate trading signals . The user selects the direction, configures the levels, and
FREE

Gann HiLo Swing is a free indicator for MetaTrader 5 with two of W.D. Gann's tools: the HiLo Activator line and the 2-bar swing chart. It shows the trend side and the swings. An arrow and an alert mark the start of a new trend. Everything comes from closed bars, so nothing on the chart changes after its bar has closed. Quick start Attach the indicator to any chart. It draws on the price chart. Keep the HiLo period at 3 (Gann's own), or raise it for fewer trend changes. Read the line. Blue is an
FREE

ChartWall is intended for displaying and automatic changing of wallpapers on a chart. It supports JPG and BMP formats. A file and a display style are selected via the built-in panel, which can be opened by clicking on the application icon (hidden button) that appears in the bottom left corner of the chart (main window) as you move the cursor to that area. Using the built-in panel you can also set a period for the rotation of images in minutes. Image files are selected randomly from the folder t
FREE

前日の高値と安値、週の始値、先週の値幅。多くのトレーダーが毎朝手で引き直している、まさにその線です。 Daily Weekly Monthly Key Levels は、お使いの業者の足からそれらを自動で引き、いまの価格が各水準からどれだけ離れているかを示します。どれだけ拡大しても消えません。 表示範囲の外に出た水準はチャートの端に貼り付き 、名前と価格の付いた価格チップと矢印で残るからです。売買サインなし、リペイントなし、ごちゃつきもなし。 引く線 前日 の高値、安値、終値。 前週 の高値と安値。 当日と当週の始値 。日中に強く意識される、進行中の始値です。 前月 の高値と安値(任意)。 各水準は名前の付いた線で、期間ごとに色を分けてあります。コンパクトなパネルは期間ごとにまとめて、すべての水準と、その価格、そして現在値がどれだけ離れているかを並べます。距離の表示はピップス、価格、パーセントから選べます。 拡大しても消えない水準 日中足では、重要な水準の多くが表示価格帯の外に出ます。金ならほとんどが、ほとんどの時間そうです。見えない水準は役に立たないどころか有害です。遠くにあるも
FREE
Color Levels - удобный инструмент для тех, кто использует технический анализ с использованием таких инструментов, как Трендовая линия и Прямоугольник. Имеется возможность настройки двух пустых прямоугольников, трех закрашенных и двух трендовых линий. Настройки индикатора крайне просты и делятся на пронумерованные блоки: С цифрами 1 и 2 вначале - настройки пустых прямоугольников (рамок); С цифрами 3, 4 и 5 - настройки закрашенных прямоугольников; С цифрами 6 и 7 - настройки трендовых линий. Объ
FREE

このエキスパートアドバイザーは、 Didi Index インジケーターのロジックを基に、MetaTrader 5 上で取引を自動化するために開発されました。
EA は、ユーザーが設定したルールとパラメータに従い、すべての取引をチャート上で自動的に実行します。 本ロボットは、明確で客観的なエントリーおよび管理ロジックを適用することを目的としており、外部連携や追加ライブラリを使用せずに、取引状況を分かりやすく確認できます。 主な機能 自動取引
Didi Index インジケーターのロジックに基づいて取引を自動で実行します。 取引時間の設定
EA が取引を行う時間帯を指定できます。設定時間外では新規取引は行われません。 トレーリングストップ
設定された条件に従い、価格の動きに合わせてストップを自動調整します。 自動ブレイクイーブン
条件を満たした際に、ストップをエントリー価格へ自動的に移動します。 チャート上の情報パネル
EA の稼働状況や取引情報をリアルタイムで表示します。 対応環境 MetaTrader 5
デモ口座およびリアル口座
プラットフォームに対応したすべての銘柄で動作
FREE

MACD Titanium は、MetaTrader 5 用の Zero-Lag MACD インジケーターであり、従来の MACD と比較してより高速で明確なモメンタムシグナルを提供します。 Zero-Lag EMA 計算を使用することで、シグナルの遅延を軽減し、市場モメンタムの変化により迅速に反応します。同時に、トレーダーが慣れ親しんだ MACD の構造を維持します。 特徴 • Zero-Lag EMA を使用して遅延を削減
• モメンタム変化への高速反応
• クロスオーバーポイントを明確に表示
• 背景カラーで現在のモメンタム方向を可視化
• すべての時間足と銘柄に対応 リペイントなし。
すべてリアルタイム計算。 視覚構造 アクアライン – MACD
オレンジライン – シグナル
緑ドット – 強気クロス
赤ドット – 弱気クロス
背景色 – 現在のモメンタム方向 緑 = 強気優勢
赤 = 弱気優勢 視認性を重視した設計です。 用途 • トレンド継続エントリー
• モメンタム確認
• 早期クロス検出
• レンジ相場でのダマシ回避
• マルチタイムフレーム分析 FX、指数、暗号資産、
FREE

本インジケーターは、チャート上で重要なサプライゾーンおよびデマンドゾーン(市場反応が期待される価格帯)を自動的に検出します。計算は構造化されたピボットロジックとATR(平均真の値幅)に基づく動的なゾーン幅を組み合わせて行われ、市場状況に応じて柔軟に表示が調整されます。 検出されたゾーンはチャート上に矩形として表示され、定義された価格動きによってミティゲーション(無効化)されるまで有効な状態を維持します。 動作仕様 ゾーンの自動検出: ピボット分析によりローカルの高値・安値を識別し、サプライゾーンおよびデマンドゾーンとして解釈します。 動的ゾーン幅: ゾーンのサイズはATR(平均真の値幅)によって制御され、倍率で調整可能です。 ミティゲーションロジック: 価格がゾーン内の設定された閾値を超えた場合、そのゾーンは無効と見なされます。 重複フィルター: 同種のゾーンが近接している場合、自動的にフィルタリングされ、視認性を向上させます。 マルチタイムフレーム分析: 計算は任意の時間足で実行でき、現在のチャートとは独立して設定可能です。 ゾーンはチャート上に色付きの矩形として表示され、各ゾーン内
FREE

AURIC MOHD-iK is a dynamic, logic-based Expert Advisor (EA) engineered specifically for trading XAUUSD (Gold). Unlike standard trading systems that rely on lagging, unreliable indicators, this EA operates purely on clean price logic—executing trades the way an experienced human trader naturally reads the market. This version is completely free with limitations, offering permanent value to your trading setup with zero hidden costs. Active Auric Mode That's it!!!!!!!!!! Core Trading Parameters Ac
FREE

Backed by volume , this is a professional-grade VWAP tool anchored to swing points rather than time sessions. Provides directional bias through cyan/magenta color-coding and standard deviation bands for high-probability entries. How It Works Bullish : Close above Depth period high → VWAP anchors to swing low, color = Cyan Bearish : Close below Depth period low → VWAP anchors to swing high, color = Magenta On structure break, VWAP re-anchors to previous swing extreme automatically Key Features N
FREE

Squeeze Breakout Trader - ボラティリティスクイーズ + ブレイクアウトEA Squeeze Breakout Traderは、古典的な「ボラティリティスクイーズ」パターンを取引する完全自動売買のエキスパートアドバイザーです。市場が低ボラティリティのレンジに収縮するのを待ち、価格がボラティリティの拡大とともにブレイクアウトした時点で即座にエントリーします。スクイーズはボリンジャーバンドとケルトナーチャネルを比較することで検出されます。ボリンジャーバンドが収縮して(より広い)ケルトナーチャネルの内側に完全に収まると、ボラティリティが異常に低くなり、その後強い方向性のある動きが続くことがよくあります。 取引の仕組み 新しいバーごとにボリンジャーバンド(価格ボラティリティバンド)とケルトナーチャネル(EMA中央線 +/- ATRベースのエンベロープ)を計算します。 「スクイーズ」を確認します:直前の確定バーでボリンジャーバンドがケルトナーチャネル内に完全に収まっていたこと。 スクイーズ直後に価格がケルトナーチャネルの上限バンドを上抜けて引けた場合に買いを、スクイーズ後
FREE

Overview LiquidX Hunterは、ドンチアンチャネルの流動性レベルを基盤としたブレイクアウト型エキスパートアドバイザーで、ATRベースのボラティリティフィルタリング、パーセンテージ式利確、および損失後の回復フィルターを組み合わせています。 XAUUSD、H1 向けに設計・テストされており、直近の負けトレードから価格がまだ離れていない市場への再エントリーを避けながら、明確な方向性のブレイクアウトを狙います。 How it works EAは設定可能なドンチアン参照期間における最高値と最安値を追跡します。 価格が指定されたポイントオフセット分チャネルを突破するとトレードが開始されます——上限を上抜けで買い、下限を下抜けで売り。 ストップロスはATR倍率を用いて設定され、固定距離ではなく現在のボラティリティに適応します。 利確は建値のパーセンテージとして設定されます。 オプションのATRトレーリングストップはトレードの進行に応じて利益を確保でき、最低ATR利益しきい値に達した場合のみ作動し、市場価格または既存の利確に近すぎる場合は送信されません。 負けトレードの後、EAは損失
FREE

Know exactly how much time remains before the current candle closes. HMS Candle Timer MT5 is a lightweight and customizable candle countdown indicator designed for traders who want a clear view of the remaining time on the active candle. The countdown is displayed directly near the current candle, keeping important timing information visible without turning your chart into a complicated dashboard. Whether you trade lower timeframes or monitor longer market structures, HMS Candle Timer provides a
FREE

目的/戦略
このエキスパートアドバイザーは、ルールベースのフィボナッチプルバックロジックを実装しており、「セカンドトレード」ウィンドウ向けに設計されています。定義されたスイングムーブの後、EA は 0.618 リトレースメント(設定可能な許容誤差付き)へのリバウンドを待ち、EMA トレンドの方向にのみ取引を行います(オプション)。
シグナルロジック(簡略化)
ルックバックバー(高値/安値)によるスイングの検出
EMAバイアス(終値対EMA)によるトレンドフィルター
価格が0.618の範囲(許容ポイント)に触れた場合のエントリー
SL = ATR × 乗数
TP = フィボ拡張 (0.50 / 0.559 / 0.618 / 0.667 から選択可能)
リスク管理 / 実行
ボリューム:固定ロットまたはリスクベース (% 自己資本) から選択可能、さらに MaxLotCap をハード上限として設定
ブローカーの互換性: シンボル仕様からフィリングモードが自動的に選択されます。ストップレベルとボリュームステップが考慮されます。
オプションのマージンフィット(バリデータ/
FREE

インジケーターは、任意の時間枠からの任意のシンボルの最小化されたチャートを表示します。表示されるチャートの最大数は28です。チャートはメインウィンドウと下部ウィンドウの両方に配置できます。 2つの表示モード:キャンドルとバー。表示されるデータ(バーとキャンドル)の量とチャートのサイズは調整可能です。 ミニチャットを使用するには、最初に目的のインジケーターを通常のチャートに配置し、それをテンプレートとして保存し、適切なパラメーターを使用してミニチャートのテンプレートを適用する必要があります。たとえば、最初のチャートでは、パラメータは「テンプレート名1」と呼ばれます。 パラメーター: Charts base corner-ベースコーナー Charts subwindow number-サブウィンドウの番号 Charts X/Y shift-開始X / Yオフセット Charts width/height-ウィンドウの幅/高さ Space X/Y between charts-チャート間のX / Y距離 Charts scale-スケール Show date/price scale-時間/価
FREE
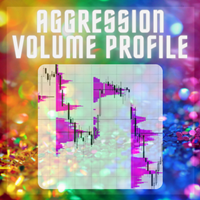
This indicator plots the volume profile by Price on the chart
There are 5 ways to view it:
By Total Volume Traded (Premium Version); Volume Ticks(Forex) Separated by Buyers and Sellers (Premium Version); Buyers Only (Premium Version); Sellers Only (Premium Version); Business balance (Buyers - Sellers) (Premium Version); .
It is possible to select how many days the profiles will be calculated.( Premium Version)
On the current day it recalculates the histogram data for each new candlestick.
FREE

Automated Forex Trading • Dynamic Trade Management • Risk Controls INTRODUCTION Wolf EURUSD Scalper is an automated Expert Advisor (EA) for MetaTrader 5, primarily designed for trading EURUSD. Developed for traders who value speed, structured execution, and disciplined risk management, Wolf EURUSD Scalper combines automated market analysis with dynamic trade management and configurable trading controls. The EA evaluates market conditions, identifies potential trad
FREE

製品概要 Pyramiding Entry Master は、 MT4 と MT5 の両プラットフォーム向けに設計された、メインチャート用の移動平均線トレンドフォローおよびピラミッディングエントリーインジケーターです。メインチャートに4期間の移動平均線システム(MA5、MA10、MA20、MA60)を描画し、55期間トレンドモメンタムモデル、出来高拡大確認、複数の売られ過ぎ条件に基づいて、3種類の買いシグナルを自動生成します。Chase(半路追撃)、Add(翌日ピラミッディング)、Dip Buy(深層売られ過ぎ底値狙い)の3つで、トレンド加速追撃、翌日押し目追加、深層売られ過ぎ反転という3つの典型的なエントリーシナリオを網羅します。厳密なシグナルロジック、明確な視覚的階層、独立したクールダウンフィルターとマルチチャネル通知機構を備え、ピラミッディング取引システムを構築するための理想的なメインチャートツールです。 主要機能 4期間移動平均線システムと右側ラベル 本システムはメインチャートに4本の移動平均線を描画します。 MA5 白線 は超短期の価格重心を反映し、 MA10 黄線 は
FREE

Live Version Here : https://www.mql5.com/en/market/product/ 160868 Complete Guide to the Candle Diamond Pattern for MT5 Introduction to the Candle Diamond Pattern Indicator The Diamond Candlestick Pattern indicator for MetaTrader 5 is an advanced technical analysis tool designed to identify diamond-shaped consolidation formations, followed by potential directional breakouts. This technical formation represents a period of market indecision that generally precedes significant price movements.
FREE

AI Range Compression Scanner automatically finds periods of tightening volatility - price squeezes - and highlights them as a shaded zone on the chart, then marks the breakout the moment price escapes the squeeze. Volatility contraction almost always precedes an expansion move, and this indicator lets you see it building in real time. The indicator continuously compares a short-term price range against a longer-term baseline range. When the short-term range compresses below your chosen percentag
FREE

Two EMA-difference histograms with confirmed crossover labels and historical BUY and SELL boxes.
Ospe Dual MACD plots two MACD-style EMA differences in one separate window: a 12/26 pair and a 5/13 pair by default. It displays colored histograms and matching lines. The color of each histogram changes with its position relative to zero and its movement from the preceding bar.
When the faster difference crosses above the slower difference on a completed candle, the indicator places a green BUY box
FREE

Vertex Aurum Gold — Smart Money Concepts (SMC) Auto-Trading System for XAUUSD Vertex Aurum Gold is an Expert Advisor for MetaTrader 5 built around Smart Money Concepts market structure. It detects swing and internal structure breaks, order blocks, fair value gaps, and liquidity zones directly on the chart, then uses that structure as the basis for a rule-based signal, execution, and risk engine. Structure detection can also be run on its own, with auto-trading switched off, for chart analysis on
FREE

Makito Buy and Sell Indicator は、プライスアクション、市場構造、値動きの確認条件を組み合わせ、潜在的な買い・売りの機会を見つけやすくするためのMT5インジケーターです。 必要な条件が揃うと、チャート上に分かりやすい BUY または SELL の矢印を表示します。さらに、オプションのリスク・リワードゾーンにより、ストップロスや目標価格として検討できる範囲を視覚的に確認できます。 主な機能 明確で見やすいBUY・SELL矢印 プライスアクションと市場構造の分析 不要なシグナルを抑えるレンジ相場フィルター 短時間に同じシグナルが連続することを防ぐクールダウン機能 リスクとリワードの範囲を示すチャート表示 ポップアップ、サウンド、プッシュ通知、メール通知 ローソク足が確定した後にシグナルを確認 複数の銘柄および時間足で使用可能 インジケーター専用であり、自動的な注文は行いません 緑色の上向き矢印は潜在的な 買い機会 を示し、赤色の下向き矢印は潜在的な 売り機会 を示します。シグナルは単独で使用するのではなく、現在のトレンド、重要な価格帯、サポートとレジスタンス、
FREE

Trading Sessions Kill Zones Regional sessions, New York kill zones, Silver Bullet windows, Asian range, day opens, previous day/week/month levels and ADR on one MT5 chart. See the structure of the trading day on your MT5 chart: regional sessions, intraday windows, the Asian range and reference levels in one indicator. Sydney, Tokyo, London and New York session boxes show each high, low and range in points. Regional daylight saving is handled separately. Choose soft translucent fills or clear out
FREE
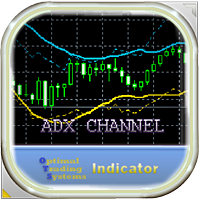
This indicator forms a channel based on the readings of the ADX (Average Directional Movement Index) indicator, displays and informs the trader of a price reversal at the boundaries of this channel, and can also report when the price touches the channel boundaries. It also draws additional dotted lines, which depend on the readings of the + DI and -DI of the ADX indicator. It also has an option for filtering signals depending on the readings of the stochastic. The channel drawn by this indicato
FREE

The idea of a Value Chart indicator was presented in the very good book I read back in 2020 , " Dynamic Trading Indicators: Winning with Value Charts and Price Action Profile ", from the authors Mark Helweg and David Stendahl. The idea is simple and the result is pure genius: Present candlestick Price analysis in a detrended way!
HOW TO READ THIS INDICATOR
Look for Overbought and Oversold levels. Of course, you will need to test the settings a lot to find the "correct" one for your approach. It
FREE

The indicator displays the orders book, as well as increases its depth, remembering the location of orders that have gone beyond the current "window" view.
Indicator capability Display the levels of open positions. Simulation of placing/cancelling/editing pending orders directly in the displayed orders book.
Indicator features The orders book display works only on those trading symbols for which it is broadcast by the broker. To reset the information about the rows that were recorded in the Sm
FREE
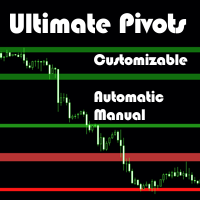
Ultimate Pivot Levels indicator for MetaTrader 5 Ultimate_Pivot_Levels is versatile tool designed to enhance your trading experience by accurately plotting pivot levels on your charts. It allows entering your desired values manually or using well known pivot calculation methods to create pivot levels. It draws the levels in the background and allows you to customize levels, size and colors of areas, and it keeps your adjustments while extending the levels to every new bar. Whether you are a novi
FREE

European Dollar Phoenix Trader — Automated EURUSD Trading for MetaTrader 5
Fully automated EURUSD trading on H4. Attach, set your lot size, and let it run. No martingale. No grid.
European Dollar Phoenix Trader is a fully automated trading robot for EURUSD, running on the MetaTrader 5 platform. It is designed for traders who want a hands-off approach to EURUSD without configuring complex parameters or monitoring charts throughout the day. Every trade carries a hard stop loss from the moment i
FREE

Nicks Quantum Scalper Free
Welcome to the Free Edition of the Quantum Series. This is an institutional-grade, fully automated scalping algorithm developed natively for the MetaTrader 5 terminal. Specifically engineered for the ultra-liquid EURUSD M15 framework, this Expert Advisor completely discards chaotic lagging indicators. Instead, it utilizes an advanced, hyper-responsive Dual Exponential Moving Average (EMA) Trend Engine to exploit intraday overextended price expansions. Equipped with a
FREE

Badokers Pro EA is an automated trading solution designed to capture market movements across multiple trading conditions. Built with a focus on precision, robust risk control, and structured trade management, this EA offers a complete, systematic trading approach suitable for both novice and experienced traders.
=== KEY ADVANTAGES & FEATURES ===
• Flexible Trading Modes: Executes trades based on Market Momentum (Breakout), Trend Continuity (Pullback), or Market Exhaustion (Reversal). • Multi-
FREE

======================================================== OFX DELTA — MQL5 MARKET PRODUCT DESCRIPTION (formatting notes: **bold** = editor Bold button; lines starting with "•" = bullet-list button; UPPERCASE lines = section headings) ========================================================
SHORT TITLE (product name field): OFX Delta — Per-Bar Volume Delta / Order-Flow Imbalance for XAUUSD (Gold)
------------------------------------------------------- OVERVIEW -------------------------------
FREE

Eclair は、MetaTrader 5 向けに開発された高度なボリュームフロー分析インジケーターです。複数の出来高インジケーターを1つのモダンでドラッグ可能なパネルに統合し、市場の買い圧力と売り圧力を素早く視覚化したいトレーダー向けに設計されています。 パネルは、11種類の出来高およびマネーフロー指標をリアルタイムで正規化表示し、モメンタム、蓄積、分配、機関投資家の圧力を直感的かつ視覚的に把握できます。 搭載インジケーター OBV (On Balance Volume) VPT (Volume Price Trend) CVD (Cumulative Volume Delta) EMV (Ease of Movement) Force Index ADL (Accumulation Distribution Line) MFI (Money Flow Index) VFI (Volume Flow Indicator) CMF (Chaikin Money Flow) Chaikin Oscillator Demand Index 主な機能 完全ドラッグ可能なパネル リアルタイム自
FREE

Tension Flow Trend — 過去検証RRバックテスト機能付きダイナミックHMAリボン Tension Flow Trendは、ハル移動平均線(HMA)トレンドリボン、Zスコア(Z-Score)モメンタム分析、および内蔵された視覚的なリスクリワード(Risk:Reward)バックテストエンジンを1つのチャート上に統合した、MetaTrader 5向けの高度なトレンドフォロー型インジケーターです。高確率なトレンド継続の機会を特定するように設計されており、トレードのセットアップを生成する前に、傾きで確認されたHMAのクロスオーバーと、設定可能なシグナル・クールダウン(待機時間)の両方を要求することで、市場のノイズをフィルタリングします。 有効な買い(BUY)または売り(SELL)シグナルが発生すると、インジケーターはエントリー価格、ATR(200)に基づくストップロス(損切り)、およびリスクリワード比率に基づくテイクプロフィット(利確)レベルを含む完全なトレード構造をチャート上に自動的に計算してプロットします。動的なTP(利確)およびSL(損切り)ボックスは、いずれかのレベルに
FREE

ICT Silver Bullet CRT EA: Master the Market's True Rhythm Are you an ICT student who understands the power of timing and liquidity, but struggles to be present for every high-probability setup? Do you want to automate the precision of the "Silver Bullet" strategy to ensure you never miss an opportunity? Introducing the ICT Silver Bullet CRT EA , the ultimate tool for traders who think in terms of liquidity, market structure, and fair value. This Expert Advisor was meticulously programmed to repl
FREE

Frato Cumulative Delta PROは、ローソク足ごとに買いと売りの勢いの不均衡を測定するオーダーフロー分析インジケーターです。
従来のボリュームインジケーターとは異なり、Deltaは各ローソク足内の圧力の方向を計算するため、価格が確定する前に、買い手と売り手のどちらが動きをコントロールしているかを特定できます。
結果は、別のウィンドウにカラーヒストグラムとして表示されます。緑色のバーは買い優勢、赤色のバーは売り優勢を示します。
MetaTrader 5のすべての資産と時間足に対応しています。ティックボリュームとリアルボリュームの両方で動作します。リペイントはありません。
このバージョンは、Frato Academyの高度な製品で使用されているオーダーフロー分析手法の中核を成すものです。
ご質問やサポートについては、製品のコメント欄をご利用ください。
FREE
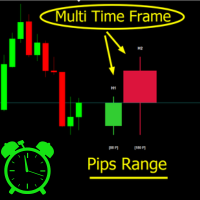
Crystal MTF Candle Pro – Professional Multi-Timeframe Analysis Tool Overview
Crystal MTF Candle Pro is a professional indicator for MetaTrader 5, designed to provide direct visualization of higher timeframe candles on the current chart. The tool overlays selected higher timeframe candles with precise countdown timers, allowing traders to monitor live candle development without switching charts. This indicator is optimized for multi-timeframe (MTF) analysis, offering professional styling, custo
FREE

Liquidity Sweep Candles marks candles that take out the high or the low of the previous candle (a liquidity sweep) and classifies them by where they close. Three types The signal candle [1] is compared with the previous candle [2]. FU : the candle sweeps the high (low) of [2] and closes beyond it. The weakest type: in most cases this is an ordinary trend candle. AFU : the candle sweeps the high (low) of [2] and closes back inside the range of [2]. SFU : the candle sweeps the high (low) of [2] an
FREE

Enhanced Volume Profile: The Ultimate Order Flow & Liquidity Analysis Tool
Overview
Enhanced Volume Profile is an indicator for MetaTrader 5 that displays the traded volume at specific price levels over a defined period. It separates the total volume into buy and sell components, presenting them as a side-by-side histogram on the chart. This allows users to observe the volume distribution and the proportion of buy and sell volumes at each price level. Graphics Rendering
The indicator uses the
FREE

SmartTrailingStop is a universal trailing stop utility that works on any positions — manual trades or orders opened by any EA. Pick from four trailing modes, add break-even and partial close, and let it manage every position on your account. Also check our gold EAs: Aurora Golden Goddess | Midas The Golden Touch | Golden Fatima
Designed for swing traders who hate watching charts, scalpers who need precise stops, and anyone running multiple EAs that lack a quality trailing module.
Fo
FREE
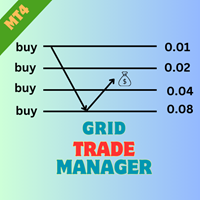
EA GridTradeManager MT4を紹介します。これは、MetaTrader 4プラットフォーム上でのグリッドトレーディング戦略を最適化するために設計された強力なトレーディングエキスパートアドバイザーです。このツールは、グリッドオーダーの配置と管理を自動化し、市場の変動を効果的に活用したい初心者と経験豊富なトレーダーの両方に最適です。 MQL製品のインストールガイド | MT4/MT5で購入したMQL製品の更新 | 一般的なトラブルシューティングガイド | 一般設定 / 入力ガイド | バックテストとセットファイル 高度な機能を備えたEA GridTradeManager MT4は、動的なグリッド調整を可能にし、ドローダウンを大幅に削減し、利益の可能性を最大化することでトレーディング効率を向上させます。forexペアや暗号通貨のようなボラティリティの高い資産でのトレーディングに最適で、ユーザーはこのEAを簡単に実装して、ハンズフリーのトレーディング体験を享受しながら、堅牢なリスク管理を維持できます。 MQL製品のインストールガイド | MT4/MT5で購入したMQL製品の更
FREE

ピボットポイントは、市場のかなりの部分が毎セッション意識している支持と抵抗の水準で、どのチャートでも計算式は同じです。この Pivot Points は直前に確定した足からそれを組み立てて描きます。中心のピボット、抵抗、支持のそれぞれに価格を表示し、現在値からの距離も出します。 三つの計算方式 Classic 、いわゆるフロアピボット。中心のピボットと R1 から R3、S1 から S3 まで。 Fibonacci 。前の値幅の 0.382、0.618、1.000 の比率に抵抗と支持を投影します。 Camarilla 。終値をもとにした水準で、反転の R3 と S3、抜けの R4 と S4 を含みます。 日足、週足、月足のいずれかで ピボットを組み立てる期間を選べます。その日のセッションなら日足、週や月をまたいで効く上位の水準なら週足や月足です。一度に一つの期間だけを描くので、チャートが読みにくくなりません。 どの水準もひと目で読めます 各水準は価格を表示した線として引かれ、コンパクトなフォージパネルには Resistance、Pivot、Support の順にまとめられ、各グ
FREE

Auto Fibonacci Buy/Sell Zones is a powerful , 100% automated trading indicator designed for MetaTrader 5. It eliminates the hassle of manually drawing Fibonacci levels by instantly detecting market swings and projecting dynamic Buy and Sell zones directly onto your chart. Whether you are a scalper, day trader, or swing trader, this indicator adapts seamlessly to any financial instrument (Forex, Crypto, Indices, Commodities) and works perfectly across all timeframes. Key Advantages & Features
FREE

SAR Manager SAR Managerは、標準のParabolic SARアルゴリズムを基盤としたMetaTrader 5用のシグナルインジケーターです。SARの方向変化を検出し、仮想BUYおよびSELLシグナルを生成して、Stop LossとTake Profitの水準を計算します。関連するすべての情報はチャート上に直接表示されます。 本製品は、市場分析および手動取引の補助を目的としています。実際の取引注文を発注、変更、決済することはありません。 シグナルの計算 Parabolic SARのポイントが価格の上側から下側へ移動すると、BUYシグナルが確定します。SARのポイントが価格の下側から上側へ移動すると、SELLシグナルが確定します。 新しいシグナルは、ローソク足が確定した後にのみ計算されます。現在形成中のローソク足は、エントリーの確定には使用されません。仮想エントリー価格には、SARの方向変化が確定した次のローソク足の始値が使用されます。 インジケーターが同時に追跡する仮想ポジションは1つのみです。ポジションが有効である間、新しいエントリーは生成されません。Stop L
FREE

AI Divergence Scanner Multi Symbol continuously scans an entire watchlist of symbols for RSI divergence at the same time, so you never have to manually flip through charts looking for a setup - the scanner brings the divergences to you on a single panel. KEY FEATURES
- Monitors a fully customizable list of symbols simultaneously (default: EURUSD, GBPUSD, USDJPY, XAUUSD, AUDUSD) - add or remove any symbols your broker offers.
- Detects both bullish divergence (price makes a lower low while RSI ma
FREE

Professional Volume Weighted Average Price (VWAP) indicator for MetaTrader 5.
FEATURES: - 6 modes: Session, Daily, Weekly, Monthly, Rolling, Custom - Dynamic color line: Green above VWAP, Red below VWAP - Volume-weighted standard deviation bands (adjustable multiplier) - Auto session detection with reset - Smart volume handling (real/tick volume fallback) - Non-repainting calculation - Works on all symbols and timeframes
INPUTS: - VWAP Mode: Choose calculation method - Anchor Timeframe: For c
FREE
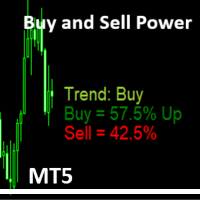
Simple Indicator that shows the Buy and Sell volume in percent.
The Buy and Sell Power indicator for MetaTrader 5 calculates and displays estimated buy/sell volume percentages over a user-defined period (default: 14 bars) using tick volume data. It overlays text labels on the chart showing Buy % (with "Up" if >51%), Sell % (with "Dn" if >51%), and a trend signal based on thresholds: Neutral (<55%), Trend: Buy/Sell (55%+), Trend: Strong Buy/Sell (62%+), Trend Max UP/Down (65%+), or Trend change s
FREE

StatsMood Position Sizer Short Description Calculate position size instantly based on your risk and stop loss distance. Simple, fast and precise. Full Description Position sizing is one of the most important aspects of risk management. StatsMood Position Sizer is a free MT4/MT5 indicator that helps you calculate the appropriate lot size in real time based on your account balance, selected risk percentage and stop loss distance. It removes the need for manual calculations and helps maintain cons
FREE

このプロジェクトが好きなら、5つ星レビューを残してください。 機関が大きなボリュームを取引するので、それらが試してみることは珍しくありません
特定のパーセンテージレベルでポジションを守る これらのレベルは、あなたが使用できる自然なサポートと抵抗として役立ちます
取引を入力するか、ポジションに対する危険性を認識する。 一般的に使用されるパーセンテージの例は、EURUSDの0.25%と0.50%です。
毎週、スクリーンショットでこの例を見ることができます。 このインジケータを使用すると、以下の割合の変動を描画することができます。 日。 週。 月 日 クォーター。 生年月日
FREE
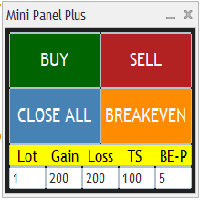
Remodeling the BoletaMiniPanel, the Mini Panel Plus has the same functionalities, but is now in the form of a box that allows it to be minimized and placed anywhere on the chart. Simple Panel with Stop loss (Loss), Stop gain (Gain), Trailing stop (TS) and Breakeven (BE-P). The Lot is the number of contracts to be traded. Gain is the number, in points, at which the stop gain will be positioned. If you don't want to place a stop gain, just put 0 (zero) in its place and when you open the order it w
FREE

ELOHIM FX – BREAKOUT FIB Session Breakouts. Fibonacci Levels. Clear Trading Structure. Elohim FX – Breakout Fib is a professional MetaTrader 5 indicator designed to help traders identify session opening-range breakouts and automatically map important Fibonacci levels after a confirmed breakout. The indicator combines market structure, session ranges, previous higher-timeframe levels, breakout confirmation and Fibonacci projections into one clean visual trading tool. KEY FEATURES Previous High /
FREE

ForexFanclub(FFC) : For detailed instructions and our official website, please visit my profile !
Localtime - Chart Time Display Utility Trading across multiple time zones can sometimes be confusing. Localtime is a lightweight, easy-to-use utility indicator designed to display your preferred local time (or any specific time zone) directly on your MetaTrader chart. By keeping the current time visible at a glance, you can easily track market session openings, upcoming economic news releases, and
FREE
MetaTraderマーケットは、他に類のない自動売買ロボットやテクニカル指標の販売場所です。
MQL5.community ユーザーメモを読んで、取引シグナルのコピー、フリーランサーによるカスタムアプリの開発、支払いシステムを経由した自動支払い、MQL5Cloud Networkなど、当社がトレーダーに対して提供するユニークなサービスについて詳しくご覧ください。

取引の機会を逃しています。
- 無料取引アプリ
- 8千を超えるシグナルをコピー
- 金融ニュースで金融マーケットを探索