YouTubeにあるマーケットチュートリアルビデオをご覧ください
ロボットや指標を購入する
仮想ホスティングで
EAを実行
EAを実行
ロボットや指標を購入前にテストする
マーケットで収入を得る
販売のためにプロダクトをプレゼンテーションする方法
MetaTrader 5のための無料のエキスパートアドバイザーとインディケータ - 9

This indicator marks the SMA crossover candles. To use this indicator properly you should / could also add the Moving Average indicator.
If you do, use the default length of 8 or use the length you used as input within this indicator.
Which I tend to use as my entry model.
Usually when this occurs within my marked supply or demand zone you could end up with a price explosion heading toward the next weak high / low or even toward the daily high / low.
I personally use it on the 2-3 min cha
FREE

Basic Theme Builder: チャートカスタマイズを簡単に Basic Theme Builder インジケーターで、MetaTrader 5 のチャート外観のカスタマイズをシンプルに変革しましょう。この直感的なインジケーターは、使いやすいパネルを提供し、さまざまなテーマやカラースキームを簡単に切り替えることができます。これにより、取引環境の視覚的な魅力と機能性が向上します。 Free MT4 version Basic Theme Builder インジケーターは、MetaTrader 5 のチャートを簡単にパーソナライズしたいトレーダーに最適なツールです。シンプルなパネルインターフェースとさまざまなテーマプリセットを使用して、取引スタイルや気分に合わせてチャートの外観をすぐに調整できます。クラシックなルックからモダンな美学まで、多彩なオプションを提供する Basic Theme Builder で、視覚体験を最適化しましょう。 主な機能: 簡単なテーマ管理: 便利なパネルインターフェースを使用して、ワンクリックでチャートのテーマを素早く変更できます。 定義済みのプ
FREE

Identification of support and resistance areas
A useful indicator for traders
completely free
Can be used in all symbols
Can be used in all time frames
It has three different trends: short term, medium term, long term
Settings:
Clr1,2: You can change the color of the lines
Type Trend: You can determine the trend
Message me for questions, criticism and suggestions
FREE

Ai Drawdown Protector は、ドローダウンを監視するための外国為替市場の最新技術です。プロップ会社や FX トレーダーがエクイティとバランスを追跡するためによく使用されます。一番良い点は、無料であることです。 期間限定オファー: AI Drawdown Protector は、期間限定で無料でご利用いただけます。 Ai Drawdown Protector には、1 秒あたり 10 回ドローダウンを計算するタイマー機能があります。ドローダウンが限度に達したことを検出すると、警告を生成し、その日のオープンおよび保留中のすべての取引を終了します。特に、エクイティに基づいてドローダウンを追跡するため、他の EA からの取引を決済できます。
機能:
作業用の美しいグラフィック パネル 無料 究極のドローダウン モニター システム すべてのペアのエクイティに基づいてロットを計算します。 24 時間 365 日稼働可能 簡単なセットアップ 固定ロットまたはリスク パーセントのいずれかでパネル上で売買 ビッド、アスク、スプレッド、マージン、フリー マージンなどの重要な情報
FREE

Market Cycle and Trading Sessions Indicator
Introducing our Market Cycle and Trading Sessions Indicator, a tool designed to provide you with a comprehensive view of the financial market like never before. Observe the market's pulse with our exclusive indicator. Gain a deep understanding of market phases, from accumulation to distribution, to make informed, strategic decisions with a high probability.
What makes our indicator?
1. Date Range for Calculations: Customize the start and end da
FREE

Features: fast opening / closing deals the number of deals and the total profit for the Symbol
Fast open deals: set the Lot volume set StopLoss / TakeProfit in points (if you set "0", then it is not used) set slippage set Magic (if necessary) set comment (if necessary)
Fast open features: fast open Buy fast open Sell fast close ALL open orders for the current Symbol
Attention: this utility works only on the current instrument this utility works on a VPS must enable Algo trading in the te
FREE

VR ティックは、 スキャルピングベースの戦略のための特別なインジケーターです。このインジケーターのおかげで、トレーダーは金融商品のメインチャート上でティックチャートを直接見ることができます。ティック チャートを使用すると、できるだけ正確に市場にポジションを入力したり、市場でポジションを決済したりできます。 VR Ticks は、方向に応じて色が変わる線の形で目盛りデータをプロットします。これにより、目盛りの状況を視覚的に理解し、評価することができます。ティック チャートの利点は、時間枠を考慮せず、価格の変化に基づいて構築されることです。 VR Ticks は可能な限り最小限のチャートを作成します。 設定、設定ファイル、デモ版、説明書、問題解決方法は [ブログ] でご覧いただけます
[リンク] でレビューを読んだり書いたりできます。
[MetaTrader 4] のバージョン ティックは 1 つの値動きです。 1 つの価格変動に対して、価格は 1 ポイントまたは数ポイント変化する可能性があります。 ティックは動きである ことを理解することが重要です。 このインジケーターには、右下に
FREE

The Expert Advisor for this Indicator can be found here: https://www.mql5.com/en/market/product/115567 The Contraction/Expansion Breakout Lines with Fair Value Gaps (FVGs) Indicator for MetaTrader 5 (MT5) is a powerful technical analysis tool designed to help traders identify and visualize breakouts at critical levels of contraction and expansion in financial markets. By incorporating Fair Value Gaps (FVGs), this indicator enhances traders' ability to gauge market sentiment and anticipate poten
FREE

マーチンゲール。 Parabolicumは複数通貨のエキスパートアドバイザーです。同時に10の通貨ペアをテストすることが可能です。 作業記号:EURUSD、GBPUSD、USDCAD、EURCAD、CADCHF、USDCHF、AUDCAD、AUDCHF、EURCHF、EURGBP 時間枠H1 最低保証金:$ 1000(最低ロット0.01) 最低推奨保証金:$ 10000 推奨ロットステップ0.01 ヘッジ口座の種類 テスト時に重要: 時間とリソースを節約するために、「1分OHLC」シミュレーションモードを選択することをお勧めします。 適切な設定オプションを選択した後、「すべてのティック」モードで結果を確認します。 入力オプションの1つ (ブローカー:「Roboforex」) - Parabolicum_Risk4.set エキスパート機能: 取引の場合、エキスパートアドバイザーは任意の時間枠の任意の1つのチャートにのみインストールされます。専門家は 入力パラメーターとH1時間枠で指定された通貨ペア。 重要:ブローカーがペアに別の名前を付けている場合(サフィックスまたはプレフィ
FREE

この指標は、YouTube チャンネル「The Secret Mindset」のビデオ「A Reliable Scalping Strategy I Discovered After 1 Month of Price Action Trading」で提案された戦略に基づいています。 信号をフィルタリングするための戦略と条件の完全かつ詳細な説明は、ビデオで公開されています。 * YouTube チャンネルの作成者はこのインジケーターの開発とは関係ありません シグナルは他のインジケーターと組み合わせて、各トレーダーの判断によってフィルタリングする必要があります
インジケーター
前のバーの高値/安値範囲内にあるバーは、インサイドバーと呼ばれます。 インジケーターはオプションでこれらのバーをペイントできます 2 つの連続するインサイドバーはチャネルを作成し、多くの場合サポートレベルまたはレジスタンスレベルとしても機能します
信号
インジケーターは、2 つの異なるモードで信号矢印を表示できます。 FAST: バーが閉じるまでシグナルが再描画されるため、トレーダーはシグナル バーがすで
FREE

White label available. contact us for more info. dushshantharajkumar@gmail.com TradeGuard by Chart Walker TradeGuard is a MT5 Expert Advisor (EA) designed to enhance your trading experience by automating key aspects of trade management. This EA excels in efficiently managing Take Profit (TP) and Stop Loss (SL) levels, offering a seamless and intelligent approach to trailing stops. One of TradeGuard's standout features is its Smart Trailing Stop, which dynamically adjusts the trailing distanc
FREE

The XR Gartley Pattern MT5 is an indicator which displays and alerts Gartley pattern detected on the candlestick chart. It also displays potential trade with calculated Take Profit and Stop Loss. After purchasing XR Gartley Pattern Indicator, you can immediately download this indicator from the MT4-MT5 Market and start using it because all features are set to default, is not necessary to change any parameter. In addition, we have created a private group for customers who have purchased one of
FREE

INTRODUCTION : The breakout strength meter is a trading tool that is used to identify which currencies are the strongest to breakout, and which currencies are the weakest to breakout. The settings for the indicator are easy, and if you cannot find the settings, please leave a comment The tools are completely free to use Please, if you like the indicator, please leave a comment and rate the indicator in order to develop it
FREE

NATS (Niguru Automatic Trailing Stop) will help you achieve more profits, by setting the trailing stop automatically. Pair this NATS application with EA, or can also be used as a complement to manual trading.
A trailing stop is a powerful tool in trading that combines risk management and profit optimization.
A trailing stop is a type of market order that sets a stop-loss at a percentage below the market price of an asset, rather than a fixed number. It dynamically adjusts as the asset’s pr
FREE

VWAP Fibo Bands RSJ is an indicator that traces the lines of the daily VWAP and from it creates bands using Fibonacci proportions. This spectacular indicator creates 10 band levels through the selected VWAP period using Fibonacci ratios.
It is fantastic how the prices respect each level of the bands, where it is possible to realize that almost every time the price closes above / below a level of the bands he will seek the next one. If close above will seek to reach the level above and if close
FREE

Draw and Sync Objects Multiple Charts 1. Draw objects by key press. ( You must: 1. Press Function key => 2. Click where you want to draw => 3. Draw it => 4. Press ESC to complete). (If you don't want to draw after pressing function key, you must press ESC to cancel). 2. Developing : Sync selected objects to multiple charts by button. 3. Developing: Hide objects that do not belong to the current symbol (Objects drawn with this indicator will belong to the symbol they are plotted on. When your c
FREE

KMeans Price Zones Detector を使ったトレーディングの未来へようこそ。これは、機械学習の力を利用して主要な価格ゾーンを特定する革新的なMetaTrader指標です。このツールは、価格データ内の重心を動的に検出するためにKMeansクラスタリングアルゴリズムを利用し、価格がサポート、レジスタンス、または統合に遭遇しやすいエリアを強調します。 革新的なKMeansアルゴリズム KMeans Price Zones Detectorは、パターン認識においてその効率と精度で知られる機械学習の基本であるKMeansクラスタリングアルゴリズムを高度に活用することで際立っています。過去の価格データを分析することで、この指標は重要な価格レベルを表すクラスタまたは重心を識別します。これらの重心を使用してサポートとレジスタンスゾーンを計算し、トレーダーに価格の反転、ブレイクアウト、および統合の可能性に関する重要な情報を提供します。 主な特徴 動的ゾーン検出: 指標は最新の市場データに基づいて価格ゾーンを継続的に更新し、トレーダーが常に最も関連性の高い情報を持つことを保証します。
FREE

This indicator calculates the volume profile and places labels that correspond to the VAH, VAL and POC levels, for each candle individually.
Indicator operation features The indicator works on the timeframes from M3 to MN, but it uses the history data of smaller periods: M1 - for periods from M3 to H1, M5 - for periods from H2 to H12, M30 - for the D1 period, H4 - for the W1 period, D1 - for the MN period. The color and location of the VAL, VAH and POC labels on the current candle are consider
FREE

Pivot Classic, Woodie, Camarilla, Fibonacci and Demark Floor/Classic Pivot points, or simply pivots, are useful for identifying potential support/resistance levels, trading ranges, trend reversals, and market sentiment by examining an asset's high, low, and closing values. The Floor/Classic Pivot Points can be calculated as follows. Pivot Point (P) = (High + Low + Close)/3 S1 = P * 2 - High S2 = P - (High - Low) S3 = Low – 2*(High - P) R1 = P * 2 - Low R2 = P + (High - Low) R3 = High + 2*(P - Lo
FREE
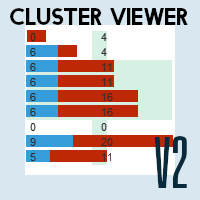
Dominate the Market with Accurate Insights: Meet Cluster Viewer V2 for Metatrader 5! Have you ever wondered how the most successful traders identify the best trading opportunities? With Cluster Viewer V2, you will have access to a comprehensive set of analytical tools designed to provide accurate and in-depth insights into financial markets. Developed for the Metatrader 5 platform, our EA takes your trading strategy to the next level. Features:
Purchase and Sale Volumes by Price Range: View
FREE

Certainly! Let me introduce you to a powerful tool for MetaTrader 5 (MT5) that can automatically identify and draw support and resistance (S&R) levels on your trading charts. This tool is called the “Support and Resistance Levels Guru” . Support Resistance Levels Guru The Support & Resistance Indicator automatically displays essential S&R levels on your chart. These levels are crucial for technical analysis and are used by many traders. Resistance levels (zones) are shown in R ed , while suppo
FREE
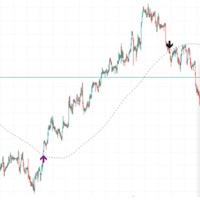
If the price is cutting above the slow length moving average, a breakout may occur. If the price is cutting below, a pullback may occur in the market. This was known for a long time, but there aren't many indicators which signal on the event. Candlestick pattern validation is also used in this indicator so that signals will not be drawn on doji candles or small "uncertainty" candles. The length of the moving average period can be defined by the user (default is 200). The number of price movement
FREE

Combination of Ichimoku and Super Trend indicators. 1. ARC (Average Range times Constant) The concept of ARC or Volatility System was introduced by Welles Wilder Jr. in his 1978 book, New Concepts in Technical Trading Systems . It has since been adapted and modified into the popular Super Trend indicator.
The fundamental idea behind ARC is simple: to identify support and resistance levels, you multiply a constant with the Average True Range (ATR) . Then, you either subtract or add the resultin
FREE
This simple range breakout trading strategy is a popular approach to profit from the movement of prices in financial markets. This strategy aims to identify a price range that a particular asset has been trading within and then wait for a breakout of that range to take place. The basic idea behind this strategy is that once the price of an asset breaks out of its established range, it is likely to continue in that direction, leading to a profitable trade. Once the range has been identified, we
FREE

This Mt5 Indicator Signals when there is two opposite direction bars engulfed by current bar. has a recent Exponential Moving Average Cross and past bar was oversold/bought Expert Advisor Available in Comments Free Version Here : https://www.mql5.com/en/market/product/110114?source=Site  ; Full Alerts for mt5 terminal , phone , email, print to file, print to journal Buy Signal ( blue line ) Past ema cross ( set at 30 bars back ) Past bar rsi is oversold ( level 40 ) Engulfing bar closes
FREE

Local_Timeは、チャート下部に指定の時差または、自動計算された時差でオリジナルの時間目盛りを追加します。
時間目盛りには、「DD.MM hh:mm」「DD MMM hh:mm」「MM-DD hh:mm」「MM/DD hh:mm」「DD hh:mm」「hh:mm」などなど対数のフォーマットに対応しています。
時差計算の必要性がない方でも、標準の時間目盛を消して、この時間目盛でサーバー時間の表示形式を変えるだけで、チャートの見やすさがアップするでしょう。
また、この日時バーよりも下にサブウインドウが作られてしまった場合は、赤いバーが表示されクリックすると最下部に移動する機能も付いています。
表示イメージは、スクリーンショットをご覧ください。
how to use
https://www.mql5.com/en/blogs/post/752455
FREE

Tabajara Rules for MT5 , baseado em Setup Tabajara do professor André Machado, indica a direção do mercado com base em médias móveis quando tem velas na mesma direção da média móvel.
O indicador contém a regra de coloração aplicada aos candles e a média móvel.
O indicador permite a alteração dos parâmetros: período e método de suavização da média móvel.
O indicador permite a alteração das cores dos candles ( contornos e preenchimento) e da média móvel.
O modelo do professor André Machado c
FREE

Time Range Separator is a useful tool to display a separator period on your platform.
You could go in the properties of the indicator, select the desired range and that's ALL. We believe it is a useful and necessary that we wish to share with you for free all our followers. Input Values: TimeFrame = Period Separator Separator_Color = Vertical Color Line Separator_Style = Vertical Color Style Separator_Width = Vertical Line Width Good trading to all and see you soon. Same indicator for MT4 her
FREE

MQL5ユーティリティボタンの紹介 - 楽な取引管理のための究極のソリューション!ワンクリックで、すべてのオープンポジションを即座に閉じることができ、取引体験をこれまで以上にスムーズかつ効率的にします。
この革新的なツールは、シンプルさを念頭に置いて設計されており、あらゆるレベルのトレーダーにとって使いやすいことを保証します。あなたがベテランの専門家であろうと初心者であろうと、MQL5ユーティリティボタンは比類のない容易さであなたの取引を管理するための手間のかからない方法を提供します。 このボタンは、すべてのオープンポジションを閉じるプロセスを簡素化するだけでなく、貴重な時間を節約します。各ポジションを1つずつ手動で閉じる必要はもうありません-MQL5ユーティリティボタンは、ほんの数秒ですべてを行います。 では、なぜ待つのですか?今すぐMQL5ユーティリティボタンをダウンロードして、取引を次のレベルに引き上げましょう。シンプルで効率的、そしてすぐに使用できる-貿易管理プロセスを合理化しようとしているトレーダーに最適なツールです。
FREE

Volatility Doctor Desert Eagleをご紹介します:爆発的なトレード成功のための究極のスキャルピングアルゴリズム!
あなたの取引ゲームを革命化する準備はできていますか?もうこれ以上探す必要はありません。Volatility Doctor Desert Eagleは、精度、コントロール、収益性を備えたトレーダーを力強く支えるために設計された究極のスキャルピングアルゴリズムです。以下は、Volatility Doctor Desert Eagleが他のどの製品よりも優れている理由です。
1) シンプルで直感的: 複雑な用語や急な学習カーブは不要です。当社のアルゴリズムはシンプルで理解しやすいパラメータを備えており、すべてのスキルレベルのトレーダーがそのパワーを活用できるようにしています。
2) データに基づく意思決定: 市場のボラティリティの強力な指標を活用して、トレードの意思決定に役立てます。推測に別れを告げ、データに基づいた戦略を歓迎しましょう。
3) 完全な制御: 各個別の設定に完全な制御権を持ちます。アルゴリズムをユニークなトレードスタイル
FREE

The strategy is based on the Alligator technical indicator, described by Bill Williams in "Trading Chaos".
The system is based on three moving averages (Lips, Teeth and Jaw lines), and oscillators, calculated using the difference between them. The trading signals are generated after crossover of the Alligator lines, depending on trend, determined by order of these lines. In the case of upward trend the Lips line (with minimal period) is the highest, the next is the Teeth line, and the lowest i
FREE

親愛なる友人、ご清聴ありがとうございました。 異なる通貨ペアの動きが相互に関連していることを観察したい場合は、インジケーター Visual Correlation に注目してください。 異なる通貨ペアの動きは相互に関連しています。 Visual Correlation インジケーターを使用すると、スケールを維持しながら 1 つのチャート上にさまざまな金融商品を表示できます。 正の相関、負の相関、または相関なしを定義できます。
親愛なる友人、あなたは、いくつかの楽器が他の楽器よりも先に動くことをご存知でしょう。 このような瞬間は、グラフを重ね合わせることで判断できます。
親愛なる友人へ、チャート上に商品を表示するには、Symbol フィールドに商品名を入力する必要があります。
Version for MT4 https://www.mql5.com/ja/market/product/33063
FREE

ボラティリティ・ドクター - 市場リズムをマスターするためのあなたの専門アドバイザー!
精密なトレードの力を解き放つ準備はできていますか?ボラティリティ・ドクターに会ってください。外国為替市場のダイナミックな世界で信頼できるパートナーです。このマルチ通貨の専門アドバイザーは単なる取引ツールではありません。それはシンフォニーの指揮者であり、非常に高い精度であなたの投資を導く存在です。
主な特徴を発見してください:
1. トレンドを追求する専門知識:ボラティリティ・ドクターは確かな手法を用いて堅牢な市場のトレンドを見つけ出します。推測を捨てて情報に基づいた意思決定に切り替えましょう。
2. 総合的なコントロール:組み込まれたマネーマネジメントツールでトレード戦略の主導権を握りましょう。いつでもいくつのポジションを開くか、トレードサイズをどれだけ拡大するかを決定します。それはあなたのプレイブック、あなたのやり方です。
3. ボラティリティのマエストロ:その名前が示すように、このEAは市場のボラティリティを測定し反映することに特化しています。水が容器の形に合わせて変化する
FREE
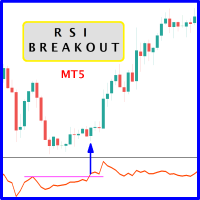
The likelihood of farther price movement increases when Relative Strength Index oscillator "RSI" breaks through its historical resistance levels in conjunction with prices breakout of resistance levels. It's strongly encouraged to confirm price breakout with oscillator breakout since they have comparable effects to price breaking support and resistance levels; similar perception is applied to short trades. Concept is based on find swing levels which based on number of bars by each side to confir
FREE
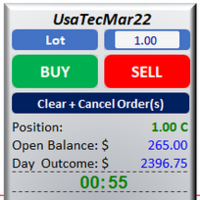
Boleta Trade Pad 0 This utility allows you to send orders quickly and easily using the shortcut keys SHIFT to buy and CTRL to sell. It is also possible to set Stop Loss and Take Profit, in price or points, directly on the TradeX. Use one of the four risk options (0,5%, 1,0%, 2,0% or 4,0%) to get the pending order volume according to the size of the last closed candlestick and the account balance. Once positioned, it offers Breakeven and Partial Exit options of 70%, 50% and 30% of the positioned
FREE

The Candle Countdown Timer for MetaTrader 4 (also available for MT5) is a vital indicator designed to help you manage your trading time effectively. It keeps you updated about market open and close times by displaying the remaining time before the current candle closes and a new one forms. This powerful tool enables you to make well-informed trading decisions. Key Features: Asia Range: Comes with an option to extend the range. Broker Time, New York, London Time: Displays the current broker time
FREE
Unlock the power of synchronized chart analysis with Chart Sync, your ultimate solution for harmonizing technical objects across multiple charts on the same trading symbol,
ChartsSync Pro MT5 is a groundbreaking MetaTrader 5 utility designed to streamline your trading workflow, enhance analysis precision, and amplify your trading decisions.
Features:
Effortless Object Synchronization.
Multi-Chart Harmony.
User-Friendly Interface.
Real-Time Updates.
Sync Objects Color,Width and Style.
FREE

Welcome to the presentation of the AI Channel indicator, a powerful tool that uses artificial intelligence for price channel analysis in the financial market. In this session, we will explore how this revolutionary indicator can assist investors and traders in making more informed and strategic decisions. Let's get started! I. What is the AI Channel indicator? AI Channel is an indicator developed based on advanced artificial intelligence algorithms. It utilizes historical price data of financial
FREE

We often need to know the sudden change in trend that happens on the graph and this can be confirmed through indicators.
This indicator shows the moments of trend reversal and how in which trend the price is shifting.
Custom background, no need to configure the colors in the chart, just drag the indicator!
Indication with arrows.
- Blue arrow: Upward trend.
- Pink Arrow: Downward Trend.
NOTE: Free indicator, support may take a while to respond.
FREE

Introduction To Time Box Indicator Time Box Indicator is a must have indicator for any trader. It will display daily, weekly and Monthly box according to your preferences. Yet, you can extend any important price levels in your chart automatically. You can use them as the significant support and resistance levels. It is very simple but effective tool for your trading.
Graphic Setting Use White Chart Line Style for Current Open price
Daily Setting Update Timeframe for daily box Number of days
FREE

Highly configurable Stochastic indicator.
Features: Highly customizable alert functions (at levels, crosses, direction changes via email, push, sound, popup) Multi timeframe ability Color customization (at levels, crosses, direction changes) Linear interpolation and histogram mode options Works on strategy tester in multi timeframe mode (at weekend without ticks also) Adjustable Levels Parameters:
Stochastic Timeframe: You can set the lower/higher timeframes for Stochastic. Stochastic Bar
FREE

ある MT5 または MT4 アカウントから別の MT5 アカウントに取引量をコピーするためのシンプルなユーティリティ。 ネッティング口座とヘッジ口座の間で任意の組み合わせでポジションをコピーできます。デフォルトでは、同じボリュームを持つすべての一致するシンボルによって開かれたポジションがコピーされます。シンボル名が異なる場合、またはコピーされたポジションのボリュームが異なる場合、またはすべてのポジションをコピーする必要がない場合は、この 投稿 で説明されている設定で目的の動作を指定できます。この製品は、将来のリリースで機能を拡張します。 バージョン 2.0 までは、この製品は無料です。 インストール順序:
送信者アカウントの端末で、Expert Advisor を送信者モードで起動します。 受信者アカウントのターミナルで、Expert Advisor を受信者モードで起動し 、以前に起動した送信者の 1 つを選択して、そこからポジション ボリュームをコピーします。
FREE
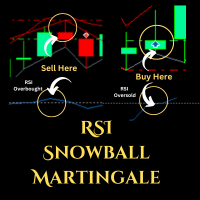
Expert Advisor (EA) that utilizes the basic Dow Theory strategy along with RSI for opening positions, and employs support and resistance levels from the Zigzag indicator as stop-loss and take-profit points, you can follow these guidelines: Dow Theory Strategy : This involves analyzing trends using the Dow Theory principles, mainly focusing on identifying primary trends (bullish or bearish) and secondary trends (corrections). You'll need to implement rules for identifying these trends based on pr
FREE

Trading Session Indicator The Trading Session Indicator visualizes the high and low points as well as the start and end times of the Asian, London, and New York trading sessions directly on your chart. Features: Visualization of major trading sessions Highlighting of high and low points Display of start and end times for each session Customizable session times User-friendly and efficient Customizability: Each trading session (Asian, London, New York) can be individually customized to match speci
FREE

The Heikin Ashi indicator is our version of the Heikin Ashi chart. Unlike competitor products, this indicator offers extensive options for calculating Heikin Ashi candles. In addition, it can be displayed as a classic or smoothed version.
The indicator can calculate Heikin Ashi with moving average by four methods: SMA - Simple Moving Average SMMA - Smoothed Moving Average EMA - Exponential Moving Average LWMA - Linear Weighted Moving Average
Main features The indicator shows Heikin
FREE

If you heard about The Wyckoff Method, Volume Spread Analysis, etc... You are probably searching for the candlestick indicator that shows you the Volume spread all over the current bar, signaling every types of market status... You can control the several Market Levels with custom colors...
It is up to you to decide how to use it. Our job is provide you with the indicator...
If you like this indicator, all I am asking is a little Review (not a Comment, but a REVIEW! )... This will mean A
FREE

RSIBand Pro EA is a hybrid strategy that has been tested and optimized using 100% History Quality from 2012 to 2023. Its main signal is based on Bollinger Bands, with RSI as a confirming signal to identify trends.
Supported currency pairs: AUDCAD Recommended timeframe: M15
MT4 Version: Click Here
Backtest Modelling quality: 100% History Quality Spread: Variable Time Period: 2012 – 2023.10 Symbol: AUDCAD Timeframe: M15 Dynamic lot: Dynamically sets the lot size based on the current b
FREE

Use this expert advisor whose strategy is essentially based on Bollinger bands as well as a personal touch.
Other free expert advisors are available in my personal space as well as signals, do not hesitate to visit and leave a comment, it will make me happy and will make me want to offer content. Expert advisors currently available: LVL Creator LVL Creator Pro LVL RSI mt5
If you want to get a configuration file to improve your experience, leave a comment on this robot, then contact me by di
FREE

Cybertrade ATR Trend Zone - MT5 The indicator shows, by calculating the ATR (Average True Range), the zone of probable price resistance. Indicated to be used as a probable exit point of an operation.
It works on periods longer than the period visible on the chart. All values are available in the form of buffers to simplify possible automations. This indicator is the same one we use in our EA. Also check out our other products.
FREE

All traders should know the trend before making their decision when placing the buy or sell orders. The first step always starts with supply and demand , rising and falling channels , trend lines, engulfing candles etc. All the above contribute to what is called “Price Action” and that is the best and most reliable way in trading and catching the trend and making profits, without stress. The Investment Castle Trend Line Indicator will automatically draw the trend lines on the MT5 for you.
FREE

Babel assistant 1
The MT5 netting “Babel_assistant_1” robot uses the ZigZag indicator to generate Fibonacci levels on M1, M5, M15, H1, H4, D1, W1 periods of the charts , calculates the strength of trends for buying and selling. It opens a position with "Lot for open a position" if the specified trend level 4.925 is exceeded. Then Babel places pending orders at the some Fibonacci levels and places specified Stop Loss , Take Profit. The screen displays current results of work on the positio
FREE

This indicator is designed to detect high probability reversal patterns: Double Tops/Bottoms with fake breakouts . This is the FREE version of the indicator: https://www.mql5.com/en/market/product/29957 The free version works only on EURUSD and GBPUSD! Double top and bottom patterns are chart patterns that occur when the trading instrument moves in a similar pattern to the letter "W" (double bottom) or "M" (double top). The patterns usually occur at the end of a trend and are used to signal tren
FREE

SETTINGS Make sure to select Chart shift option in the chart.
(Right click in the chart ---> Properties (dialog box) ----> Select Chart Shift)
Kindly rate and comment about the product for upgradation & Support
When using candlestick timers, keep in mind that the timing of candlestick patterns can play a crucial role in your trading strategy. For instance, different timeframes (such as 1-minute, 5-minute, hourly, ) can provide varying insights into price movements and trends. Make sure t
FREE

CustomRSI50 - レベル50を備えたカスタムRSIインジケーター 説明 CustomRSI50は、人気のある相対力指数(RSI)に基づいたカスタム技術指標です。このインジケーターは、特にレベル50に重点を置いたRSIの明確でカスタマイズ可能な視覚化を提供し、多くのトレーダーにとってモメンタム分析に不可欠です。 主な特徴 設定可能なRSI期間 強調表示された50レベルの参照 カスタマイズ可能な適用価格タイプ 別ウィンドウでの表示 解釈しやすい0から100までの固定スケール カスタマイズ可能なパラメーター RSI_Period: RSI計算の期間を設定可能(デフォルト:14) applied_price: 計算に使用する価格タイプを選択可能(デフォルト:終値) CustomRSI50の使用方法 MetaTrader 5の任意のチャートにインジケーターを適用 好みに応じてRSI期間と価格タイプをカスタマイズ 50レベルに関連するRSIの動きを観察: 50を上回る値は強気のモメンタムを示す 50を下回る値は弱気のモメンタムを示す 利点 市場のモメンタムの明確な視覚化 レベル50周辺
FREE

In this indicator you choice a data to be used from yesterday (high, low, open, close, etc) to automatically draw an line to be the zero. And, from that a percentage deviation ("Percentage to be used") is calculated and used to draw others line to both side until a limit be reached.
Both sides can have diferrent colours as show in screenshots. Also, more than one indicator can be used at same time.
FREE

Think of the Super Fractal Indicator as the Bill WIlliams Indicator on Steroids. Indicator Abilities: 1. Adjust Candle around Fractal High or Low. 2. Adjust Lookback period and only plot for a specific number of history candles avoiding cluttering your trading desk. 3. The Indicator uses buffers so you call and use it from any EA.
Note : The higher the candles around Fractal, the stronger the Turning point anfd viceversa is true.
FREE

The TTM Squeeze is a trading strategy developed by John Carter of Trade the Markets that uses the combination of Bollinger Bands and Keltner Channels to identify periods of low volatility, followed by periods of high volatility. The strategy is based on the principle that low volatility periods are typically followed by high volatility periods and is used to identify potential trading opportunities. When the Bollinger Bands move inside the Keltner Channels, it is referred to as a squeeze, and i
FREE

MomoPointsは、チャート上にロングとショートのエントリー/追加ポイントを表示するインジケーターです。
MomoPoints は、勢いとトレンドの強さに基づいて、リスク対報酬の比率が良好なエントリー/追加を表示します。
設定
----------------------------------
デザイン: 信号の色、サイズ、ウィングディング (グラフィック シンボル) を調整できます。
シグナル設定: 移動平均期間、トレンドの強さ、移動平均から価格までの距離、RSI期間を設定できます。
信号値をコメントとして表示して、資産に正しい値を設定できます。また、インジケーターはあらゆる取引ペアまたは資産に適合します。
適切なエントリを表示するには、すべてのアセットに独自の設定が必要です。特定のペアの設定が必要で、自分でそれを見つけることができない場合は、私がお手伝いします。
アラーム:プッシュ通知とサウンド音声アラートを有効にすることができます。
シグナルはリアルタイムで発生し、再描画は必要ありません
ご質問や追加情報や機能
FREE

For MT4 version please click here . Introduction Most traders use candle patterns as a confirmation tool before entering a trade. As you know there are lots of candle patterns out there. However I realized most of them can be generalized in simple rules. So I developed my own candle pattern(Although I cannot say for sure this is mine). pattern description The pattern consists of three consecutive candles. This is true for most of the patterns out there (considering there is a confirmation neces
FREE

One thousand Pip Set1:TP/SL 20kpip. Set2:TP/SL 10kpip. Set3: TP/SL 5k pip. Set3: TP/SL 2k pip. Set4: TP/SL 500 pip. Rate Prop FTMO Broker.
Only Pair DE40, US100, US30. Automatic added EU London Session. This Version works with fixed Lot and buy/sell. Robot Strategy: Trade open = First "Round Price-Number Entry". Write me a Message of Questions when undecided. I send ex4 Code by Request.
FREE

ボリンジャーバンドとストキャスティクスとの戦略取引
ボリンジャーバンドは主にトレンドを追うために使用されます。
オープン保留中の注文の購入または販売のための確率的メインラインおよびシグナルラインの使用
アドバイザAuto3MLiteMT4はVPSで動作できます。
Pro version MT4
Pro version MT5
特徴
マーチンゲールなし ハードストップロスと各ポジションの利益を取る トレーリングストップ 保留中の注文をインターバル時間で自動的に削除 保留中の注文には買いストップと売りストップ機能を使用します 取引戦略
AUTO3M Lite MT4は9通貨ペアEURUSD、GBPUSD、AUDUSD、NZDUSD、USDCHF、USDCAD、USDJPY、EURJPY、GBPJPYで取引されています
保留中の注文の購入停止または販売停止のみを使用します。
ストキャスティクスは、相場分析と新しいバーでの分析にのみ使用されます。
確率的メインラインが90を超え、ビッドが90未満の場合、アッパーバンドは注文待ちの売りストップを準
FREE

Description:
Heikin-Ashi-like swing oscillator candles. It can be used in the same way as RSI or Stochastic.
For example: Zero crossing. Above the zero line is bullish, below the zero line is bearish.
Overbought or oversold. 100 line is the extreme bought level, -100 line is the extreme sold level.
Divergences.
Time frame: Any time frame.
Instrument: Any instrument.
FREE

This Advanced Pivots Point is a MT5 Indicator and the essence of this technical indicator is to transform the accumulated history data. Pivot Point Indicator provides for an opportunity to detect various peculiarities and patterns in price dynamics which are invisible to the naked eye. Pivot Points Fibonacci retracements Previous day’s open, high, low, and close.
FREE

これはMetaTrader 5のためのあなたの取引口座の分析を提供する統計パネルです。 分析結果はリアルタイムでチャートに表示されます。 多通貨取引は非常に人気があります。 MT4のバージョン
完全な説明 購入する方法
インストールする方法
ログファイルの取得方法 テストと最適化の方法 Expforex のすべての製品 しかし、取引量が多ければ多いほど、それぞれの取引の収益性を分析するのは難しくなる。 月ごとに取引を分析し、各取引ごとに統計を計算することは、さらに困難な作業です。 取引システムのパフォーマンスを包括的に理解したい場合、この目標を達成するのに役立つツールが複数あります。 これらのツールには、レポート、統計、myfxbook、取引ジャーナル、口座分析、パフォーマンス統計、分析、革新的なダッシュボードなどがあります。 これらのツールを活用することで、取引システムのパフォーマンスを詳細に分析し、得意分野や潜在的な弱点に関する貴重な洞察を得ることができます。 パフォーマンス向上を目指す新規トレーダーであれ、取引戦略の最適化を目指す経験豊富なト
FREE
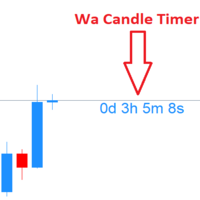
Wa Candle Timer MT5 is an indicator which shows the user how much time is remaining until the next candle will form. When it remains less than 5% before the current candle will be closed, the color of the time changed. These are the settings: 1- Color of Candle Timer when it remains MORE than 5% percentage of current bar to be closed. 2- Color of Candle Timer when it remains LESS than 5% percentage of current bar to be closed. 3- Candle Timer Font Size. 4- Candle Timer font (e.g.: "Arial").
FREE

For those who like trend the Force will be a very useful indicator. This is because it is based on the famouse ADX, which measure the strenght of a trend, but without its 3 confusing lines. Force has its very simple interpretation: if the histogram is above zero level the trend is up, otherwise it is down. You can use it to find divergences too, which is very profitable. Thanks to Andre Sens for the version 1.1 idea. If you have any doubt or suggestion, please, contact me. Enjoy!
This is a fre
FREE

The fact that round number levels have a significant influence on the market cannot be denied and should not be overlooked. These psychological levels are used by both retail Forex traders and major banks that deal in Forex. Very simple and effective indicator and most importantly free. ////////////////////////////////////////////////////////////////////////////////////////////////////////////////////////////////////////////////////////////// The program does not work in the strategy tester.
FREE

Mouse You can draw fibonaccis moving the mouse over the zigzag indicator Pin them You can click on fibonacci with this option and it will no longer be deleted unless you click on it again :) Precision The tuned fibonacci gets the precise point in lower timeframes Enjoy it You can ask me for add more features, so please comment and leave your ranting for me to be happy, thank you :)
FREE

This indicator created based on original John Carter's TTM_Squeeze indicator and represents "squeeze" of the market which can be followed (or maybe not) by significant moves. Original indicator prints black dots when Bollinger Bands are inside Kelthner Channels and exactly this implemented in this custom version. Instead of original implementation as momentum indicator MACD indicator with standard settings 12-26-9 is being used. Mainly, the indicator is useful for understanding when it's better
FREE

Highly configurable Macd indicator.
Features: Highly customizable alert functions (at levels, crosses, direction changes via email, push, sound, popup) Multi timeframe ability Color customization (at levels, crosses, direction changes) Linear interpolation and histogram mode options Works on strategy tester in multi timeframe mode (at weekend without ticks also) Adjustable Levels Parameters:
Stochastic RSI Timeframe: You can set the lower/higher timeframes for Stochastic RSI. Stochastic RSI
FREE
MetaTraderマーケットが取引戦略とテクニカル指標を販売するための最適な場所である理由をご存じですか?宣伝もソフトウェア保護も必要なく、支払いのトラブルもないことです。これらはすべて、MetaTraderマーケットで提供されます。
取引の機会を逃しています。
- 無料取引アプリ
- 8千を超えるシグナルをコピー
- 金融ニュースで金融マーケットを探索
新規登録
ログイン