 MetaTrader 5
 エキスパート
 インディケータ
 ライブラリ
ライブラリ
 ユーティリティ
 ウィジェット
 ルール
ルール
YouTubeにあるマーケットチュートリアルビデオをご覧ください
ロボットや指標を購入する
仮想ホスティングで
EAを実行
EAを実行
ロボットや指標を購入前にテストする
マーケットで収入を得る
販売のためにプロダクトをプレゼンテーションする方法
MetaTrader 5のための無料のエキスパートアドバイザーとインディケータ - 20
 自動売買ロボットとインジケータを使用して、外国為替取引の収益性を高めます。 自動売買ロボットを使用すると、取引の開始と終了を自動化でき、インジケータは市場の行動をより正確に予測するのに役立ちます。
このページには、MetaTrader5アプリケーションのカタログが掲載されています。
自動売買ロボットとインジケータを使用して、外国為替取引の収益性を高めます。 自動売買ロボットを使用すると、取引の開始と終了を自動化でき、インジケータは市場の行動をより正確に予測するのに役立ちます。
このページには、MetaTrader5アプリケーションのカタログが掲載されています。 
AI London Open Gold Trader — Automated XAUUSD London Session Breakout EA AI London Open Gold Trader is an Expert Advisor built specifically for XAUUSD (Gold), designed to trade the volatility that appears right after the London trading session opens. The EA watches the first M15 candle after the configured London open time and looks for a genuine breakout move, with a built-in fallback rule so the strategy does not sit idle if the opening range does not qualify. The system is built with strict,
FREE

Artemis RSI は、相場に合わせて自動調整される MetaTrader 5 用の無料 RSI インジケーターです。
通常の RSI は常に同じ期間と同じレベルを使いますが、相場は常に変化しています。Artemis は 60 通りの RSI 設定を同時にテストし、今の相場に最も合ったものを表示します。
主な機能: - 現在の相場に最も合った RSI ライン - 相場に合わせて動く買われすぎ・売られすぎレベル - 相場の状態(レンジ、トレンド、静か、ノイズが多い)を示す小さなパネル - 自動で描画される通常ダイバージェンスと隠れダイバージェンス - 転換点に表示される買い・売りの矢印
すべての銘柄・すべての時間足で動作します:FX、ゴールド、株価指数、暗号資産。
Artemis RSI はチャートを読むためのツールです。自動売買は行いません。
無料、MetaTrader 5 用、TradeToolsOfficial 提供。
FREE

The Wolf Expert - MetaTrader 5用マルチストラテジー・トレンドハンター
The Wolf Expertは、規律あるトレンドフォローロジックと賢いリスク管理を組み合わせたいトレーダーのために構築された、プロフェッショナルな完全自動売買システムです。ADXトレンド強度フィルターで確認された三重移動平均線構造を使用して確率の高いトレンドの動きを狙い、その後、機関投資家スタイルの決済ロジックで各取引を管理します。
主な特徴:
三重移動平均線トレンドエンジン - 独立して設定可能な3つのMAブロック(期間、方法、適用価格、シフト)により、任意のシンボルや時間枠に対してトレンド確認を細かく調整できます。
ADXトレンドフィルター - 任意のADX強度フィルターにより、EAは荒れた低モメンタム市場を避け、本物のトレンド状態に取引を集中させます。
3段階テイクプロフィットシステム - 3つの独立したテイクプロフィットレベルと設定可能な比率(TP、TP2、TP3)で段階的に利益を確保し、勝ちトレードを伸ばしながら早期に部分利益を確保します。
自動ブレイクイーブンと
FREE
Simple Strategy Grid Pro is a trading advisor combining four indicators (RSI, Stochastic, MACD, ADX) into a grid-based strategy. Suitable for both novice and experienced traders due to its flexible settings and automation. Strategy The advisor enters trades on signal changes from FALSE to TRUE, using RSI > 50, Stochastic > 50, MACD above signal line, and ADX > 25 for long positions (opposite for shorts). Take Profit is calculated from VWAP, with grid steps adjusted via ATR. Key Features Combin
FREE

MT5用NAS100 Auto SL and TP Makerをご紹介します:
MetaTrader5でナスダック100市場をナビゲートするトレーダーにとって不可欠なアシスタントであるNAS100オートSLおよびTPメーカーで、ストップロスおよびテイクプロフィットの設定をもう見逃すことはありません。このツールは、ストップロスとテイクプロフィットのレベル管理を自動化するシームレスなソリューションを求める方々のために設計されています。
主な特徴
簡単な自動化:
ストップロスやテイクプロフィットのないナスダック100取引を自動的に監視します。
ユーザーが構成した設定に基づいてレベルを動的に調整します。
注文タイプの多様性:
Nasdaq100の成行注文と未決済注文の両方に対応。
MetaTrader 5で利用可能なさまざまな注文タイプをサポートします。
カスタマイズされた設定:
ユーザーフレンドリーなパラメータ設定により、トラッキング設定とストップロス/テイクプロフィットレベルのカスタマイズが可能です。
柔軟な範囲:
実行する特定のNAS100商品または取引されるすべての商品に対してスト
FREE

Squeeze Breakout Trader - ボラティリティスクイーズ + ブレイクアウトEA Squeeze Breakout Traderは、古典的な「ボラティリティスクイーズ」パターンを取引する完全自動売買のエキスパートアドバイザーです。市場が低ボラティリティのレンジに収縮するのを待ち、価格がボラティリティの拡大とともにブレイクアウトした時点で即座にエントリーします。スクイーズはボリンジャーバンドとケルトナーチャネルを比較することで検出されます。ボリンジャーバンドが収縮して(より広い)ケルトナーチャネルの内側に完全に収まると、ボラティリティが異常に低くなり、その後強い方向性のある動きが続くことがよくあります。 取引の仕組み 新しいバーごとにボリンジャーバンド(価格ボラティリティバンド)とケルトナーチャネル(EMA中央線 +/- ATRベースのエンベロープ)を計算します。 「スクイーズ」を確認します:直前の確定バーでボリンジャーバンドがケルトナーチャネル内に完全に収まっていたこと。 スクイーズ直後に価格がケルトナーチャネルの上限バンドを上抜けて引けた場合に買いを、スクイーズ後
FREE

El indicador utiliza múltiples marcos de tiempo para analizar las mejores entradas de compra en el auge 1000. Está diseñado para ayudar a operar únicamente en picos de auge. el indicador tiene dos flechas; los rojos y azules. la formación de la flecha roja indica que debe estar preparado para una flecha azul que es una señal de entrada de compra. el indicador no ofrece puntos de salida. siempre recopile 3 pips, es decir, si ingresó a una operación a 10230,200, puede salir a 10260,200 con SL a 1
FREE

Headline/Title: Donchian Turtle Breakout Pro (100% FREE) [Introduction] Experience the legendary Turtle Trading strategy, modernized for today's dynamic markets. Donchian Turtle Breakout Pro is a complete, institutional-grade trend-following Expert Advisor based on Donchian Channels and ATR volatility. Originally developed for private prop-trading, we are releasing this highly advanced trading engine completely FREE for the MT5 community. It is designed to catch massive market trends while stric
FREE

HMA Color – Master Smoothed Overview HMA Color – Master Smoothed is a MetaTrader 5 indicator based on a Hull Moving Average calculation with an additional smoothing layer. The indicator displays market direction using a color-changing HMA line and optional visual candle representation. The objective is to provide a simplified visual view of trend direction while reducing short-term fluctuations in the displayed curve. Features • Hull Moving Average calculation • Additional smoothing layer • Aut
FREE
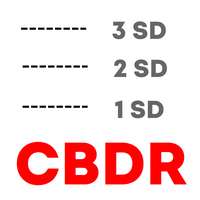
Haven CBDR は、ICTの「Central Bank Dealers Range(CBDR)」をチャート上に表示する、使いやすいインジケーターです。このプログラムは、CBDRの価格レンジを示す長方形を描画し、さらに標準偏差ラインを追加表示して、サポートとレジスタンスの可能性のある水準を確認できます。CBDRの時間帯、表示するカレンダー日数、色、グラフィック要素のスタイルなどを自由に設定でき、チャートのテーマに合わせて配色も自動調整されます。また、日足ローソクの始値を示す垂直線も描画し、市場の動きを把握しやすくします。 その他の製品 -> こちら トレーダーの使い方: パラメータ設定:
必要に応じて、セッションの開始・終了時間を調整し、表示設定(色、長方形の枠線スタイル、標準偏差ライン、マーカーなど)をカスタマイズします。 レンジ分析:
表示された長方形を活用して、選択した期間内のCBDR価格帯を素早く視覚的に確認できます。標準偏差ラインによって、反転やトレンド継続の可能性のあるレベルを特定できます。 トレードシグナルの探索:
日足ローソクの始値を示す垂直線と、セッション
FREE

Trading Session Indicator The Trading Session Indicator visualizes the high and low points as well as the start and end times of the Asian, London, and New York trading sessions directly on your chart. Features: Visualization of major trading sessions Highlighting of high and low points Display of start and end times for each session Customizable session times User-friendly and efficient Customizability: Each trading session (Asian, London, New York) can be individually customized to match speci
FREE

MarketTime - プロフェッショナル・マルチタイムゾーンクロック&セッションインジケーター 取引セッションを二度と逃さない - グローバル市場時間をリアルタイムでモニター MarketTimeは、MetaTrader 5チャート上に複数のタイムゾーン、ライブセッションカウントダウン、ビジュアル取引セッションゾーンを直接表示するプロフェッショナルグレードのインジケーターです。FX取引において、タイミングがすべてです - 主要金融センターがいつアクティブか、セッションがいつ重複するかを知ることは、取引の成功に大きく影響します。 この包括的なツールは、複数のブラウザタブや外部アプリケーションの必要性を排除します。グローバル市場時間をモニターするために必要なすべてがチャート上にあり、リアルタイムで更新され、作業スペースを乱雑にしないクリーンでカスタマイズ可能なインターフェースを備えています。 詳細はこちら: 完全なドキュメントと設定ガイド (English) 期間限定オファー: 最初の50ダウンロードは無料です!その後、この製品は有料になります。今すぐダウンロードして無料コピーを確保し
FREE

Tabajara Rules for MT5 , based on Professor André Machado’s Tabajara Setup, indicates the market direction using moving averages when there are candles aligned with the direction of the moving average.
The indicator contains the color rule applied to the candles and the moving average.
It allows changing the parameters: period and smoothing method of the moving average.
It also allows changing the colors of the candles (borders and filling) and of the moving average.
Professor André Machado’s
FREE

効率的な手動取引のためのカスタムトレードパネル
このトレードパネルは、MT5での手動取引をサポートするツールを提供し、取引管理に役立つ機能を備えています。パネルは、注文の実行、注文管理、ポジションの監視機能をコンパクトなインターフェースで提供します。 なぜこのトレードパネルを選ぶのか? 複数の取引を管理したい場合でも、取引プロセスを効率化したい場合でも、このカスタムトレードパネルは、ポジションを効率的に管理するためのすべての機能を提供します。リスクをコントロールし、取引パフォーマンスを簡単にモニターできます。
主な機能 パネルには、以下の市場注文管理ツールが含まれています: あらかじめ設定したストップロスとテイクプロフィットを使って市場注文を実行 指定した価格ポイントに指値・逆指値注文を配置 ひとつのインターフェースから複数の注文タイプを管理 現在のポジションや保留中の注文をモニター 注文管理機能 ユーザーは、以下の主要な取引管理機能にアクセスできます: 注文ごとにストップロスとテイクプロフィットレベルを設定 アクティブなポジションにブレークイーブン設定を適用 特定の注文タイプ(買
FREE

概要 RiskPilotは、MetaTrader 5向けのビジュアルなリスク/リワード実行パネルです。チャート上でカラーラインとゾーンをドラッグするだけでエントリー、ストップロス、テイクプロフィットを直接設定でき、ポジションサイズ、ドル建てのリスクとリワードをリアルタイムで確認しながら、ワンクリックで発注できます。ロット計算やオーダーウィンドウの操作は不要です。 同じチャート上で複数の独立したリスク/リワード設定を同時に管理でき、それぞれが独自のエントリー/SL/TP、方向(買いまたは売り)、そして削除・反転・ロック用のチャート上コントロールを持ちます。 重要 — これは自動売買戦略ではなく、手動トレードツールです。 RiskPilotが自動でポジションを開閉することは一切ありません。すべての取引はBUYまたはSELLボタンを押したときのみ送信されます。MetaTrader 5では、このようなシンプルなビジュアルツールを含め、この種のプログラムはすべてナビゲーターの「エキスパートアドバイザー」セクションから実行されるため、RiskPilotはEAフォルダに表示されます。これはプラットフ
FREE

Master Market Trends with the Hilo Flow Indicator Stop trying to predict the market and let the colors guide your decisions. Hilo Flow is the visual evolution of the classic HiLo Activator. Designed for traders who seek extreme clarity , it eliminates chart clutter and translates market flow strength directly into candle colors. Forget confusing lines and hesitation when aking decisions. With Hilo Flow, you can clearly identify potential moments to enter, hold a position, or exit a trade. Ho
FREE
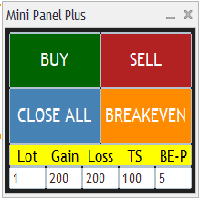
Remodeling the BoletaMiniPanel, the Mini Panel Plus has the same functionalities, but is now in the form of a box that allows it to be minimized and placed anywhere on the chart. Simple Panel with Stop loss (Loss), Stop gain (Gain), Trailing stop (TS) and Breakeven (BE-P). The Lot is the number of contracts to be traded. Gain is the number, in points, at which the stop gain will be positioned. If you don't want to place a stop gain, just put 0 (zero) in its place and when you open the order it w
FREE

TM Price Stretch Map は、ローソク足の終値がバンドの外に出た後、次の確定足がバンド内に戻ったかどうかをチャート上に表示します。 実線のバンドは、その時点までに利用可能な価格だけを使う因果的なガウスカーネル計算に基づきます。上側バンドを超えて確定した足には赤い点、下側バンドを下回って確定した足には青緑の点を表示します。その次の確定足が両バンドの内側に戻ると、上側からの戻りには下向き矢印、下側からの戻りには上向き矢印を表示します。点と矢印は実線バンドだけで判定します。 任意の破線バンドは過去をさかのぼって平滑化するため、新しい足によって過去の線がリペイントされることがあります。破線は表示専用で、点や矢印の判定には使用しません。帯域幅、バンド幅、価格ソース、表示履歴、色、中心線、マーカーを設定できます。自動売買は行わず、反転を保証するものでもありません。
FREE

手動 トレード・ リプレイツール 手動 トレード・ リプレイツール は、 MT5 Strategy Tester の ビジュアル モード で 手動 バック テスト を 行う ため に 設計 さ れ た トレード 支援 ツール です。 この ツール は 自動 売買 シグナル を 生成 する もの では ありま せん。 過去 の 相場 を 再生 し ながら、 実際 の 取引 と 同じ よう に 自分 で 相場 を 判断 し、 手動 で エントリー、 Stop Loss、 Take Profit の 設定、 ポジション 管理 を 行う こと が でき ます。 リプレイ 終了 後 は、 MT5 Strategy Tester の 公式 統計 レポート を 利用 し て、 自分 の トレード 戦略 が 長期 的 に プラス の 期待 値 を 持 って いるか を 確認 でき ます。 Price Action、 サポート/ レジスタンス、 チャート パターン、 トレンド フォロー、 スイング トレード、 ICT/ SMC、 移動 平均 線 戦略 など、 裁量 判断 が 必要 な さまざま な トレ
FREE
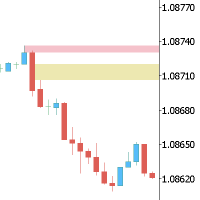
This Expert is the perfect companion for SMC/ICT users.
It allow to draw easily the Supply , Demand , Imbalance(fvg) zones as well set up MetaTrader alerts if price touchs the zone. Imbalance (fair value gap) have options to be displayed in full or based on the filling to the follwing candle, so you will never miss one.
You can also zoom on a clande with a specific period. Very usefull when you look at an 1h candle in the past and you want to see the details in M5.
How does it work ? Simply s
FREE

AI Divergence Scanner Multi Symbol continuously scans an entire watchlist of symbols for RSI divergence at the same time, so you never have to manually flip through charts looking for a setup - the scanner brings the divergences to you on a single panel. KEY FEATURES
- Monitors a fully customizable list of symbols simultaneously (default: EURUSD, GBPUSD, USDJPY, XAUUSD, AUDUSD) - add or remove any symbols your broker offers.
- Detects both bullish divergence (price makes a lower low while RSI ma
FREE

The Breakout Finder (BF) is a technical analysis indicator designed for MetaTrader 5 (MT5) platforms. It identifies potential breakout and breakdown patterns in price action by analyzing pivot highs and lows over a specified period. The indicator detects "cup" formations—clusters of pivot points within a narrow price channel—indicating areas of consolidation that may lead to strong directional moves when broken. EA: BlackHole Breakout EA https://www.mql5.com/en/market/product/149206
Key Featur
FREE

RSI Adaptive T3 Short description RSI Adaptive T3 is a trend and momentum indicator for MetaTrader 5. It is drawn directly on the price chart and combines two elements: a T3 moving average whose smoothing length changes automatically with the value of the RSI, and a second copy of the same line delayed by two bars. The gap and the crossing between these two lines show the current direction and short-term changes in momentum. Optional volatility bands and crossover markers complete the picture. W
FREE
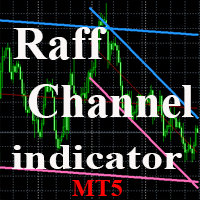
The indicator plots a trend channel using the technique by Gilbert Raff. The channel axis is a first-order regression. The upper and lower lines show the maximum distance the Close line had moved away from the axis line. Therefore, the upper and lower lines can be considered as resistance and support lines, respectively. A similar version of the indicator for the MT4 terminal
As a rule, most movements of the price occur within a channel, going beyond the support or resistance line only for a sh
FREE
すべての無料商品を見るにはここをクリック
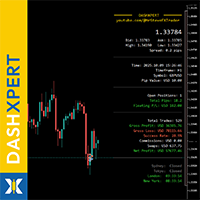
DashXpert は MetaTrader 5 のための完全無料で強力なダッシュボードで、すべての重要な 市場データ、アカウント情報、パフォーマンス統計 を直接チャート上に表示します。 ウィンドウやタブを切り替える代わりに、 DashXpert は 集中型でインテリジェントな概要 を提供します - 最大限の視認性、最小限の視覚的ノイズ、そしてプロフェッショナルな外観のために最適化されています。 これにより、 保有中のポジション、損益、勝率、口座残高 をリアルタイムで明確に把握できます。 これによって DashXpert は、日常的に便利なツールであるだけでなく、 完全なパフォーマンスモニター として、あなたのトレードを理解し、改善し、透明性のある可視化を可能にします。 さらに、このダッシュボードは最も重要な トレーディングセッション(Sydney、Tokyo、London、New York) を自動的に表示し、そのステータスも示します - つまり、 市場がいつどこで動いているか を瞬時に確認できます。 その モダンでミニマルなデザイン 、
FREE

Backed by volume , this is a professional-grade VWAP tool anchored to swing points rather than time sessions. Provides directional bias through cyan/magenta color-coding and standard deviation bands for high-probability entries. How It Works Bullish : Close above Depth period high → VWAP anchors to swing low, color = Cyan Bearish : Close below Depth period low → VWAP anchors to swing high, color = Magenta On structure break, VWAP re-anchors to previous swing extreme automatically Key Features N
FREE

### Indicator Description: Gradient Heiken Ashi with Momentum Coloring
This indicator is a technical analysis tool designed to overlay on the main chart, helping traders easily identify price trends and momentum through modified Heiken Ashi candles. It combines smoothed candle value calculations based on moving averages with a gradient color system to represent the strength of bullish or bearish trends.
#### 1. Key Features
- Display of Modified Heiken Ashi Candles:
- The indicator draws opt
FREE
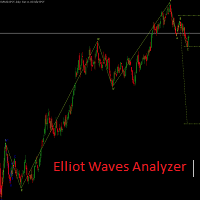
Elliot Waves Analyzer calculates Elliot Waves to Help Identify Trend direction and Entry Levels. Mainly for Swing Trading Strategies. Usually one would open a Position in trend direction for Wave 3 or a Correction for Wave C . This Indicator draws Target Levels for the current and next wave. Most important Rules for Elliot Wave Analysis are verified by the Indicator. This free version is limited for Analyzing one Timperiod Waves. Waves are Shown only in PERIOD_H4 and above. Not Useful for Intr
FREE

This indicator plots the volume profile by Price on the chart
There are 5 ways to view it:
By Total Volume Traded (Premium Version); Volume Ticks(Forex) Separated by Buyers and Sellers (Premium Version); Buyers Only (Premium Version); Sellers Only (Premium Version); Business balance (Buyers - Sellers) (Premium Version); .
It is possible to select how many days the profiles will be calculated.( Premium Version)
On the current day it recalculates the histogram data for each new candlestick.
FREE

This indicator is based on the logic of accumulation, manipulation, and liquidity in the European and US markets. It monitors the first hour of trading and displays an entry zone—specifically the high, the low, and the 50% mark of the candle body. The zone and line are removed after two touches, as they are no longer valid. It helps me determine the technical trend direction and potential reversals. I use it in combination with my other indicator and a supply and demand level indicator.
FREE

Volume Histogram with MA is a customizable volume indicator for MetaTrader 5 that displays market activity as a color-coded histogram, with an optional moving average for comparing current volume with its recent average. The indicator runs in a separate window below the price chart and supports tick volume, real volume, and automatic volume source selection. It is designed to provide a simple way to observe changes in trading activity, identify unusual volume increases, and compare volume behavi
FREE

Session High Low draws the Asian, London and New York sessions on your chart as colored boxes, with the high and low of each session. Optional extension lines continue the session high and low after the session ends, which is useful for breakout and retest trading. Features Asian, London and New York boxes, each can be turned on or off Session high and low prices shown as labels Extension lines after the session end (hours adjustable, 0 = off) Ranges are built from M5 data, so the boxes are the
FREE

QCL Dynamic RSI Zones — MetaTrader 5 QCL Dynamic RSI Zones combines a smoothed RSI signal with adaptive boundaries to help you assess momentum in the context of recent market conditions. Instead of relying on fixed overbought and oversold levels, the indicator adjusts its zones using recent RSI behavior. A dynamic balance line, a color-changing signal, and excursion columns provide a clear view of momentum shifts in a separate chart window. Key Features Adaptive zones: Upper and lower boundaries
FREE

FLF PRO – Smart Dual Basket Grid EA FLF PRO is a professional Expert Advisor developed exclusively for MetaTrader 5 . It combines advanced grid logic with intelligent dual basket management to provide flexible position handling, adaptive trade management, and efficient basket control across different market conditions. Main Features Smart Dual Basket Grid System Intelligent Grid Management Adaptive Lot Progression Automatic Lot Balance Attack Dynamic Lot Compensation Independent Buy and Sell Ba
FREE

無料 — サポート/レジスタンスを自動描画: 前日高値/安値、前週高値/安値、キリ番(ラウンドナンバー)を自動で引き、常に最新に保ちます。
100%無料、制限は一切ありません。もしこのツールがあなたのチャートに定着したなら、短いレビューを頂けることが私たちにとって何よりの助けになります — 30秒で書けて、他のトレーダーがこのツールを見つけるきっかけになります。
対応プラットフォーム: MetaTrader 5 のみ(MetaTrader 4 版はありません)。
多くのデイトレーダーが毎朝手作業で引いているラインを、このインジケーターは自動で描画し、古くなることがありません。
=== 描画内容 ===
- 前日高値/安値 — 実線(既定は青)。
- 前週高値/安値 — 破線(既定は紫)。
- キリ番レベル — 点線(既定はグレー)。現在価格の上下に設定した本数を描画。
- 各ラインにはツールチップで名称と正確な価格が表示されます。
=== リペイントなし ===
日足・週足レベルは確定済みのD1/W1バーから取得するため、一度描かれたらその日・その週の間は動きません。再計算は
FREE

VWAP Volume Profile Pro プロフェッショナルなマーケット構造分析 VWAP Volume Profile Pro は、 VWAP(出来高加重平均価格) 、 Volume Profile(出来高プロファイル) 、 Point of Control(POC) 、 Value Area High(VAH) 、 Value Area Low(VAL) を1つのインジケーターに統合したプロフェッショナル向け分析ツールです。 出来高分布とフェアバリュー(Fair Value)に基づいて市場構造を客観的に分析し、重要なサポート・レジスタンス、機関投資家の出来高集中ゾーン、買い手と売り手のバランス、そして高確率のトレード機会を特定することができます。 対応市場: Forex(外国為替) CFD 株式 株価指数 先物 貴金属 原油 暗号資産(仮想通貨) VWAP Volume Profile Pro を選ぶ理由 多くのトレーダーは、VWAP と Volume Profile を別々のツールで分析しています。 VWAP Volume Profile Pro は、それらを1つのインジケ
FREE

======================================================== OFX CVD — MQL5 MARKET PRODUCT DESCRIPTION (formatting notes: **bold** = editor Bold button; lines starting with "•" = bullet-list button; UPPERCASE lines = section headings) ========================================================
SHORT TITLE (product name field): OFX CVD — Cumulative Volume Delta + Divergence for XAUUSD (Gold)
------------------------------------------------------- OVERVIEW ------------------------------------------
FREE

AI Multi Symbol Momentum Trader – Momentum EA for Any Symbol AI Multi Symbol Momentum Trader is a MetaTrader 5 Expert Advisor built to trade momentum shifts on any symbol you attach it to – Forex pairs, Gold, indices, or crypto CFDs. Instead of hard-coding a single instrument, the EA reads the chart's own symbol at runtime, so one license can be used across your entire watchlist. The strategy combines a trend filter (EMA) with a momentum trigger (RSI crossing a buy or sell threshold) to look for
FREE

オドメーター トレード前に、残りの道のりを把握しましょう。
どの市場も、1日あたり一定の距離を移動します。日によって多少の差はありますが、ほとんどの場合、通常のレンジに近いところで取引を終えます。そのため、エントリーする前に、次のシンプルな質問を自問自答することが重要です。「今日の道のりのうち、どれだけが既に過ぎ去ったのか?」
市場が通常の1日の移動距離を既に超えてしまった後にブレイクアウトを狙うのは、異常な日を狙っているようなものです。道のりの大部分がまだ残っているうちにエントリーすることで、トレードに余裕を持たせることができます。
オドメーターは、この疑問に一目で答えてくれます。市場の1日あたりの平均移動距離を測定し、価格が今日どれだけ移動したかを追跡し、チャート上に各方向への残りの距離をリアルタイムで表示します。トレードシグナルは提供しません。既存の戦略やインジケーターと併用できる、意思決定支援ツールです。
機能 チャート上
道の終点:2本の光る線が、今日の平均移動距離の上限と下限を示します。これらの線は、日々の推移に合わせてリアルタイムで動きます。
残り距離:各道
FREE

BollingerBandsEA is an Expert Advisor designed to combine technical analysis with automated execution, utilizing the renowned Bollinger Bands strategy. Developed for traders of all experience levels, it offers a practical approach to streamline your trading activities in the financial market. Why Choose BollingerBandsEA? Strategy-Based Approach: Built on Bollinger Bands logic, the EA identifies trading opportunities using solid technical criteria. Smart Automation: Enables automated buy and sel
FREE

AI Multi-Factor Confluence Trader AI Multi-Factor Confluence Trader only enters the market when three independent factors agree: trend direction, momentum, and short-term price action. This confluence approach is designed to filter out low-quality, conflicting signals and only trade when the market shows a consistent, agreed-upon direction across multiple angles of analysis. How it works On every new bar, the EA scores the market on three factors: Trend – Fast EMA vs Slow EMA relationship (defau
FREE

Gold doesn’t forgive a bad entry. It sweeps stops, tricks anyone reading the candle at face value, and reverses right when everyone’s convinced the trend is set. RBM Gold Liquidity Hunter shows you exactly where those traps happen, before you walk into one.
The indicator maps yesterday’s high and low automatically and draws the Asian session range live on your chart, that window that usually decides where the day is headed once London and New York show up. When price breaks one of those levels
FREE

前バージョンのインジケーターの発展 ZigZag WaveSize MT4 ZigZag WaveSize - ポイント、レベル、および異なるアラートロジックに関する情報が追加された改良版標準ZigZagインジケーター
一般的な改善点: MetaTrader 5用のコード適応 グラフィックオブジェクトでの作業の最適化 新機能: 極値における水平レベル レベルタイプの選択:水平/光線/セグメント 流動性レベルフィルター(価格によるブレイクなし) ブレイク用バッファ:偽ブレイクに対する感度設定 ラベル設定と機能:数量、外観、古いラベルの削除 構造ブレイクアラート(BoS) 動きの性質変更アラート(ChoCH) 最適化: 極値更新ロジックの修正 新しいオブジェクトの動的更新 バー出現時の負荷低減 ラベルの中央管理システム 修正点: 配列の境界超えの修正 ラベルの正しい配置 重複するパラメーターの削除
ZigZag WaveSizeインジケーターをトレーディングシステムの補助として使用してください マーケットで私の他の製品もお試しください https://www.mql5.com/
FREE

NAD RSI Cross NAD RSI Cross is a simple RSI-based signal indicator that provides clear BUY and SELL signals directly on the chart. How It Works BUY — RSI 14 crosses above 30 after the candle closes. SELL — RSI 14 crosses below 70 after the candle closes. Features RSI 14 BUY level: 30 SELL level: 70 Closed-candle confirmation Clean chart with simple arrows No RSI panel Suitable for XAUUSD M1 Can also be used on other instruments and timeframes SL & TP Set your own SL and TP according to you
FREE
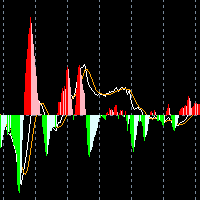
MACDは類似性と差異の移動平均と呼ばれ、二重指数移動平均から作成されます。高速指数移動平均(EMA12)を低速指数移動平均(EMA26)から差し引いて、高速DIFを取得し、次に2× (Express DIF-DIFの9日間の加重移動平均DEA)MACDバーを取得します。 MACDの意味は、基本的に二重移動平均と同じです。つまり、高速移動平均と低速移動平均の分散と集約は、現在のロングショートステータスと株価の開発傾向の可能性を特徴づけますが、読む方が便利です。 MACDの変化は市場動向の変化を表し、さまざまなKラインレベルのMACDは、現在のレベルサイクルにおける売買傾向を表します。
1.このインジケーターは、MACDの2行表示を追加します。 2.そしてエネルギーカラムに4つの異なる勾配を適用します! トレンドインジケーター、 波動標準の自動計算 、 MT5バージョンの波動標準の自動計算を強くお勧めします
Necessary for traders: tools and indicators Waves automatically calculate indicators,
FREE

======================================================== OFX orderflow — MQL5 MARKET PRODUCT DESCRIPTION (formatting notes: **bold** = editor Bold button; lines starting with "•" = bullet-list button; UPPERCASE lines = section headings) ========================================================
SHORT TITLE (product name field): OFX orderFlow — CMF + MFI Money-Flow & Divergence for XAUUSD (Gold)
------------------------------------------------------- OVERVIEW ---------------------------------
FREE

================================================================================ SESSION BREAKOUT PROBABILITY PRO - MQL5 MARKET PRODUCT DESCRIPTION ================================================================================
TITLE: Session Breakout Probability Pro - Quantitative Intraday Session Analyzer
TAGLINE: Stop trading blind breakouts. Get real-time statistical probabilities, dynamic targets, and algorithmic validation for London and Asia session setups.
-------------------------
FREE

AI Multi Timeframe Trend Dashboard shows the trend direction of six timeframes at once - M15, M30, H1, H4, D1 and W1 - in a single, always-on-chart panel, so you never have to flip through charts to check higher-timeframe alignment before entering a trade. The indicator compares a fast and slow EMA on each of the six timeframes independently and displays a clear UP, DOWN or FLAT reading for every one of them, color-coded for instant recognition. Trading with the trend across multiple timeframes
FREE

MetaTrader 5用 KS Pattern Indicator
このインジケーターは、あらゆるチャートおよび時間足において、ローソク足パターンとプライスアクション・パターンを自動的に識別します。
検出されるローソク足パターン(ShowCandlestick = true で有効化):
Doji(十字線) – 市場の迷いを示す中立的なパターン(表示名:"Doji")
Bullish Engulfing(強気の包み足) – 強気への反転シグナル(表示名:"Bullish Engulfing")
Bearish Engulfing(弱気の包み足) – 弱気への反転シグナル(表示名:"Bearish Engulfing")
Hammer(ハンマー) – 強気への反転シグナル。潜在的な底値圏で出現しやすい(表示名:"Hammer")
Shooting Star(流れ星/上ヒゲ大陽線) – 弱気への反転シグナル。潜在的な天井圏で出現しやすい(表示名:"Shooting Star")
Morning Star(明けの明星) – 強力な強気反転パターン(表示名:"Morning Star")
E
FREE

Profitable Scalper EA - Rôla Scalper! Tested on EURUSDm Symbol on Micro Account created in XM Broker, but you can try it in any market or broker, any way I recommend that you use it on markets with volatility similar to EURUSD.
This EA can open a lot of positions, so I recommend that you use a broker that don't have comission fee and provide low spread.
You can use settings on 5 minutes timeframe, since I started to use it, and in tests, the maximum drawdown with this settings and M5 timefram
FREE

Aurex Resistance & Support Dynamic PRO An adaptive support/resistance zone indicator built on swing-pivot detection, ATR-scaled zone sizing, volume validation, and an automated mitigation protocol that removes zones once they've been invalidated. Zone detection Zones are anchored to confirmed swing highs and swing lows (symmetric pivot window, default length 10). Each zone's thickness is derived from a 50-period ATR rather than a fixed pip/point value, so zone width automatically adapts to the c
FREE

OneClick Trading Assistant lets you trade straight from the chart. Set your lot, stop loss and take profit once, then click BUY or SELL. Your stops are attached for you. It is a manual tool. You choose when to enter. It manages your stops after that.
Supported for all brokers, instruments, timeframes and currencies.
WHAT IT DOES: BUY and SELL with one click, stop loss and take profit included. CLOSE ALL, Close Buys, Close Sells. All trades are closed at the same time, not one by one. Trailing
FREE
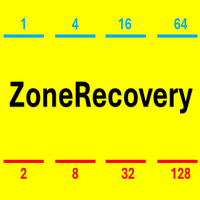
This is a high-risk strategy; it is recommended to set appropriate parameters.
1. Pending Opposite Stop Order – Used for breakout trading.
2. Multiplier – Determines the lot size of the opposite order.
3. Recovery Point – the distances of Pending Opposite Stop Order. For example, setting 200 for EUR/USD is reasonable.
4. Built-in Strategies – AutoSpike or AutoVolatility or Manually click-to-trade with your own strategy.
5. SL USD and TP USD – Money-based stop-loss or take-profit to close all
FREE

### Donchian Channels Trend v1.0 過去の高値と安値に基づく動的なエンベロープ内に価格アクションをカプセル化する、ブレイクアウトベースのトレンドフォローインジケーターです。元々はTradingView用に概念化されたこのツールは、状態メモリを使用して方向性のバイアスを明確に視覚化します。
**仕組み** アルゴリズムは、指定されたルックバック期間における絶対的な最大値と最小値を計算します。構造的な価格のブレイクに基づいて現在のトレンド方向を維持するために、有限状態機械(FSM)を利用します。 * **強気状態** : 現在の価格の高値が、前の期間のアッパーバンドを上抜けたときにアクティブになります。 * **弱気状態** : 現在の価格の安値が、前の期間のロワーバンドを下抜けたときにアクティブになります。
**視覚的機能** * 動的なアッパーバンドとロワーバンド。 * 中間点を表す中央のベースライン。 * アクティブなトレンド状態に基づいてチャネル全体の色を変更する動的なカラーリング。 * トレンド転換時のシグナル生成。
**パラメーター**
FREE

MSRLab Yen Long EA MSRLab Yen Long EA is a buy-only London-range breakout EA for selected JPY currency pairs. It monitors the configured pairs for a fresh bullish close above the London-session high. When a valid breakout appears, the EA calculates the stop from the London range and places a buy trade with a pair-specific reward/risk target. The EA does not use: Short trades OCO orders Martingale Grid recovery Loss doubling Manual trade intervention Default symbols The default portfolio contain
FREE
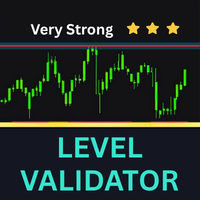
Level Validator - タッチ回数で検証するサポート&レジスタンス
そのレベルが本当に重要かどうかを推測するのはもう終わりです。水平線を1本引くだけで、Level Validator が自動的に価格ゾーンで囲み、そのレベルにタッチした各ローソク足をカウントし、強度を評価します。チャート上の適当な線ではなく、実際に機能が証明されたレベルをトレードできます。
機能
- 各ラインの自動ゾーン:ゾーンの半幅をポイントで設定すると、指標が一目で読める明確で設定可能なゾーンを描画します。
- タッチカウントと強度評価:各レベルが実際のタッチ回数を星評価(弱・中・強・非常に強い)とともに表示します。強いレベルは色と星で際立ちます。
- マルチチャート同期:1つのチャートにレベルを引くと、同じ銘柄のすべてのチャートに自動的に表示されます。すべての時間足で1組のレベルを管理できます。
- 調整可能なカウント期間:ドラッグできる垂直の開始ラインでタッチのカウントを開始する位置を指定し、古く無関係な履歴が数値を水増ししないようにします。
- 任意のローソク足マーカー:レベルにタッチした
FREE
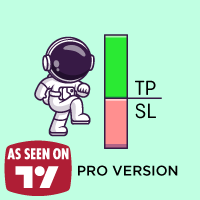
Are you tired of those old, boring TP and SL lines cluttering your charts? Free now, celebrating release of Live Chart Viewer utility https://www.mql5.com/en/market/product/158488
Struggling to showcase your trades in a way that actually grabs attention ?
Worry no more! Introducing the ultimate solution you’ve been waiting for... The TPSL Bounding Box PRO Indicator! PRO Version (With Risk to Rewards Ratio and more Modern Look Stats)
With just a simple setup, you can transform you
FREE

Structure-Anchored VWAP [WAT] Structure-Anchored VWAP [WAT] は、MetaTrader 5向けのマーケットストラクチャー対応VWAPインジケーターです。固定されたセッションリセットだけに依存せず、意味のあるスイングポイントやストラクチャーポイントにVWAPをアンカーします。 マーケットストラクチャー + Anchored VWAP + 偏差バンド + リテストシグナル + ATRベースのトレード管理 を、ひとつのビジュアルフレームワークに統合しています。 主な機能 3つのアンカーモード — Swing、Structure、Fast
ストラクチャー検出 — HH、HL、LH、LL、EQH、EQL
Anchored VWAP — 意味のあるストラクチャーの動きにVWAPが追従
偏差バンド — オプションで0.5σおよび2σを表示
Premium / Fair Value / Discount ゾーン
設定可能な変位後の VWAPリテストシグナル
ストラクチャーに基づく VWAPの強気/弱気カラーリング
FREE

LT HiLo Activator は、著名なトレーダー Robert Krausz 氏によって考案された定評あるトレンド追跡手法を、あなたのチャート上に表示します。大きな値動きを捉え、市場トレンドに逆らった取引を避けるための重要なテクニカルツールです。 実用的で客観的、そして直感的に読み取れる HiLo は、方向性を持つサポート/レジスタンスの「階段」のように機能し、エントリー、エグジット、資金保護のポイントをより簡単に判断できるようにします。
実践での活用方法 上昇トレンド(動的サポート): インジケーターのラインはローソク足の下に描画され、買いポジションの Stop Loss を配置・トレーリングするための優れたテクニカルゾーンとして機能します。 下降トレンド(動的レジスタンス): インジケーターは価格の上に描画され、相場の弱さを示し、売りポジションの保護に役立ちます。 サイクル反転: 価格が HiLo ラインを超えて終値を付けると、インジケーターは反対側へ「反転」し、新たなトレンドが始まる可能性を示します。
インジケーターの主な機能 明確でシンプルな
FREE

The trade strategy is based on the RSI oscillator.This bot only works with the 1minute timeframe on your preffered currency pair.A buy will happen when the RSI is below or equal to 30,A sell will happen when the RSI is above or equal to 70.It is a very simple and straightforward strategy.i will be making updates and adjustments to this bot based on your feedback.
FREE
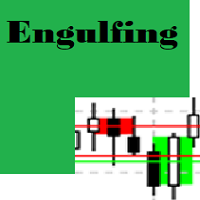
Engulfing Candle Detector
Detectable pattern Double Candlestick Patterns Bullish Engulfing
The first candle is black candle. The second candle opens with a gap below the real body of the black candle but rallies upwards to close above the real body of the black candle. In other words, the second candle's real body completely engulfs the first candle's real body Bearish Engulfing
The first candle is white candle. The second candle opens with a gap above the real body of the white candle but dec
FREE
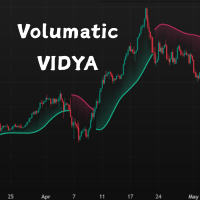
This is a custom VIDYA-based trend-following indicator for MetaTrader 5 (MT5), enhanced with ATR-band logic to adapt to market volatility. It provides dynamic trend zones and intelligent direction switching to support better trading decisions.
Unlike traditional moving averages, this indicator uses a momentum-adjusted VIDYA (Variable Index Dynamic Average) and combines it with ATR-based bands to detect trend shifts with greater precision. Features
Volatility-Adaptive Trend Logic – Uses ATR ban
FREE
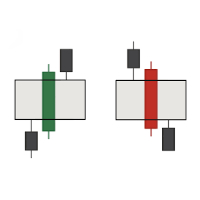
A simple indicator that automatically highlights all FVGs (Fair Value Gaps) formed on the chart, as well as FVGs on history. It is possible to select colors for FVGs of different directions (long or short), select the time interval, select the color of middle point and you can also choose whether to delete filled FVGs or leave them on the chart (the option is beneficial for backtesting). The indicator can be very useful for those, who trade according to the concept of smart money, ICT, or simply
FREE

Synthetic indeces are one of a kind of forex markets. Specially, on boom and crash indices on M1 timeframe is really interesting. I always thought that it was impossible to catch spikes safely until today. Everything has it's limits. This EA is based on martingale strategy with low drawdown. Max grid level is 3. When each trades goes on drawdown, the next trade will be multiplied by 2. The EA does not use take-profit or stoploss . So the backtesting will show the same results as real-time tradi
FREE
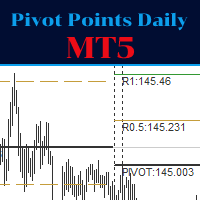
The Indicator show Daily Pivot Points. It is possible to specify the number of days to display. For forex it doesn't consider the sunday session data. It is possibile to modify the color, style and width for every level. It is better to use this indicator with timeframe not higher than Н1. 4 Levels of support and resistance with also Intermediate Levels that is possible to hide.
FREE

Volume Footprint Pro 2.0 — Complete Institutional Order Flow Suite Launch Special — $49 ( Price increases $5 after every 5 copies sold. )
Stop trading blind. Start seeing where smart money actually moves. Footprint Pro reveals the full order flow story inside every candle — who's buying, who's selling, where institutions are absorbing, and where momentum is dying. Bid×Ask — Classic footprint with volume at every price level POC & Value Area — Know where 70% of volume traded Imbalance &
FREE

FX RSI Scanner – Multi-Currency, Multi-Timeframe RSI Dashboard FX – Fee eXcluded · A free tool series by Marcus Glink FX RSI Scanner shows the RSI of all your pairs on every timeframe from M1 to MN in one clean dashboard, together with a live currency strength ranking. You see in seconds where the market is stretched, which currencies are leading and where the timeframes agree. This is the Fee eXcluded Community Version: completely free, and it will stay free. What the dashboard shows RSI matrix
FREE

Indicator "ATR Grail Control zones" user's guide
Purpose of the indicator
The indicator calculates **the average price movement** (High − Low) for a given number of periods (months, weeks, days) and builds two zones ** from the current extremes of the period ** — upper and lower. Calculation logic: from **Low** of the current candle, the average move is postponed up; from **High** of the current candle, the same average move is postponed down. Each zone has a width of **+10%** of the average
FREE

みなさん、こんにちは。
1つの指標と3つの異なる指標画面で、複数のデータポイントを同時に表示できる「オールインワンスクリーン」機能を無料で利用する方法についてご説明します。
まず、この指標は何に使用されるのでしょうか? フィボナッチレベル FVGおよびOrderBlockレベル 一目均衡表 エンベロープ、ボリンジャーバンド ドンチャンチャネル 再テストゾーン サポートおよびレジスタンスゾーン ストキャスティクス、そして最後にATR指標です。
1. コントロールパネル画面には何が表示されるのか?
フィボナッチ値、HH値、LL値を取得するための、過去100本のローソク足から取得したリアルタイムの価格データ。
過去100本のローソク足を分析して得られたフィボナッチレベル。
OrderBlock および FVG 値(ユーザーにはグラフ上で横長の長方形として表示されます)。
2. コントロールパネル画面には何が表示されますか?
ATR 指標データ。 ストキャスティクス指標データ。 一目均衡表指標データ。 ドンチェーン指標データ。 ボリンジ
FREE

VR ドンチャン インジケーターは、ドンチャン チャネルの改良版です。改善はチャネルのほぼすべての機能に影響を与えましたが、主要な動作アルゴリズムとチャネル構造は維持されました。現在のトレンドに応じてレベルの色の変化がボールインジケーターに追加されました。これは、トレーダーにトレンドまたはフラットの変化を明確に示します。スマートフォン、電子メール、または MetaTrader ターミナル自体で 2 つのチャネル レベルのうちの 1 つのブレイクアウトについてトレーダーに通知する機能が追加されました。値札が追加されており、これを利用してトレーダーはチャート上の価格レベルを確認できます。古典的なドンチャン指標の操作アルゴリズムは、トレーダーが指標が計算する期間を自分で設定できるという事実により、最適化され高速化されています。古典的な Donchian インジケーターは、MetaTrader ターミナルで利用可能な履歴全体を計算します。これにより、MetaTrader ターミナルに数学的計算の負荷が大きくかかります。 VR Donchian インジケーターは、トレーダーが設定で設定した金額の
FREE
MetaTraderマーケットは、開発者がトレーディングアプリを販売するシンプルで便利なサイトです。
プロダクトを投稿するのをお手伝いし、マーケットのためにプロダクト記載を準備する方法を説明します。マーケットのすべてのアプリは暗号化によって守られ、購入者のコンピュータでしか動作しません。違法なコピーは不可能です。

取引の機会を逃しています。
- 無料取引アプリ
- 8千を超えるシグナルをコピー
- 金融ニュースで金融マーケットを探索