YouTubeにあるマーケットチュートリアルビデオをご覧ください
ロボットや指標を購入する
仮想ホスティングで
EAを実行
EAを実行
ロボットや指標を購入前にテストする
マーケットで収入を得る
販売のためにプロダクトをプレゼンテーションする方法
MetaTrader 5のための無料のエキスパートアドバイザーとインディケータ - 27

MACD indicators https://mql5.com This MACD indicator looks slightly different from the MACD indicator found in many other charting software. When the value of the signal line parameter is greater than the value of the MACD parameter, the indicator will give a buy prompt, and when the signal line parameter is less than the value of the MACD parameter, the indicator will give a sell prompt.
FREE

Tired of adjusting the indicator settings losing precious time? Tired of the uncertainty regarding their efficiency? Afraid of the uncertainty in their profitability? Then the indicator ACI (automatically calibrateable indicator) is designed exactly for you. Launching it, you can easily solve these three issues just performing the simplest action: clicking a single Calibrate button. To achieve the highest efficiency, you should perform another additional action: move the power slider to the maxi
FREE
* This product was converted using "BRiCK Convert4To5 MT4 " based on the MQL4 source file of "BRiCK Convert4To5 MT4 Free" . "Convert4To5" is a Script that converts MQL4 source files into MQL5 source files.
Experts, Indicators, Scripts, and Libraries with extension ".mq4" will be available for MT5.
Parameter
None.
Procedure
1. Open the following folder.
terminal_data_folder\MQL4\Files\ (in the terminal menu select to view "File" - "Open the data directory") 2. Confirm that the BRiC
FREE

This script exports the economic calendar from MT5 as a .csv-file into the common directory of the terminal (...\Terminal\Common\Files). The generated file news.csv is necessary for using the news filter in back testing the Range Breakout Day Trader EA.
Input parameters: Country 1: First country from which the news will be exported Country 2: Second country from which the news will be exported
Date from: Start date from which the calendar data will be exported Date to: End date to which the
FREE

Donchian通道(唐奇安通道指标)是用于交易突破的最古老、最简单的技术指标之一。 一般来说,唐奇安通道的宽度越宽,市场波动就越大,而唐奇安通道越窄,市场波动性也就越小 。此外,价格走势可以穿过布林带,但你看不到唐奇安通道的这种特征,因为其波段正在测量特定时期的最高价和最低价。 交易实用必备工具指标 波浪自动计算指标,通道趋势交易 完美的趋势-波浪自动计算通道计算 , MT4版本 完美的趋势-波浪自动计算通道计算 , MT5版本 本地跟单复制交易 Easy And Fast Copy , MT4版本 Easy And Fast Copy , MT5版本 本地跟单复制交易 模拟试用 Easy And Fast Copy , MT4 模拟账号运行 Easy And Fast Copy , MT5 模拟账号运行 唐奇安通道指标计算: 唐奇安上阻力线 - 由过去N天的当日最高价的最大值形成。 唐奇安下支撑线 - 由过去N天的当日最低价的最小值形成。 中心线 - (上线 + 下线)/ 2 唐奇安通道信号 唐奇安通道常用作突破指标。它提供了两种主要类型的突破信号,一个是上阻力线或下支
FREE

This indicator draws a price area in which the volume percentage was traded the day before. The chart shows the days with vertical lines and two horizontal lines to indicate the upper price and the lower price of the percentage of volume was traded the day before. The upper/lower lines start and end with the day calculated. But they are referred with the values of the day before. NOT the day in which are. With this indicator you can see where the volume moved in the day before. It uses percenti
FREE

Necessary for traders: tools and indicators Waves automatically calculate indicators, channel trend trading Perfect trend-wave automatic calculation channel calculation , MT4 Perfect trend-wave automatic calculation channel calculation , MT5 Local Trading copying Easy And Fast Copy , MT4 Easy And Fast Copy , MT5 Local Trading copying For DEMO Easy And Fast Copy , MT4 DEMO Easy And Fast Copy , MT5 DEMO
Strongly recommend trend indicators, automatic calculation of wave standard and MT5 ve
FREE

This indicator is designed according to the combination of WPR and Stoch indicators, when WPR goes up and Stoc goes up quickly too, the price may meet strong resistance, many times short order will take profit, but if the price break through it, Long positions are more likely to be profitable, and the reverse held true as well. You can adjust the parameters of WPR and Stoc to Adapt the symbol you operate. Click here to look the advanced edition: https://www.mql5.com/en/market/pro
FREE

This indicator shows the value of returns in the selected time frame
They are calculated as logarithm of returns , rather than price or raw returns. For small returns, arithmetic and logarithmic returns will be similar. The benefit of using returns, versus prices, is normalization. It is possible measures all variables in a comparable metric despite originating from price series of unequal values
Inputs You can display data both as a Histogram or a Line It's also possible to display the
FREE

The Moving Averages On-Off let you control the indicator using the keyboard or a button . You can choose if you want the indicator always shown or always hided while switching among different time frames or financial instruments . ---> This indicator is part of Combo Indicator OnOff
It's possible to setup three Moving Averages : Short , Medium , Long
Input You can customize the price type used for calculation : close, open, high, low, median price, typical price, weighted It
FREE

Exaado Capital care If you've been searching for ways to manage Drawdown control, Drawdown Control, Balance protection, or Daily Drawdown Limit related to trading with Prop Firms, FTMO, My Forex Fund, or Funded accounts, then you've come to the right place. Additionally, if you're looking to safeguard your trading account, we can help. Do you struggle with managing your drawdown while trading funded accounts? Our EA is designed specifically for those in your position. Many prop firms have a "Tra
FREE

Switch Tray is a shortcut tray tool for commonly used trading pairs provided to traders. It can be placed at the bottom of the chart, and commonly used trading pairs can be set by themselves. 1. You can set the shortcut switch button for your commonly used trading pairs. The default is [EURUSD/GBPUSD/XAUUSD/USDJPY/USDCHF/USDCNH]. / slash is the separator. 2. The button of each trading pair is also equipped with the number of open positions of a certain trading pair. 3. Multi-cycle quick switchi
FREE
This EA has no stop loss. All risks are at your discretion.
This is Free EA, It can make you profitable if you use it carefully. Please don't ask for the MQ5 file, I'm using it to develop other robots.
Gegenpressing MT5 EA is a fully automatic Expert Advisor for Scalping Trading on XAUUSD timeframe M1 but also in others. The basic strategy starts with Market order in Trend Following, so this EA Follow the Trend . M1 Trend…. very very fast.
If you like this EA and want to hel
FREE

The indicator ColorCandlesDaily draw candles with different colors depending on the day of the week.
FREE

This indicator displays MTF (Multi-Time Frame) Candles on your Chart. It helps to see the overall Trend of Market.. It also help to MTF Analysis in fast way because you dont need look in many Time-Frames.. You get 4TF Bars/Candles on your current chart.. It can help you to identify trend or Reversal early as you get overall picture at one place...
Customizable Settings are : 1. Where to place MTF Candles.. 2. Show or Hide for each Candle 2. Time-Frame for each Candle
FREE
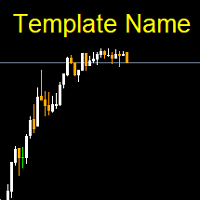
Template name allows you to write custom text that will show up on your charts. It allows you to position the text anywhere including selecting any color that you prefer. You can position the text at any of the 4 corners of your chart screen. This custom text can aid as a watermark for your screen shots. This text can act as a unique and true signature for your charts.
FREE

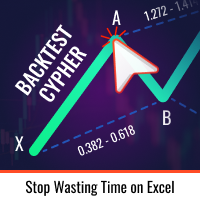
トレードアイディアをテストし、市場での持ちこたえを確認することがこれほど簡単になったことはありません。過去のチャートで4回のクリックで任意のサイファーパターンを選択し、バックテストリストに追加するだけで完了です。それだけで、各シンボルと時間枠に対する完全なデータ分析が得られます。
サイファー戦略チュートリアル
ロボットはストラテジーテスターで動作しないことに注意してください 4回のクリックでサイファーを選択 SLおよびTPレベルの自動調整 複数のマネーマネジメント戦略:取引ごとのパーセンテージリスク、固定金額取引、固定ロット数取引 無効なパターンを回避するためのサイファー戦略の検証 過去のサイファーを選択し、シンボルと時間枠に対するデータ分析を簡単にバックテスト 分析には取引回数、勝率、利益、ターゲット達成回数、リスクリワード比の平均などが含まれます スローパソコンまたはVPS向けの特別モード 最大ドローダウンや分析オプションなど、戦略最適化とより多くの統計情報を含む将来のアップデートも予定されています
FREE
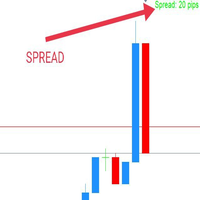
WaSpread MT5 Indicator shows the current spread in pips with color.
* Set the Spread Threshold and the color to identify when the current spread is below or above the Spread Threshold.
* Set X axis and Y axis and chose the Corner and the Anchor to position the Spread Label on the chart.
* Write the font and the font size for more confort.
* Activate alert if the current spread is above the spread threshold.
* For more precision, the user can choose to show the decimal numbers.
* The
FREE

Property of Vertical Capital Edition: Gugol_Quants About USA INDEXES QUANT_INDICATOR: This is a indicator created by math modulation to be used as a trading tool, which was developed in MQL. (MT5) This indicator is for use only with US500(S&P500), NAS100(Nasdaq Composite) and US30(Dow Jones). Signals are activated on "Open" Candle. It’s based on Intraday/Swing Trades whose main timeframe is H1, H2, H3 and H4. However you can use it with other assets by testing with the appropriate settings. *
FREE

Overview: The trading robot is an software designed to operate on the EUR/USD currency pair. It is optimized for an H1 (one-hour) trading timeframe, suitable for traders looking for a balance between short-term and medium-term trading strategies. Technical Indicators Used: Relative Strength Index (RSI): The robot incorporates the RSI to measure the velocity and magnitude of directional price movements. It helps identify overbought or oversold conditions in the trading of an asset. Bollinger Band
FREE

Simple indicator used in technical strategies to analyze tops, bottoms and reversal or continuation points. Developer information:
Line values and colors:
Buffer 0 : ZigZag line value;
Buffer 1 : ZigZag color value;
Buffer 2 : Median line value;
Buffer 3 : Median color value; Buffer to get the values of each top and bottom. Buffer 4 : Top value;
Buffer 5 : Bottoms value;
Buffer that returns the type of the last direction.
Buffer 9: 0 = Not updated, 1 = High, -1 = Low;
FREE

This EA uses two moving averages one slow and one fast, when ever they cross it checks if the RSI value is greater or lesser than 50 depending on the signal given by the Moving averages. After that it checks if the Stochastics lines are going up or down and not in the Over Bought or Over sold zone. so in total it uses an RSI, 2 Moving Averages ,Stochastics and an ATR to try to evade stop hunting.Also has a trailing function to hold the profits if price moves X pips tested on a 5 min time frame
FREE

This indicator emulates volume delta (buy trades vs sell trades) based on per candle volume and candle shape (direction, size of body and wicks). Artificially separated buy and sell volumes then accumulated for specified number of bars. The indicator shows a histogram of volume delta per bar, as well as a sum of the delta for the given period. What is more important, the indicator allows you to combine current symbol quotes/volumes with quotes/volumes of other related symbols (futures, indices,
FREE

FREE

The ShowSessions indicator for MT5 shows up to two, self-selected, time intervals, for a free choosen number of days past and a few future days. Weekends are marked with an additional red vertical line. The indicator makes manuel backtesting of strategies more easily, but you can use ist for daily trading as well. Please note that the server time does not always correspond to the actual time.
FREE

Описание стратегии:
Набор торгуемых валютных пар: GBPUSD, GBPAUD, GBPCAD, GBPJPY, EURUSD, EURGBP, EURAUD, EURCAD, EURJPY, AUDUSD, AUDNZD, AUDCAD, AUDJPY, NZDUSD, NZDCAD, USDCAD, USDJPY
В момент открытия рынка после выходных, определяется на каких парах из списка цена прошла от открытия до закрытия недельной свечи более 2000 пунктов и открываем позицию в противоход недельному движению с целью забрать откат в 500 пунктов. Стоп не ставится.
Если цена пошла против позиции, то через кажды
FREE

Dynamic Indicator --> YKL_DinDX Dynamic Indicator that creates a Band based on the distance from moving average specified by the user. The indicator considers the period entered by the user in order to calculate the average distance from moving average, creating an upper band and a lower band. This indicator is utilized by EA YKL_Scalper, version 2.0 or superior.
FREE

This indicator is designed based on the Moving Origin indicator
When the moving origin indicator breaks the price, this indicator gives a signal
It is useful for better viewing of signals and analysis on them
Attributes: Can be used in all symbols Can be used in all time frames Too many signals Simple and quick settings Easy way to work
Settings: period: like moving average settings alarmShow: If you want to receive an alert in Metatrader after receiving the signal, enable this setting
a
FREE
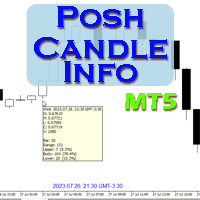
Show candle info with: Time in selected timezone Bar number Candle range points Upper wick points and percentage Body points and percentage Lower wick points and percentage Mark large/small candle body with customizable line. Settings group: Broker and local timezone. Lookback bars for candle marking. Large candle body Small candle body Date and time info with auto position or custom the x and y coordinate.
FREE

GLX1 Renko Euro Expert Advisor (EA) can create the Renko bar charts on EURUSD or EURAUD symbols only. The Renko charts are generated as real-time custom EURUSD or EURAUD charts which can be further used for technical analysis with any MT5 compatible indicator. If you want to create Renko charts on any symbol, please use GLX1 Renko Builder Expert Advisor from here. https://www.mql5.com/en/market/product/115077
Included Features: Truly responsive Renko Charting on a custom EURUSD or E
FREE

Bears Graph is a fully automatic, professional trading robot. Designed specifically for the foreign exchange market GBPUSD, time frame M30 . This EA does not need to configure parameters. Ready to work on GBPUSD M30 . You only need to decide on the choice of the lot. Default lot is 0.1 points. Trade smarter and safer with Bears graph! Our revolutionary trading EA has a smart algorithm which detect the trend, filter out market noise and make the most accurate decisions. Enjoy maximum capital
FREE

The indicator plots a curve of the difference between the values of two trading instruments (currency pairs).
The purpose of the indicator is to observe the processes of divergence and convergence of the values of two trading instruments. The results obtained can be used for trading strategies of statistical arbitrage, pair trading, correlation, and others.
Trading strategy
The indicator is attached to the chart of any trading instrument. In the input parameters, the names of trading i
FREE

Micro Demo ******************* Секундные графики в Meta Trader 5 ********************** Более точного инструмента для входа в сделку вы не найдёте. Платная полная версия: Micro "Second charts" В демоверсии секундные периоды сменяются случайным образом через случайные интервалы времени. Отсутствует автоматическая настройка периодов бесплатных индикаторов.
Входные параметры: Displayed bars - отображаемые бары Step of price levels, pp, 0-off - шаг отрисовки ценовых уровней, пункты Scale
FREE

Double Line Donchian Channel MT5/Meta Trader 5 Indicator, this is customized Indicator to show only 2 Lines of Highest and Lowest PRICE line where you can add a MA (MOVING AVERAGE) for center line. What is Donchian Channel?
Donchian Channels are three lines generated by moving average calculations that comprise an indicator formed by upper and lower bands around a midrange or median band. The upper band marks the highest price of a security over N periods while the lower band marks the lowest
FREE

FXRog = Forex Running On Growth
Expert Advisor description ShortTerm : Yes MidTerm : Yes LongTerm : Yes TargetProfit : By Money, value can be changed in the parameter StopLoss : By Maximum Open Position, all position will closed when maxtrade is reach, value can be changed in the parameter
Parameter description StartTrade : begining time to start trading EndTrade : last time ea to open a position MoneyManagement : 1 = FixLot, 2 = VolumeLot FixLot : lot of transactions with a fixed amoun
FREE

如果产品有任何问题或者您需要在此产品上添加功能,请联系我 Contact/message me if you encounter any issue using the product or need extra feature to add on the base version.
Floating Highest Lowest MT5 provides you an intuitive and user-friendly method to monitor the floating highest (profit) and lowest (loss) that all your trades together ever arrive. For example, I opened 3 orders, which arrived at $4.71 floating profit when trade following trend. Later when the trend is against me, these 3 orders arrive $30 in loss, and
FREE
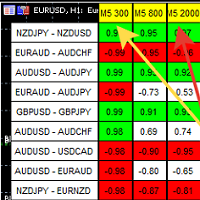
A script showing the correlation for three selected zones at once (TF-bar) In the parameters, select 3 options The data is displayed sorted by the first zone The script also creates a file in which it writes all the data without sorting. In this way, you can expand the number of zones to any number and perform the analysis in exsel
Parameters:
TF_Trade1 =PERIOD_M5; BarsCor1 = 300; TF_Trade2 =PERIOD_M5; BarsCor2 = 800; TF_Trade3 =PERIOD_M5; BarsCor3 = 2000; K = 0.8; WindSize
FREE

Market tops are characterized by Volume Climax Up bars, High Volume Churn and Low Volume Up bars (also called Testing). Market bottoms are characterized by Volume Climax Down bars, High Volume Churn and Low Volume Down bars (Testing). Pullbacks, in either up or down trends, are similar to market topping or bottoming patterns, but shorter in duration and with simpler volume patterns.
FREE

Product Description: Adaptive Y-Axis Scaling is a powerful MT5 indicator designed to enhance your trading experience by providing precise control over the Y-axis (price) scaling of your charts. This innovative tool allows you to customize the price scaling by specifying the number of pips from the visible chart's highs and lows. The calculated price range from this input is then used to set the maximum and minimum prices for the open chart, ensuring an optimized and comprehensive view of market
FREE

After purchasing, you can request and receive any two of my products for free!
После покупки вы можете запросить и получить два любых моих продукта бесплатно! The utility is designed for manual placement of pending orders at the high and low of yesterday. The program has a built-in trailing stop, virtual take profit and stop loss. Unworked orders are deleted at the end of the day or manually. You may be interested in my other products: https://www.mql5.com/ru/users/vypchela/seller
Settings
FREE

Investment Castle News Indicator will plot vertical lines before the news on the chart and categorized in three different colors in accordance with the news importance. You can choose to limit the news to the current chosen symbol or show all future news on the same chart. High impact news is marked in Red lines be default. Medium impact news is marked in Orange lines be default. Low impact news is marked in Yellow lines be default.
FREE
Please, if you like this AE, I would appreciate it if you could rate it with 5 stars ️ ️ ️ ️ ️ THANK YOU!!
Expert Advisor based on the signal generated by two MACDs (Moving Average Convergence Divergence), which can trade on different time frames (M1, M5, M15, H1, H4, etc.) The Expert has the following variables: >>>>>>>>>>>>>>>>>>> Magic number Slippage >>>>>>>>>>>>>>>>>>> Stop Loss (pips) Take Profit (pips) Trailing Stop (pips) Trailing Step (pips) Money management: Lot o
FREE

About This Indicator: RSI vs SMA Oscillator: A Comprehensive Technical Analysis Tool for Better View of Market Price
The RSI vs SMA Oscillator is a powerful technical analysis tool designed to understanding Market Price Fluctuation for buy or sell signals. This user-friendly Oscillator good for both novice and experienced traders, providing valuable insights into market trends and price movements. Key Features: - RSI Cross Alert: The indicator is based on the Relative Strength Index (RSI), a po
FREE
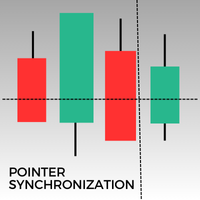
このMetaTrader 5インジケーターは、同じアセットのすべての開いているチャートにポインターを自動的に同期します。1分足チャートであれ、日足チャートであれ、ポインターはすべての開いているウィンドウで同じ価格に自動的に揃います。この機能により、一貫した迅速な分析が可能になり、意思決定が向上します。複数のチャート間でポインターを同期させることは、異なる時間枠で価格変動の正確な概要を維持しようとするトレーダーにとって、貴重なツールです。
FREE
GLEBシリーズ、バージョン1.0。分棒用の簡単なスライダープログラム。 アクティブな取引時間を含む多くの設定。 ベイディールに基づいて、セルディールを接続できます。 説明: 1.ストラテジースイッチ:キー「スピード」(オン/オフ) 2.トレンドコントロール:シャドウコントロール(オン/オフ) 3.バーのトレンドコントロールの深さ:Shdwcntrlのシャドウハイ 4.スプレッドコントロール:スプレッドコントロール(オン/オフ) 5.スプレッドリミッター:ボリュームスプレッドコントロール(ポイント) 6.ストップロスの自動計算:自動計算SLおよびTP(オン/オフ) 7.ストップロス範囲を自動的に縮小:ストップロス範囲を縮小(オン/オフ) 8.ストップロス低減率:低減率SL(1-max、1.5、2、... low) 9.タイク利益削減率:削減率TP(1-max、1.5、2、... low) 10. taik利益の自動追求:AUTO継続取引(オン/オフ) 11.ストップロスがトリガーされたときにセールを開始します:SLロス-売り(オン/オフ)
取引システムは開発中です。フィードバックを
FREE

ATR is a measure of volatility introduced by market technician J. Welles Wilder Jr. in his book, "New Concepts in Technical Trading Systems". In general, traders are accustomed to seeing the ATR in the form of a sub-window indicator. What I am presenting here is a simplified version of ATR - just the current ATR number - very useful for monitoring just the very moment of the current chart. If you want to monitor several timeframes in the same chart, just add the ATR Monitor indicator several tim
FREE

Are you having trouble with too many events in the economic calendar? This reduces to the minimum number you need. You can filter by country code importance any key words and you can receive alerts before the set time of the event. ++++++++++++++ If country code is blank, display available code on the expert tab. You need to turn off the automatic calendar update setting in MT5. Any sound file of .wav format in Sounds directory. The length of keyword characters is limited by MT5.
FREE

I present the well-known Moving Average indicator connected to the ATR indicator.
This indicator is presented as a channel, where the upper and lower lines are equidistant from the main line by the value of the ATR indicator.
The indicator is easy to use. The basic settings of the moving average have been saved, plus the settings for the ATR have been added.
Moving Average Parameters:
MA period Shift MA Method
Moving Average Parameters:
ATR TF - from which timeframe the values are t
FREE

This indicator allows you to visually identify with a different color the candlesticks that exceed a certain limit of the ATR.
Just drag and drop it on the chart.
The user must enter the value of the ATR period.
The user must enter the value of the ATR limit with which he wants to identify the candlesticks.
In the colors tab, the user can select the colors with which to repaint the candles.
It is recommended that the first color always be None.
The second color corresponds to b
FREE

Bill Williams' divergent bar with angulation. The angle between the green line and the top/bottom of the bar is used as an angle, which basically corresponds to the updated recommendations from Justin Williams Angulation for the Wiseman Bullish and Bearish Divergent Signal Bar - YouTube . The default settings of the angle of 85 and 21 bar from the moment of crossing the lip line of the Alligator work quite well. If you use this indicator in real trading, I highly recommend not to engage in day
FREE

Please note that the price of the EA will change after every three copies sold. Therefore, the next price will be $290 This is an Neural Network EA which is trained on NZDCAD symbol from 2010 until 2022-12-01 at M15. The EA not using dangerous method like martingale or grid. But you can enable the Martingale method on the EA's inputs.
Every month the trained data would be updated on my server automatically. So the EA need to be updated every month. You have to download every month the new ve
FREE

backtester buttons for testing strategies in the MT5 strategy tester.
load up strategy tester then click on visual test and once visual tester opened apply any chart template you'd like. To update the chart pause the visual tester and apply templates, colors and such like the normal chart. On the settings you can choose lot size and take profit and stop loss.
Enjoy
FREE

El indicador técnico conocido como Líneas de Tendencia Perfecta . Este indicador es una herramienta valiosa en el análisis técnico y se utiliza para mejorar la toma de decisiones en el trading. Aquí tienes una descripción paso a paso de cómo funciona y cómo puede ser utilizado por los traders: Identificación de Tendencias : Las líneas de tendencia perfecta se dibujan conectando dos o más puntos de precio en un gráfico, revelando así la dirección general del mercado. Una línea ascendente indica
FREE

Description
The base of this indicator is an ZigZag algorithm based on ATR and Fibo retracement. This indicator is not redrawing in sense that the ZigZag's last shoulder is formed right after the appropriate conditions occur on the market. The shoulder doesn't change its direction afterwards (can only continue). Note: An indicator with advanced possibilities is also available.
Indicator input parameters
The input parameters allow to change the sensitivity of the ZigZag. ATR period ATR mul
FREE

Pairs Navigator is a simple and easy-to-use tool that allows you to view all of your charts in a single window. This eliminates the need to open multiple charts from the Market Watch window, saving you time and effort. Pairs Navigator is also very lightweight, so it will not put a strain on your RAM or cause your MT4/5 platform to hang. To use Pairs Navigator, simply drag and drop the currency pairs you want to view into the Pairs Navigator window. You can then easily switch between charts by
FREE

The RFOC Symbol Background was created to display the name of the asset and the current timeframe in the background of the chart.
Displaying the name of the asset at the bottom of the chart is often used by traders who are designing the screen for spectators, making it easier to identify the asset and the timeframe during a class, for example.
It is available for the user to select the font size (small, medium or large) and select the color for better viewing according to the background colo
FREE

The " Pure View " indicator is designed to quickly display and hide indicators on the chart. Description
1. Currently Pure View works with Stochastic, MACD, RSI indicators 2. Displaying and hiding indicators occurs using hot keys 3. The key combination Shift + C will display or hide the "Stochastic" indicator on the chart 4. The key combination Shift + V will display or hide the "RSI" indicator on the chart 5. The key combination Shift + B will display or hide the "MACD" indicator on the chart
FREE

Sapphire Strat Maker Alt is an EA builder ( Expert Advisor Builder) . With it you can easily create new strategies and optimize them to find the bests parameters to improve your results at maximum. The objective is to bring the capabilities of MQL5 to everyone, even if you don't know how to code. Check out the Pro Version clicking here - Sapphire Strat Maker .
With this Expert Advisor you can create strategies by combining the indicators provided by the EA. A few of the functionalities a
FREE
The version of Kali IndicOptimizer for Metatrader 5. This tool is not only an Expert Advisor, it is used to optimize your indicators, to design your own Expert Advisor, to analyze the buffers of your indicators without having access to the source code. I searched for quite some time how I could optimize my indicators without having to program or modify an expert each time. With this tool, anyone can get started in strategy design or even have their own personalized Expert Advisor. It can optimi
FREE

The indicator makes calculations based on data obtained from one of seven (7) moving averages and colors the chart.
Simple moving averages are those that have only one important calculation parameter - the period.
The shift in the indicator is not used.
There is a shift trick setting, it is used to smooth the result of calculations. You can see the changes if you reduce this parameter to 1 (minimum value).
shift trick must always be less than the period value.
Available averages:
MA
FREE
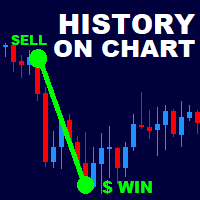
History On Chart is an indicator that shows the "trail" of all trades made in a specific period of time. It shows the entry and exit point with their respective dates and prices. It also shows the type of trades and the cash result. Open trades are also displayed, but only the entry point. The indicator is free and fully customizable. If you have any questions please contact us. Enjoy!
This is a free indicator, but it took hours to develop. If you want to pay me a coffee, I appreciate a lot
FREE

Doji Engulfing Paths enables to get signals and data about the doji and the engulfing patterns on charts. It makes it possible to get opportunities from trends, and to follow the directional moves to get some profits on the forex and stocks markets. It is a good advantage to take all the appearing opportunities with reversal signals and direct signals in order to obtain some profits on the forex market. With the demo version, only the signals starting with the 20th candle or bar are available.
FREE
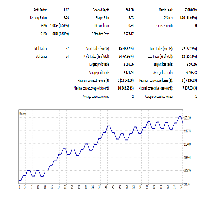
This Expert is developed to optimize parameters to trade in choppy markets. Simply use optimization to find the proper inputs for specific symbol you are interested in. This is a light load EA from processing point of view. You can easily run this on several charts simultaneously. Make sure to set a different magic number for each. note: The screenshot shows a 20% profitability in USDCAD for a period of 4-months and 5% draw-down using optimization to find best inputs.
FREE

ACCOUNT FLIPPER EA A trading bot for GBPUSD Lot size is calculated by multiplying the lot factor by each 1000 USD on account. Advisable to use account sizes of USD 1000 and above. Account types: Hedge accounts, Standard accounts are preferred i.e. no commissions, Use well regulated brokers eg ICMarkets. all this provides room for the strategy to work smoothly for stabilized results and removing the possibility of the model crashing. ADJUST The Time settings to your own time zone because the
FREE

SHADOW vous donne des signaux d'achat et de vente solides avec un risque minimal. Vous pouvez voir dans quelle direction le prix évolue et la force du mouvement. Shadow filtre le bruit du marché et améliore radicalement les performances des traders.
Points forts: Détection visuelle efficace des tendances. Bruit du marché des filtres Ne repeint ni ne recalcule jamais. Signaux strictement sur "fermeture du bar". Fonctionne dans tous les symboles. Pop-up intégré, e-mail, notification push e
FREE

Highly configurable OBV indicator.
Features: Highly customizable alert functions (at levels, crosses, direction changes via email, push, sound, popup) Multi timeframe ability Color customization (at levels, crosses, direction changes) Linear interpolation and histogram mode options Works on strategy tester in multi timeframe mode (at weekend without ticks also) Adjustable Levels Parameters:
OBV Timeframe: You can set the lower/higher timeframes for OBV. OBV Bar Shift: Y ou can set the offs
FREE
Mit diesem EA kannst du die Trades eines zweiten MT5 Terminals kopieren.
Dazu definierst du das eine Terminal als Sender und das andere als Empfänger.
Es kann eingestellt werden ob alle Trades kopiert werden sollen, oder nur die mit einem bestimmten Kommentar.
Wenn du Fragen hast kannst du mir gerne eine Anfrage senden, ich helfe dir gerne bei den Einstellungen weiter.
FREE

1. The Expert Adviser is built with a basic, simple and stable trading strategy with a touch of Price Action Principle that is highly effective and accurate for a sniper entry system. The EA have a good money management System.. 2. The expert advisor works best as from 5minutes time frame and above, The higher the time frame, the more accurate is the signal.... 3. The expert advisor work with all broker all currency pair and synthetic indices... 4. Use a reasonable lot size and correct settings
FREE

This strategy is flexible and allows for adjustments according to your preferences. You can easily open trades independently and close them using the app. The strategy includes implemented settings such as TEMA, trailing stop loss, STOCH, RSI, MACD, etc. With this strategy, you gain tools and techniques that can lead to successful trading on financial markets. For specific details and setting options, do not hesitate to contact me. Tested on EURUSD on the M5 chart.
For a detailed guide, please
FREE
MetaTraderマーケットは、履歴データを使ったテストと最適化のための無料のデモ自動売買ロボットをダウンロードできる唯一のストアです。
アプリ概要と他のカスタマーからのレビューをご覧になり、ターミナルにダウンロードし、購入する前に自動売買ロボットをテストしてください。完全に無料でアプリをテストできるのはMetaTraderマーケットだけです。
取引の機会を逃しています。
- 無料取引アプリ
- 8千を超えるシグナルをコピー
- 金融ニュースで金融マーケットを探索
新規登録
ログイン