 MetaTrader 5
 Experts
 지표
지표
 라이브러리
라이브러리
 유틸리티
유틸리티
 위젯
위젯
 규칙
규칙
MetaTrader 5용 무료 Expert Advisor 및 지표 - 24
 트레이딩 로봇과 지표를 사용하여 외환 거래를 더 수익성 있게 만들 수 있습니다. 트레이딩용 로봇을 사용하면 개점 및 폐점 거래를 자동화할 수 있으며, 지표는 시장 행동을 보다 정확하게 예측할 수 있습니다.
이 페이지에는 MetaTrader 5 응용 프로그램의 카탈로그가 나와 있습니다.
트레이딩 로봇과 지표를 사용하여 외환 거래를 더 수익성 있게 만들 수 있습니다. 트레이딩용 로봇을 사용하면 개점 및 폐점 거래를 자동화할 수 있으며, 지표는 시장 행동을 보다 정확하게 예측할 수 있습니다.
이 페이지에는 MetaTrader 5 응용 프로그램의 카탈로그가 나와 있습니다. 
RoundNumbers indicator is a simple and powerful psychological price levels. Trader usually use these levels as a Support and Resistance (SnR). Indicator Input: Levels - Numbers of levels drawn on chart. Default 30 levels. BoxSize - Box size drawn on each levels, indicate buffers around levels. Default value 1pips (10point) above and below each levels. ZoneSize - Distance between each levels, default value 10pips (100point). Style & Colours - User inputs customization. For MT4 version, p
FREE
소개 Break Asian Range는 잘 알려진 ‘아시아 고점과 저점’ 전략을 자동화한 트레이딩 봇입니다. EURUSD, GBPJPY 및 기타 변동성이 큰 통화쌍에서 아시아 세션의 돌파를 감지하고 거래하도록 설계되었습니다. 사용자가 원하는 보수적 또는 공격적인 스타일에 맞춰, 사용자 정의 가능한 기술적 확인 및 고급 리스크 관리(SL, TP, 트레일링 스톱, 가변 리스크, 재진입 등)를 결합합니다. 다양한 타임프레임을 지원하며, 도지, 해머, 엔걸핑과 같은 핵심 캔들 패턴을 인식하여 진입을 확인할 수 있습니다.
주요 기능
잘 알려진 반복적인 시장 행동을 기반으로 한 전략. 유연성: 확인 조건, 거래 시간, 리스크 등 다양한 요소를 사용자 정의 가능. 모든 통화쌍 및 자산과 호환됨. 사용자 스타일에 따라 보수적 또는 공격적인 거래가 가능. 재진입, 동적 리스크 관리 및 거래 필터링 기능 포함. 2025년 4월 여러 통화쌍에서 좋은 결과로 테스트 완료 (아래 이미지 참고).
댓글
FREE

Synthetic indeces are one of a kind of forex markets. Specially, on boom and crash indices on M1 timeframe is really interesting. I always thought that it was impossible to catch spikes safely until today. Everything has it's limits. This EA is based on martingale strategy with low drawdown. Max grid level is 3. When each trades goes on drawdown, the next trade will be multiplied by 2. The EA does not use take-profit or stoploss . So the backtesting will show the same results as real-time tradi
FREE

Adaptive Grid Trend EA is an automated trading system designed to operate effectively in volatile market conditions. It combines an Adaptive Grid structure with Trend Alignment , Dynamic Volatility Control , and Multi‑Session Logic to ensure the EA adjusts intelligently to changing market environments. The EA does not use exponential Martingale. Instead, it applies a Dynamic Linear Recovery model that calculates position scaling based on real‑time volatility and portfolio conditions, ensuring th
FREE

OVERVIEW
Liquidity Sweep Hunter identifies liquidity highs and lows across three different lookback periods and keeps them active until they are mitigated. This creates a persistent view of where resting liquidity has formed instead of only showing the latest swing points.
The indicator also displays a heatmap that highlights the relative strength of active liquidity levels and generates reversal signals after price sweeps multiple visible liquidity bands before reclaiming them. Optional tr
FREE

WOW Candle Time and Spread 는 두 가지 핵심 정보를 항상 눈앞에 보여줍니다. 현재 캔들이 마감되기까지 남은 시간과 지금의 스프레드입니다.
카운트다운은 패널에 표시할 수 있고 현재 캔들 위에 직접 표시할 수도 있어, 캔들 마감 진입 타이밍을 놓치지 않습니다. 스프레드는 색으로 구분되어 — 낮을 때 초록, 중간 구간은 호박색, 너무 넓을 때 빨강으로 — 진입 전에 체결 비용을 한눈에 파악할 수 있습니다.
주요 기능: - 캔들 마감 카운트다운 — 패널에 표시하고 선택적으로 캔들 위에도 표시 - 포인트 단위 실시간 스프레드 모니터, 색상 구분 (낮음 / 중간 / 높음 임계값은 직접 설정) - 캔들 시간과 스프레드를 함께, 또는 각각 따로 표시 - 4가지 표시 레이아웃: 값만 / 라벨 포함 / 두 줄 / 제목 포함 세 줄 - 3가지 폰트 테마, 글자 크기와 줄 간격 조절 가능 - 차트 타이머, 3가지 배치 방식 (캔들 위 / 아래 / 오른쪽)와 3가지 텍스트 스타일
FREE

종합적인 트렌드 분석 및 거래 아이디어를 위한 "Demark Trends Indicator"의 강력함을 경험해보세요. Demark 지표는 시장 트렌드와 소진 지점을 평가하는 데 효과적으로 알려져 있습니다. 저희 Demark Trends Indicator는 이러한 전문성을 한 단계 더 높여, 자동으로 정확한 트렌드 라인을 차트에 그립니다. 캔들 수, 알람 설정, 라인 색상 등을 포함한 사용자 정의 가능한 매개 변수를 통해 분석에 완전한 제어력을 갖게 됩니다. 초보자든 경험이 풍부한 트레이더든 상관없이, 우리의 인디케이터는 트렌드 분석을 간단화하고 시간과 노력을 절약해줍니다. 다음과 같은 "Demark Trends Indicator"의 잠재력을 발휘하세요: 정확한 트렌드 식별: 자동으로 그려지는 정확한 트렌드 라인으로 시장 트렌드를 원활하게 분석합니다. 효율적인 거래 전략: 현재 트렌드 상태를 평가하고 정보에 기반한 거래 결정을 위해 잠재적인 소진 지점을 예측합니다. 사용자 정의 가능한
FREE

MOST INDICATORS SHOW YOU ONE THING — PRICE OR VOLUME. THIS SHOWS YOU BOTH, TOGETHER. SMC Volume Profile Regression Channel builds a statistically-fitted price channel (linear or polynomial regression) around your chart, then overlays real-time volume pressure and a right-side volume distribution profile — so you can see structure and participation in a single view instead of switching between tools. WHAT IT DOES — Plots a regression channel (linear or quadratic curve fit) with adjustable standar
FREE

Pare de lutar contra o terminal. Comece a operar com precisão cirúrgica. O Profit Station Pro não é apenas um painel; é uma reformulação completa da experiência de trading no MetaTrader 5. Desenvolvido para traders que exigem agilidade, este utilitário transforma o gráfico em um Cockpit Operacional , eliminando a necessidade de boletas complexas e cálculos manuais lentos. Seja você um Scalper ou Day Trader, o Profit Station oferece as ferramentas que faltavam para sua consistência. Funcio
FREE

RelicusRoad Trading Sessions는 MetaTrader 4와 MetaTrader 5용 거래 세션 지표로, M1, M5, M15 차트에서 Tokyo, London, New York 세션의 시작 시각을 점선 수직선으로 표시합니다. 각 세션의 시작은 오늘과 이전 평일들에 걸쳐, 해당 세션의 색으로 선, 작게 회전된 이름 라벨, 이벤트 마커로 표시됩니다. 마우스를 올리면 세션 이름과 시작 시각이 보입니다. 이 지표는 시작 시각만 표시하며 세션 범위, 겹침, 종료 시각은 음영으로 표시하지 않습니다. 작동 방식 지표는 로드될 때 브로커 서버 시간과 UTC 사이의 차이를 읽어 정시 단위로 반올림한 뒤 한 시간을 뺍니다. 그런 다음 현재 UTC 날짜에서 거슬러 올라가는 각 평일에 대해, 서버 시간으로 환산한 Tokyo 시작(23:00 UTC), London 시작(07:00 UTC), New York 시작(12:00 UTC)을 배치합니다. 토요일과 일요일은 건너뜁니다. Tokyo:
FREE

RelicusRoad Multi Timeframe Trendbar는 MetaTrader 4와 MetaTrader 5용 멀티 타임프레임 추세 지표로, M1부터 MN1까지 아홉 개 시간대의 Uptrend, Neutral, Downtrend 상태를 차트 모서리에 색이 있는 점들의 행으로 보여줍니다. 각 시간대는 이름이 위에 붙은 점 하나를 차트 오른쪽 아래 모서리에 갖습니다. 색이 상태를 알려주므로 차트를 바꾸지 않고도 어떤 시간대들이 일치하는지 볼 수 있습니다. 작동 방식 각 시간대에 대해 지표는 그 시간대의 현재 봉에서 두 개의 표준 도구를 비교합니다. step 0.02, maximum 0.2의 Parabolic SAR와 period 14의 ADX의 +DI, -DI 선입니다. 방향이 표시되려면 둘이 일치해야 합니다: Uptrend: Parabolic SAR가 종가 아래에 있고 +DI가 -DI 위에 있음, 기본값 lime. Downtrend: Parabolic SAR가 종가 위에 있고
FREE
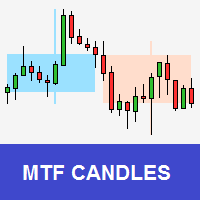
Tool that allows viewing candles in multiple timeframes. This way, it helps the analysis in multiple timeframes.
This is another product developed by Renato Fiche Junior and available to all MetaTrader 5 users!
Input Parameters
- Option 1 - TimeFrame: Standard MT5 timeframe - Option 2 - Custom TimeFrame (in minutes): Or, if this value is different from zero, the timeframe will be customized. This allows you to choose timeframe other than the MT5 standard. - Total Candles: Number of candles. -
FREE

HAMMER WITH TRAILING STOP LOSS EA. It is an automated trading program with two main functions. Use hammer and reverse hammer candlesticks as entry signals. Combined with a Trailing Stop, moving the Stop Loss protects the profit of the position. This program is only compatible with pairs such as XAUUSD and BTCUSD. It runs on Exness and managed funds like FTMO and Ther 5R. In the time, the program only runs one position. Experimental test results across different timeframes and recommendations. M
FREE

Product Name AllAverages Cross EA – 36 Moving Average Crossover Strategy Short Description (one-liner) Universal MA crossover EA with 36 built-in moving average types, multi-timeframe support, ATR-based risk management, multi-level TP partial close, and trailing stop — no external indicators required. Full Description Overview AllAverages Cross EA is a fully self-contained dual moving average crossover Expert Advisor that internalizes 36 different moving average algorithms. Unlike typical MA cro
FREE
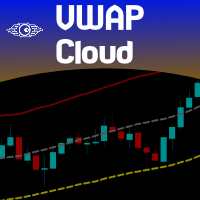
Do you love VWAP? So you will love the VWAP Cloud . What is it? Is your very well known VWAP indicator plus 3-levels of Standard Deviation plotted on your chart and totally configurable by you. This way you can have real Price Support and Resistance levels. To read more about this just search the web for "VWAP Bands" "VWAP and Standard Deviation".
SETTINGS VWAP Timeframe: Hourly, Daily, Weekly or Monthly. VWAP calculation Type. The classical calculation is Typical: (H+L+C)/3 Averaging Period to
FREE

Aurex Market Structure - CHoCH/BOS (Fractal) A structure-detection indicator that identifies swing highs/lows using a symmetric fractal filter, then flags Break of Structure (BOS) and Change of Character (CHoCH) events when confirmed closes cross those swing levels. Detection method Swing points are located using a fractal window of configurable length: a high is registered when it is the local extreme across the surrounding bars on both sides, and the same logic applies inversely for lows. Once
FREE

**RSI Divergence Auto for MT5**
is a MetaTrader 5 indicator that automatically identifies potential bullish and bearish divergences between price movement and the Relative Strength Index.
The indicator compares price highs and lows with RSI highs and lows. When it detects a difference between them, it displays the divergence directly on the chart.
Features - Automatic detection of potential bullish divergences. - Automatic detection of potential bearish divergences. - Visualization of Bull a
FREE

Intra Candle Structure helps you see how price is developing inside a higher-timeframe candle while that candle is still forming. Instead of waiting for a candle to close and then guessing what happened inside it, the indicator builds a rolling structure line from live intra-candle segments and projects that structure clearly on the chart. This makes it much easier to read momentum shifts, pauses, continuation, and break behavior as they happen. It is especially useful in fast and volatile marke
FREE
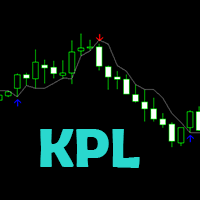
KPL 스윙 지표는 진입 및 출구를 자동화하는 간단한 트렌드 팔로우 메카니컬 거래 시스템입니다. 이 시스템은 하드 스탑 로스와 트레일링 스탑 로스를 사용하여 이익 거래에서 출구합니다. 가격이 어느 정도(또는 낮은)으로 움직일지 누가 알 수 있으므로 목표가 지정되지 않습니다. 트레일링 스탑 로스는 이익을 고정하고 거래에서 감정을 제거합니다. Amibroker 지표에서 변환되어 수정되었습니다. KPL 스윙 지표는 진입 및 출구를 자동화하는 간단한 트렌드 팔로우 메카니컬 거래 시스템입니다. 이 시스템은 하드 스탑 로스와 트레일링 스탑 로스를 사용하여 이익 거래에서 출구합니다. 가격이 어느 정도(또는 낮은)으로 움직일지 누가 알 수 있으므로 목표가 지정되지 않습니다. 트레일링 스탑 로스는 이익을 고정하고 거래에서 감정을 제거합니다. Amibroker 지표에서 변환되어 수정되었습니다. 와 결합하면 완벽 KPL Chart Uptrend & Downtrend
FREE

GoldGridBest V3 est un Expert Advisor pour le trading automatisé de l'or (XAUUSD) et autres devises Il utilise une stratégie de grille avec martingale optimisée, des filtres de volume multi-timeframes et une gestion du risque configurable. Les paramètres sont adaptables selon le capital et les conditions de marché. Vous pouvez m'écrire après l'achat pour plus d'informations et recevoir les documents nécessaires à la bonne utilisation Bonne chance... bonne chance
FREE

======================================================== OFX DASHBOARD — MQL5 MARKET PRODUCT DESCRIPTION (formatting notes: **bold** = editor Bold button; lines starting with "•" = bullet-list button; UPPERCASE lines = section headings) ========================================================
SHORT TITLE (product name field): OFX Dashboard — All-Engine OrderFlow Cockpit for XAUUSD (Gold)
------------------------------------------------------- OVERVIEW --------------------------------------
FREE

앵커 VWAP(Anchored VWAP) 앵커 VWAP는 기존 VWAP의 변형으로, 거래 세션 시작이나 고정된 시간 간격이 아닌 특정 시점(앵커)에서 지표 계산을 시작합니다. 이는 주요 뉴스, 트렌드 시작, 지지선 또는 저항선 돌파와 같은 기술적 이벤트와 같은 특정 사건부터의 가격과 거래량 간의 관계를 평가하려는 트레이더에게 유용할 수 있습니다. 이 지표는 외환, 주식 및 지수에서 사용 가능합니다. 동일한 차트에 여러 인스턴스를 추가하고 각 VWAP의 앵커 지점을 클릭 한 번으로 수정할 수 있습니다. 가격이 VWAP에 도달할 때 알림을 활성화하십시오. VWAP는 "자성"을 가지고 있습니다: 캔들 위에 마우스를 올리면 HIGH로, 중앙에 두면 TYPICAL로, 캔들 아래에 두면 LOW로 자동 설정됩니다.
FREE

MetaTrader's built-in Force Index is not the formula Dr. Alexander Elder published. It multiplies the volume of a bar by the change of a 13-bar moving average of price. Elder defined the force of a bar as its volume times the change of its close, and smoothed that with an exponential moving average. Measured on gold over the last year, the two disagree about which side of zero the market is on roughly one bar in six (M15, H1 and H4). Elder Force Zones computes Elder's own definition and builds h
FREE

Gann HiLo Swing is a free indicator for MetaTrader 5 with two of W.D. Gann's tools: the HiLo Activator line and the 2-bar swing chart. It shows the trend side and the swings. An arrow and an alert mark the start of a new trend. Everything comes from closed bars, so nothing on the chart changes after its bar has closed. Quick start Attach the indicator to any chart. It draws on the price chart. Keep the HiLo period at 3 (Gann's own), or raise it for fewer trend changes. Read the line. Blue is an
FREE

Range Explosion 소개 Range Explosion은 시장 범위를 감지하고, 정확한 지지선과 저항선을 그리며, 돌파 기회를 정확하게 식별하는 강력하고 무료인 트레이딩 도구입니다.
Break Out Explosion 프로젝트의 일부로서, 초보자와 전문가 모두에게 신뢰할 수 있는 고급 시각적 솔루션을 제공합니다. 추세선 돌파 개념에 관심이 있다면, 주요 추세 방향의 돌파를 감지하는 고급 도구를 확인해 보세요:
https://www.mql5.com/en/market/product/152676 이 지표의 화살표를 기반으로 거래하는 EA를 원하시나요? 아래 링크를 통해 $30 에 직접 작업을 생성하시면 제가 만들어드리겠습니다:
https://www.mql5.com/en/job/new?prefered=eeecad Break Out Explosion 프로젝트 의 최신 소식과 업데이트를 받으려면 이 채널을 구독하세요:
https://www.mql5.com/en/channels/brea
FREE

제 MT4 및 MT5 지표를 모두 무료로 받으세요 — 방법 알아보기
새 도구의 가격 은 $30 이며, 혜택은 출시 첫 주 또는 첫 3건의 구매에 적용됩니다 ! MQL5 Trading Tools 채널 : 제 MQL5 채널에 가입하여 최신 소식을 받아보세요 역동적인 금융 시장에서 추세 반전 신호를 식별하는 것은 효과적인 거래에 필수적입니다. RSI Divergence Scanner는 다양한 통화 쌍과 시간대에서 RSI 다이버전스 신호를 정확하고 효율적으로 감지하도록 설계되었습니다. MT4 버전 자세히 보기: RSI Divergence MT4 Scanner 더 많은 제품 보기: 모든 제품 1. RSI 다이버전스 이해하기 RSI (상대 강도 지수) 는 가격 모멘텀을 측정하는 기술 지표로, 트레이더들 사이에서 널리 사용됩니다. RSI 다이버전스는 가격 움직임과 RSI가 반대 방향으로 움직일 때 발생하여 잠재적인 추세 반전을 나타냅니다. 다이버전스 유형: 강
FREE

Order Block Breaker Block Zone by RWBTradeLab
A strict Order Block, and the Breaker Block that a failed one turns into. Most Order Block indicators mark any candle before a move. This one asks for five things, all mandatory, and shows you the evidence for each — with a full market structure engine built in, so the BOS or CHoCH that confirmed a block is drawn on the chart instead of having to be trusted. All from CLOSED candles only.
What Makes an Order Block Here
Five things have to happen,
FREE

Watchlist Symbol Changer – 한 번의 클릭으로 차트 종목 전환, 보유 포지션을 손익에 따라 색상 표시
시장 감시의 모든 종목마다 버튼이 있는 무료 차트 패널입니다. 클릭하면 차트 종목이 바뀌고 시간 프레임은 유지됩니다. 이 Expert Advisor는 거래하지 않습니다.
기능 - 시장 감시 종목마다 버튼 하나, 현재 종목은 하늘색 테두리로 표시됩니다. - 페이지 넘김(Prev / Next)과 시장 감시가 바뀐 후 사용하는 새로고침 버튼. - 보유 포지션: 이익이면 녹색, 손실이면 빨간색. 같은 종목의 여러 포지션은 합산되며 스왑 포함 여부를 선택할 수 있습니다. - 접두어로 종목을 거르는 선택적 필터. - 터미널 부담이 적음: 타이머는 포지션 색상에만 사용되고 변경이 있을 때만 다시 그립니다.
설정 모서리, 여백, 버튼 크기, 줄당 버튼 수(0 = 차트 너비에 따라 자동), 글꼴 크기, 모든 색상, 포지션 색상 켜기/끄기, 스왑 켜기/끄기, 새로고침 간격,
FREE
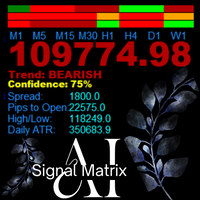
AanIsnaini Signal Matrix MT5 Multi-Timeframe Confidence Signal Dashboard The Free Version of AanIsnaini Signal Matrix MT5 Pro AanIsnaini Signal Matrix MT5 is a powerful all-in-one indicator that analyzes market direction and confidence levels across multiple timeframes — allowing traders to see the overall bias of the market at a single glance. It combines signals from Price Action , Support–Resistance , and several proven technical tools (MACD, ADX, RSI, MA slope, ATR, and Volume Ratio), then
FREE

Check Out All Our Products: Click Here TradingCalendar Visualize Your Trading Performance: TradingCalendar automatically transforms your MetaTrader trading history into a clean monthly calendar, making it easy to see your trading performance at a glance. Daily Profit & Loss: Each trading day displays your daily P&L and number of trades. Profitable and losing days are clearly highlighted for quick performance review. Monthly Statistics: View your total monthly P&L and number of active trading
FREE

Suvarna Scalper Suvarna Scalper 는 XAUUSD 거래를 위해 설계된 Gold 중심의 프리미엄 Expert Advisor 입니다. 간단한 설정, 제어된 recovery 로직, 차트에서의 명확한 모니터링을 원하는 트레이더를 위해 만들어졌습니다. 이 EA 는 짧은 백테스트에서만 좋아 보이도록 만든 제품이 아닙니다. Suvarna Scalper 의 가장 큰 강점은 장기 생존에 초점을 둔 구조입니다. Grid trading 은 본질적으로 위험하며, 많은 Grid EA 는 일정 기간 수익을 낼 수 있지만 시장이 강하게 움직이면 실패할 수 있습니다. Suvarna Scalper 는 Gold 시장 압력을 더 지능적으로 처리하기 위해 제어된 basket management 로 만들어졌습니다. 특별한 포인트
Suvarna Scalper 의 특별한 점은 장기간 Grid trading 조건에서 살아남도록 설계되었다는 것입니다. 일반적인 Grid trading 에서는 강한 시장
FREE

MT5 Chart Object Sync is a powerful utility indicator for MetaTrader 5 that automatically synchronizes drawing objects between multiple charts of the same trading symbol. Create or modify a drawing object on one MT5 chart and the changes can be synchronized automatically to other charts using the same symbol, including different timeframes. No master chart or slave chart is required. Install the indicator on the charts you want to synchronize, and the charts communicate automatically. KEY FEATUR
FREE

Here our more valuable tools
SMC Trend Trading , Easy SMC Trading , Institutional SMC Architect Volume Analysis Tools , Volume flow Profile , Market volume profile , FVG with Volume , Liquidity Heatmap Profile , Volume Spread Analysis Automatic Professional Theme: Instantly applies a high-contrast "Color on White" theme with DeepSkyBlue bull candles and Black bear candles for maximum clarity. Interactive Timeframe Panel: 21 vertical buttons on the left side allow for one-clic
FREE

Nicks Quantum Scalper Free
Welcome to the Free Edition of the Quantum Series. This is an institutional-grade, fully automated scalping algorithm developed natively for the MetaTrader 5 terminal. Specifically engineered for the ultra-liquid EURUSD M15 framework, this Expert Advisor completely discards chaotic lagging indicators. Instead, it utilizes an advanced, hyper-responsive Dual Exponential Moving Average (EMA) Trend Engine to exploit intraday overextended price expansions. Equipped with a
FREE

Product Name: Daily Gold Breakout A disciplined US Session breakout strategy for XAUUSD (Gold) that focuses on capturing single high-momentum bullish moves. The Daily Gold Breakout EA is a straightforward, automated trading system designed specifically for the XAUUSD (Gold) market on MetaTrader 5. It operates on a strict "Quality over Quantity" philosophy. Instead of over-trading, this EA waits for one specific high-probability setup per day during the volatile US Session open. It identifies co
FREE

이 Expert Advisor는 Didi Index 지표의 로직을 기반으로 MetaTrader 5에서 거래를 자동화하기 위해 개발되었습니다.
EA는 사용자가 설정한 규칙과 매개변수에 따라 모든 거래를 차트 상에서 자동으로 실행합니다. 이 로봇의 개념은 명확하고 객관적인 진입 및 관리 로직을 적용하여, 외부 연동이나 추가 라이브러리 없이도 트레이더가 거래 실행 상태를 쉽게 확인할 수 있도록 하는 데 있습니다. 주요 기능 자동 거래
Didi Index 지표 로직을 기반으로 거래가 자동 실행됩니다. 거래 시간 설정
EA가 거래를 수행할 수 있는 시간대를 설정할 수 있으며, 설정된 시간 외에는 새로운 거래가 열리지 않습니다. 트레일링 스탑
설정된 조건에 따라 가격 움직임을 따라 자동으로 스탑을 조정합니다. 자동 브레이크이븐
지정된 조건이 충족되면 스탑을 진입 가격으로 자동 이동합니다. 차트 정보 패널
차트 상에 EA의 운영 정보를 표시하여 거래와 로봇 상태를 실시간으로 모니터링할
FREE

Overview of the Market Sessions Indicator The Market Sessions Indicator is a tool designed to help traders visualize the active trading hours of major global financial markets—specifically the Tokyo, London, and New York sessions. By clearly marking these time zones on the chart, the indicator allows users to identify the partitioning of major trading sessions. There are 3 regular trading sessions: - Tokyo Session - London Session - New York Session The indicator works from the H1 timeframe and
FREE
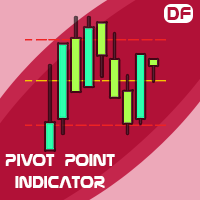
This indicator calculates support and resistance prices in multi-timeframe with different formulation and draw them on the chart that style do you choose. And If you want, Indicator can alert you when the current price arrive these pivot levels. Formulations: Classic, Camarilla, Woodie, Demark, Floor, Fibonacci
Alert Options: Send Mobil Message, Send E-mail, Show Message, Sound Alert
Levels: PP, S1, S2, S3, S4, S5, R1, R2, R3, R4, R5, TC, BC and Middle Points Why do you need this indicator:
Ti
FREE

# CopyMaster Pro Trade Copier
## What Is This
CopyMaster Pro is a local trade copying tool that syncs trades between multiple MT4/MT5 terminals. One account trades, others follow automatically. No server needed, no VPS required. Works on a single computer with multiple terminals.
## What It Does
Copies trades from one account to others. You open a gold position on Account A, Account B and C will follow. You close on A, others close too. Simple as that.
## Why This One
**Free** — No monthl
FREE

Candle Countdown (MT5) — 현재 캔들 종료까지 남은 시간 Candle Countdown 는 MetaTrader 5용 경량 인디케이터로, 현재 캔들이 마감(종료)되기까지 남은 시간 을 실시간 카운트다운으로 표시합니다. 1초마다 업데이트되며, 차트를 지저분하게 만들지 않고 깔끔하게 보입니다. 주요 기능 실시간 캔들 카운트다운 (타임프레임에 따라 mm:ss 또는 hh:mm:ss) 3가지 표시 위치 가격 레벨 근처(TradingView 스타일) — 현재 가격 레벨 주변에 정렬 우측 상단 고정 — 차트 우측 상단에 고정 표시 스프레드/정보 위(우측 상단) — 스프레드/정보 텍스트와 겹치지 않도록 더 위에 표시 커스터마이징 가능 : 글꼴, 크기, 색상, 접두어(prefix), 여백 및 오프셋 MT5의 모든 종목 / 모든 타임프레임 에서 동작 작동 방식 현재 바(캔들)의 시작 시간과 타임프레임 길이를 이용해, 캔들 종료까지 남은 초를 계산하여 표시합니다.
가격 레벨(TV 스타일
FREE
멀티 타임프레임 지원, 맞춤형 시각 신호 및 구성 가능한 알림 시스템을 갖춘 Average Directional Movement Index(ADX) 지표.
프리랜서 프로그래밍 서비스, 업데이트 및 기타 TrueTL 제품은 제 MQL5 프로필 에서 이용하실 수 있습니다.
피드백과 리뷰를 대환영합니다!
ADX란 무엇인가요? J. Welles Wilder가 개발한 Average Directional Movement Index(ADX)는 방향에 관계없이 추세의 강도를 측정하는 데 사용되는 기술적 지표입니다. ADX는 양의 방향 지표(+DI)와 음의 방향 지표(-DI)로부터 도출되지만, 추세의 방향이 아닌 강도만을 나타냅니다. ADX 값은 0에서 100 사이입니다. 일반적으로 20~25 미만의 값은 약하거나 존재하지 않는 추세(레인지 시장)를 나타내고, 25 이상의 값은 강한 추세를 나타냅니다. 50 이상의 값은 매우 강한 추세를 나타냅니다. ADX는 시장이 추세 중인지 레인지 중인지
FREE

RR Box - Visual Risk-Reward Planning Tool Overview RR Box is a professional-grade risk-reward visualization indicator that helps traders plan and visualize trade setups directly on the chart. With fully draggable, resizable boxes for Stop Loss and multiple Take Profit levels, you can instantly see your risk-reward ratios and adjust them with precision.
Key Features
Drag-and-Drop Flexibility Move your entire trade setup anywhere on the chart. Click any box to select it, then drag corners or ed
FREE

Tired of SMC indicators that clutter your chart with random lines and overlapping boxes, obstructing your view of the price action? The Ultimate SMC Assistant is not just another structure mapping indicator; it is a Smart AI Trader Assistant designed specifically for Smart Money Concepts (SMC) traders and for successfully passing Prop Firm evaluations. The indicator constantly scans the market to detect the freshest and strongest reversal zones, providing you with a professional live dashboard
FREE

이전 버전의 인디케이터 개발 ZigZag WaveSize MT4 ZigZag WaveSize - 표준 ZigZag 인디케이터를 수정하여 포인트, 레벨 및 다양한 경고 로직에 대한 정보 추가
일반적인 개선 사항: MetaTrader 5 코드 적응 그래픽 객체 작업 최적화 새로운 기능: 극점에서의 수평 수준 수준 유형 선택: 수평/광선/세그먼트 유동성 수준 필터 (가격에 의해 돌파되지 않음) 돌파 버퍼: 거짓 돌파에 대한 민감도 설정 레이블 및 기능 설정: 수량, 외관, 오래된 레이블 삭제 구조 돌파 알림 (BoS) 움직임 성격 변경 알림 (ChoCH) 최적화: 극값 업데이트 로직 수정 새로운 객체의 동적 업데이트 바 출현 시 하중 감소 레이블의 중앙 집중 시스템 수정 사항: 배열 범위 초과 수정 레이블의 정확한 위치 지정 중복 파라미터 제거
ZigZag WaveSize 인디케이터를 귀하의 트레이딩 시스템의 보완재로 사용하세요 또한 시장에서의 나의 다른 제품도 시도해 보세요
FREE

The Inside Bar pattern is a very well known candlestick formation used widely by traders all over the world and in any marketplace. This approach is very simple and adds a little confirmation candle, so it adds a third past candlestick to the count to confirm the direction of the move (upward or downward). Obviously, there is no power on this candlestick formation if the trader has no context on what it is happening on the market he/she is operating, so this is not magic, this "radar" is only a
FREE

IMDFIbo는 MetaTrader 5 터미널용 지표로, 과거 데이터를 기반으로 피보나치 레벨 그리드를 자동으로 구축합니다. 이 도구는 가격 차트에서 잠재적인 지지 및 저항 구역을 시각화하도록 설계되었습니다. 작동 원리 이 지표는 지정된 기간 동안의 과거 최고가와 최저가를 분석하고 이를 기반으로 피보나치 레벨을 구축합니다. 이 도구의 특징은 그리드의 재귀적 구축에 있습니다: 각 레벨 사이의 구간은 동일한 원칙에 따라 더 작은 레벨로 추가로 분할될 수 있습니다. 구축은 세 단계로 수행됩니다: 1차 — 지정된 전체 기간의 과거 최고가부터 최저가까지 계산된 레벨. 2차 — 현재 가격이 위치하는 1차 구간 내에 구축된 레벨. 3차 — 현재 가격이 포함된 2차 구간 내에 구축된 레벨. 이러한 접근 방식은 현재 거래되는 차트 영역에서 가격 레벨을 세분화할 수 있게 해줍니다. 지표 설정 이 지표는 다음 매개변수 그룹을 가지고 있습니다: 패널 디자인. 차트에서 제어 패널의 너비와
FREE

Anchored VWAP + EMA(9) Bias Engine with Clean Entry & Exit Signals Elohim FX – VWAP EMA Crossover is a precision trend-and-bias tool that combines the institutional strength of an Anchored VWAP with a fast EMA(9) to define market direction, then delivers clean, bias-gated entry and exit signals — all on closed-bar confirmation so you never chase a repainting signal. No clutter. No bands. No noise. Just two lines, one bias, and clearly defined arrows. How It Works The indicator is built around a
FREE

Trading in volatile markets often creates uncertainty between genuine trend continuation and false breakouts.
When price moves quickly, monitoring multiple standard deviation bands manually can clutter execution timing.
Double Bollinger Bands Channel Alert provides a structured two-band framework to identify trend momentum zones and pullback continuation levels with clarity. What it shows:
Outer Bands (Deviation 2.0) = Volatility boundaries highlighting strong trend expansion.
Inner Bands (Devi
FREE
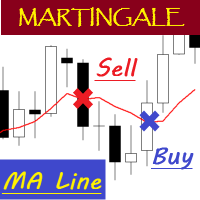
EA "MA Line" with martingale feature
To see how EA works, please watch the video below. In the video, I perform parameter optimization and do a backtest. The parameters that are optimized are: - MA Period - Stop Loss - Take Profit
For the future, I will try to optimize and test EA, especially the expert advisors in the mql5 community. hopefully it can be useful for colleagues in the mql5 community.
FREE

GoldTrendCorrectionRunner는 XAUUSD 거래를 위한 자동화된 전문가 자문 프로그램으로, 구조화된 추세 및 추동 단계만을 거래합니다.
이 EA는 조정 기반 접근 방식을 따릅니다:
진행 중인 움직임에 바로 진입하기보다는, 시스템은 시장 조정을 기다린 후 추세 지속이 확인된 후에야 포지션을 개설합니다. 이를 통해 과도하게 확장된 시장 단계에서 흔히 발생하는 진입 오류를 방지합니다.
거래 논리
더 높은 시간대의 EMA 구조를 통한 추세 편향
ADX 필터를 통한 최소 추세 강도
M15 조정 및 추세 방향 재돌파 후 진입
뉴 바 로직 (틱 기반 진입 없음)
스탑로스 & 리스크
스탑로스는 가장 강한 M15 조정점(스윙 하이/스윙 로우)에 배치
고정 포인트 SL이 아닌 시장 기반
거래당 USD 기준 엄격한 손실 제한
→ 스탑 로스에서 최대 손실을 초과하지 않도록 랏 크기를 계산
→ 최소 랏 크기로 인해 불가능할 경우 거래를 시작하지 않음
거래 관리
러너
FREE

FTU Qqe for MT5
Qs indicator for mt5 draws objects as arrows which is fine for manual trading but not reliable for EA/Algo Many arrow changes at certain times, so best to filter the signals using minimum one concept/logic Essentially an Rsi and moving average indicator - draws an arrow for suggestion of entry or change in trend The indicator is for MT5 platform, can be used stand alone >> best combined with other indicators and strategies New stable version coming soon
Indicator Features: Sel
FREE

TradeVisonPro Forex Analyzer Pro MT5 거래 계좌 분석 및 모니터링 대시보드 TradeVisonPro Forex Analyzer Pro는 MetaTrader 5 사용자를 위해 설계된 거래 분석 및 계좌 모니터링 솔루션입니다. 본 제품은 MT5 거래 데이터를 구조화된 웹 기반 대시보드에 정리하여 사용자가 계좌 정보를 확인하고, 오픈 포지션을 모니터링하고, 거래 내역을 분석하고, 전략을 추적하고, 거래 일지를 작성하고, 성과 통계를 검토할 수 있도록 합니다. TradeVisonPro Forex Analyzer Pro는 거래 정보를 체계적으로 관리하고 지원되는 데스크톱 및 모바일 웹 브라우저를 통해 접근할 수 있도록 설계되었습니다. 주요 기능 • MT5 계좌 대시보드
• 오픈 포지션 모니터링
• 거래 내역 분석
• 거래 캘린더
• 전략 추적
• 거래 일지
• 계좌 성과 통계
• 성과 보고서
• 거래 알림
• 다중 계좌 지원
• 공유 가능한 읽기 전용 보고서 MT
FREE

BB Stochastic Pro는 볼린저 밴드와 스토캐스틱 오실레이터를 결합하여 가격 극값과 모멘텀 전환점 주변에서 진입 시점을 잡는 MetaTrader 5용 익스퍼트 어드바이저입니다.
볼린저 밴드는 가격이 평균에서 얼마나 벗어나 있는지를 식별하며, 스토캐스틱 필터는 EA가 포지션을 열기 전에 과매수/과매도 상태를 확인하는 데 도움이 됩니다.
주요 특징: - 롱 및 숏 설정 모두를 위한 이중 지표 진입 로직(볼린저 밴드 + 스토캐스틱). - 설정 가능한 랏 사이징: 고정 랏 모드와 계좌 잔액을 기반으로 포지션 크기를 정하는 리스크 기반 모드. - 손실 거래 후 더 빠른 회복을 시도하기 위해 포지션 크기를 늘리는 선택적 배수 기반 랏 모드(마틴게일 방식). 이 모드는 리스크가 더 높으며 연속 손실 중 더 큰 드로다운을 발생시킬 수 있습니다; 기본적으로 비활성화되어 있으며 리스크를 이해하는 숙련된 사용자만 활성화해야 합니다. - 내장된 마진 기반 랏 제한으로, 포지션 크기가 계좌 마
FREE
This EA has no stop loss. All risks are at your discretion.
CHIQUITA MT5 EA is a fully automatic Expert Advisor for Scalping Trading on XAUUSD timeframe M1. The basic strategy starts with Market order in Trend Following, so this EA Follow the Trend . M1 Trend…. very very fast. MT4 version Recommendations The Expert is programmed to work on XAUUSD M1, but you can use all others timeframes with the appropriate settings. An ECN broker is always recommended A low latency VPS is alwa
FREE

AI News-Safe Session Trader AI News-Safe Session Trader is an EMA-crossover trend EA built with capital protection in mind. It trades only during normal market session hours and automatically stands aside around your configured high-impact news release times, avoiding the erratic spikes and slippage that often occur during news events. How it works The EA watches for a crossover between a fast and slow EMA (default 20/60). When the fast EMA crosses above the slow EMA it looks to buy; when it cro
FREE

THE BRAIN SMC ULTIMATE "Trade Like an Institution, Analyze Like a Professional" Are you tired of cluttered charts, lagging indicators, and conflicting signals? Welcome to the era of Clean Trading.
The Brain SMC Ultimate is engineered for traders who prioritize visual clarity without sacrificing data accuracy. Utilizing the latest Smart Money Concepts (SMC) algorithms, this indicator maps institutional footprints directly onto your MetaTrader 5 chart.
CORE PREMIUM FEATURES Smart Entry Guidan
FREE

당신만의 전략 구축 이 도구를 사용하면 MetaTrader에서 기본으로 제공되는 모든 지표 및 인터넷에서 다운로드한 모든 지표를 사용하여 전략을 개발할 수 있습니다. 이 도구를 사용하면 MetaTrader를 고려하여 거래 전략을 자동화할 더 이유가 됩니다. 이 도구를 사용하면 MetaTrader의 어떤 지표든 사용하여 간단하고 직관적으로 자신의 전략 신호를 만들 수 있습니다. 인터넷에서 다운로드한 지표가 버퍼를 사용하는지 어떻게 알 수 있을까요? 간단합니다. 이 도구를 실행하기만 하면 모든 지표가 가지고 있는 버퍼를 자동으로 찾아내어 해당 버퍼를 기반으로 전략을 만들 수 있게 해줍니다. 이 도구는 자동으로 지표가 버퍼를 가지고 있는지와 버퍼가 몇 개의 데이터를 가지고 있는지를 식별할 수 있습니다. 버퍼를 올바른 값과 연결하는 일만 하면 됩니다. 이러한 지표는 이미 통합 버퍼를 가지고 있기 때문에 이러한 원천 MetaTrader 지표인 이동 평균, RSI, 스토캐스틱, MACD 등은
FREE

The “Color Filled MACD” indicator is based on the classic Moving Average Convergence Divergence indicator created by Gerald Appel (in the 1970s) and later improved by Thomas Aspray (in the 1980s), in this case for MQL5. It is part of the standard technical analysis library. In this case, the native MQL5 code was used as a basis, and customizable colors were added so that users can choose them for the histogram, the moving averages, and the spaces between them. The goal is to make the indicator
FREE

QCL Dynamic RSI Zones — MetaTrader 5 QCL Dynamic RSI Zones combines a smoothed RSI signal with adaptive boundaries to help you assess momentum in the context of recent market conditions. Instead of relying on fixed overbought and oversold levels, the indicator adjusts its zones using recent RSI behavior. A dynamic balance line, a color-changing signal, and excursion columns provide a clear view of momentum shifts in a separate chart window. Key Features Adaptive zones: Upper and lower boundaries
FREE

Voltra IMPORTANT! After purchase, please send me a private message on MQL5 — I will provide the installation guide, recommended settings, and help you with the initial setup of the Expert Advisor. Voltra is a trading Expert Advisor for MetaTrader 5 based on a counter-trend price mean-reversion approach. The system is built around a proprietary quantitative first-entry model, an adaptive grid architecture, and integrated multi-level risk control. Voltra’s primary trading style is Counter-Trend
FREE

Accurate Buy Sell System is a clean and reliable swing-based indicator designed to identify trend reversals and entry zones with high precision. The algorithm follows the original “Accurate Swing Trading System” concept from TradingView (by ceyhun) and has been fully re-engineered for MetaTrader 5. 1:1 match with TradingView behavior
Works on all symbols and timeframes
Clean non-repainting signals when used after candle close
Visual BUY/SELL arrows + colored dynamic trendline
Popup ale
FREE

### Indicator Description: Gradient Heiken Ashi with Momentum Coloring
This indicator is a technical analysis tool designed to overlay on the main chart, helping traders easily identify price trends and momentum through modified Heiken Ashi candles. It combines smoothed candle value calculations based on moving averages with a gradient color system to represent the strength of bullish or bearish trends.
#### 1. Key Features
- Display of Modified Heiken Ashi Candles:
- The indicator draws opt
FREE

목적 / 전략
이 전문가 자문가는 나스닥(USTEC)에 대한 RSI 풀백 접근법을 구현하며, S&P 500(US500)과의 상관관계를 시장 필터로 활용합니다. 목표는 기존 추세에서의 풀백을 거래하고 횡보 국면 또는 반대 시장 조건을 피하는 것입니다.
신호 논리 (간단화)
추세 편향 (USTEC): 추세 방향 결정 (예: EMA 또는 가격 구조를 통해)
RSI 풀백: 과도한 확장 후 진입 (RSI가 과매수/과매도에서 반전)
상관성 필터: US500이 동일한 방향을 확인할 때만 거래
진입: 새 캔들 시 시장가 주문
SL / TP: ATR 기반 스탑로스, 고정된 기회-위험 비율 또는 ATR 배수를 통한 테이크 프로핏
리스크 관리 및 실행
거래량 제어: 고정 로트 또는 리스크 기반 (% 지분), 선택적으로 MaxLot 제한 적용
브로커 호환성: 허용된 필링 모드(FOK/IOC/RETURN) 자동 선택, 스탑 레벨 보안 및 볼륨 스텝 정규화
뉴 바 전용: 신호는 캔들 마감
FREE
Next Arrival : Flip or Die Trading Arena. Flip a trading account: https://flipordie.com/chapter-1-thirteen-doublings-double-a-trading-account/ Swing Points Indicator for MetaTrader 5
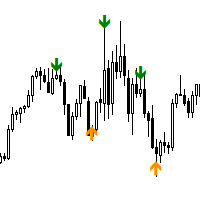
The **Swing Points Indicator** is a custom-built technical tool designed for MetaTrader 5 (MT5), primarily used for identifying crucial reversal points in price action. By plotting swing highs and swing lows, it highlights potential trend reversals, making it a valuable tool for traders relying on price action an
FREE

Join our channel for updates, recommended settings, and live results: https://www.mql5.com/en/channels/goldlovers
Gold Session Breakout Pro is a fully automated Expert Advisor designed and optimized specifically for XAUUSD (Gold), built around structured session breakout logic with clean risk management.
No grid. No martingale. No averaging. Every trade uses a defined Stop Loss, Take Profit, and dynamic Trailing Stop.
Core Trading Logic
The EA builds a price range during a configurable ses
FREE

Zapscalper: Pullback and Spike Scalper with Reversal Protection. Please don't forget to rate and review us. Key features Spike detection. Alligator pullback logic. 200 EMA trend filter. Consolidation filter. Oversized breakout filter. Reversal stop order (optional). Automatic trade management. Flexible lot size. Margin protection. Smart pip detection. Trade controls. History replay and recovery. On-chart panel. Alerts and logs. When Zapscalper does not trade The panel and logs
FREE

Account Protector Pro is a lightweight Expert Advisor that monitors open positions and closes them when they exceed your configured profit or loss thresholds. It includes a daily loss limit that halts trading when triggered. Features Overview The EA provides multiple ways to manage risk at both the trade level and account level. You can use any combination of these features: Per-trade profit and loss thresholds Lot-scaled loss limit that adjusts with position size Daily loss limit that resets ea
FREE

Apex Adaptive Trend Engine Apex Adaptive Trend Engine은 시장 방향을 식별하고, 품질이 낮은 가격 움직임을 필터링하며, 변화하는 시장 환경에 따라 구조화된 트레이딩 신호를 제공하도록 설계된 전문 추세 추종형 트레이딩 시스템입니다. 고정된 파라미터에 의존하는 기존 추세 지표와 달리, 이 시스템은 가격 움직임과 시장 변동성의 변화에 동적으로 대응하도록 설계되었습니다. 이를 통해 방향성이 뚜렷한 움직임에서는 높은 반응성을 유지하면서도, 추세가 약하거나 방향이 명확하지 않은 시장 상황에서는 불필요한 신호를 줄일 수 있습니다. 핵심 개념 시스템은 시장 구조와 추세의 움직임을 평가하여 현재의 주요 방향성 편향을 판단합니다. 기본적인 추세 조건이 시스템의 확인 로직과 일치할 때 트레이딩 신호가 생성됩니다. 목표는 간단합니다: 추세 식별 → 시장 방향 확인 → 셋업 실행 → 포지션 관리 주요 기능 적응형 추세 탐지 추세 엔진은 고정된 추세 기준값에만 의존하
FREE

EA Performance Dashboard: Trading Account Analytics Panel for MT5
A dark, draggable performance dashboard that runs directly on your MT5 chart. It shows balance and equity curves, drawdown, trade statistics, a per-EA (Magic Number) table and prop firm limits (FTMO, FundedNext). It works from your account history, with no DLLs and no external services.
EA Performance Dashboard brings the kind of account analysis you would see on Myfxbook or FXBlue into MetaTrader 5. It analyzes your clo
FREE

Free one-click trade panel for MT5: BUY/SELL on the price line and Breakeven, Partial, Reverse and Close buttons on every position. DESCRIPTION: TrendSync Trade Buttons is a free, lightweight trade panel for manual traders on MetaTrader 5. Open, reduce and close positions straight from the chart, without dialog boxes and without hunting for tickets in the Trade tab. It is an execution tool, not a signal robot . It does not open trades by itself. Every action is yours; it just makes it one click.
FREE
MetaTrader 마켓은 과거 데이터를 이용한 테스트 및 최적화를 위해 무료 데모 거래 로봇을 다운로드할 수 있는 유일한 스토어입니다.
어플리케이션의 개요와 다른 고객의 리뷰를 읽어보시고 터미널에 바로 다운로드하신 다음 구매 전 트레이딩 로봇을 테스트해보시기 바랍니다. 오직 MetaTrader 마켓에서만 무료로 애플리케이션을 테스트할 수 있습니다.
