YouTubeにあるマーケットチュートリアルビデオをご覧ください
ロボットや指標を購入する
仮想ホスティングで
EAを実行
EAを実行
ロボットや指標を購入前にテストする
マーケットで収入を得る
販売のためにプロダクトをプレゼンテーションする方法
MetaTrader 5のための無料のエキスパートアドバイザーとインディケータ - 7

This is a derivative of John Carter's "TTM Squeeze" volatility indicator, as discussed in his book "Mastering the Trade" (chapter 11).
Gray dot on the midline show that the market just entered a squeeze (Bollinger Bands are with in Keltner Channel). This signifies low volatility, market preparing itself for an explosive move (up or down). Blue dot signify "Squeeze release".
Mr.Carter suggests waiting till the first blue after a gray dot, and taking a position in the direction of the mo
FREE

The Candle Countdown Timer for MetaTrader 4 (also available for MT5) is a vital indicator designed to help you manage your trading time effectively. It keeps you updated about market open and close times by displaying the remaining time before the current candle closes and a new one forms. This powerful tool enables you to make well-informed trading decisions. Key Features: Asia Range: Comes with an option to extend the range. Broker Time, New York, London Time: Displays the current broker time
FREE
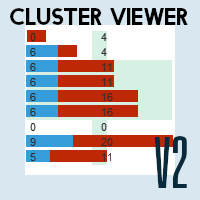
Opportunity! Cluster Viewer V2 is free until April 20th. Enjoy. . Dominate the Market with Accurate Insights: Meet Cluster Viewer V2 for Metatrader 5!
Have you ever wondered how the most successful traders identify the best trading opportunities? With Cluster Viewer V2, you will have access to a comprehensive set of analytical tools designed to provide accurate and in-depth insights into financial markets. Developed for the Metatrader 5 platform, our EA takes your trading strategy to the nex
FREE

Trading Keys is an advanced and easy to use risk calclator. Features: Drag and drop visual lines to take profit/stop loss/ entry levels. Risk calculation based on account balance / quity percentage per trade. Profit protection and trailing toggle button Auto break even toggle button Risk calculation for prop firms based on drawdown level How to setup your Trading Keys? Add trading keys to your chart Setup the parameters Save the chart as default template "Default.tpl" How to use Trading keys? Cl
FREE

市場内で開発傾向にアラートを取得するには、この指標を使用してください。
この指標を使用すると、彼らが開発するように、市場で発展している傾向についてのアラートを取得することができるようになります。 この指標は、トレンド内のエントリまたは終了を識別するために使用できます。 この指標は、より高い時間枠からの情報と、現在の時間枠の価格の動きを組み合わせて、買いまたは売りの信号を出力します。 指標は、傾向の変化、または支配的な傾向の継続を識別することができます。
注:トレンドフォローは低い勝率を持っていますが、トレンドのリターンは平均損失の3-5倍の大きさにすることができます。 簡単なセットアップ 任意の時間枠で、任意のグラフにドラッグアンドドロップします。 アラートを有効にする(オプション) そして、あなたは完了です! 視覚的および音声的な警告 お使いの携帯電話に直接送信されるアラート お使いの端末に送信されたアラートをポップアッ マルチユース 株,外国為替,オプション,先物 柔軟性 任意の時間枠で動作します
FREE

UPDATED The Non-Repaint zones is a time base indicator that scans for possible reversal of the market for perfect entry. It read the history and draws the possible zone for our comfort. The indicator possesses four different zones that read the history of the market over 10,000 previous bars and predict the possible entry point. It rescans every market trend change to give us the possible zone, it is used for trading all types of markets and does not repaint. The indicator has the following inp
FREE

Kono robotto wa idō heikin no kōsa de dōsa shimasu. Idō heikin wa kihontekini torendo o tsuiseki suru tame ni shiyō sa remasu. Idō heikin o kōsa sa seru senryaku wa, ōkina tsuyoki oyobi yowaki no ugoki o riyō suru koto o omona mokuteki to shite imasu. Subete no paramēta wa henshū kanōde tsukai yasuku, koreha jikken-tekina purojekutodesu. Kono robotto o shiyō shite chōsa o jisshi shi, mitsuketa sairyō no jōhō o watashitachi to kyōyū shite kudasai Aurélio Machado.
FREE

このプロジェクトが好きなら、5つ星レビューを残してください。 インスタグラムでフォロー:borelatech 機関が大きなボリュームを取引するので、それらが試してみることは珍しくありません
特定のパーセンテージレベルでポジションを守る これらのレベルは、あなたが使用できる自然なサポートと抵抗として役立ちます
取引を入力するか、ポジションに対する危険性を認識する。 一般的に使用されるパーセンテージの例は、EURUSDの0.25%と0.50%です。
毎週、スクリーンショットでこの例を見ることができます。 このインジケータを使用すると、以下の割合の変動を描画することができます。 日。 週。 月 日 クォーター。 生年月日
FREE

This indicator can send alerts when a Heiken Ashi Smoothed color change occurs. Combined with your own rules and techniques, this indicator will allow you to create (or enhance) your own powerful system. Features Can send all types of alerts. Option to delay the alert one or more bars in order to confirm the color (trend) change. Input parameters Candle shift for alert: Default is 1. Setting it to 0 will alert you on color change on the current candle. This should be regarded as a pending (uncon
FREE

強力なNRTR(Nick Rypock Trailing Reverse)インディケーターをご紹介します。トレンドの反転を特定し、効果的なトレーリングストップレベルを設定することを目指すトレーダーにとって必須のテクニカルツールです。ニック・ライポックによって開発されたこのインディケーターは、常に変化する市場条件に適応する独自のアルゴリズムを採用しており、どんなトレーダーのツールキットにも欠かせない存在となっています。
以下は、トレーダーがこのインディケーターを使用する人気のある方法です:
1. トレンドの反転:NRTRインディケーターは、トレンドが反転する予兆があるときに明確なシグナルを生成します。インディケーターラインが価格チャートを交差することに注意し、トレンドの方向が変わる可能性を示します。
2. トレーリングストップ:NRTRは、トレンド市場で利益を保護する頼りになるトレーリングストップツールとしても機能します。価格が望む方向に動くと、NRTRラインが価格の下または上に動的に追随し、適応可能なストップロスレベルを提供します。
カスタマイズ可能なパラメータ:NR
FREE

The Weis Waves RSJ Indicator sums up volumes in each wave. This is how we receive a bar chart of cumulative volumes of alternating waves. Namely the cumulative volume makes the Weis wave charts unique. It allows comparing the relation of the wave sequence characteristics, such as correspondence of the applied force (expressed in the volume) and received result (the price progress).
If you still have questions, please contact me by direct message: https://www.mql5.com/en/users/robsjunqueira/
FREE

Adaptive Moving Average (AMA) is a trend indicator using moving average and market noise filter. Indicator feature are blue and red points, showing the power of trend. Recommendations for trading: Auxiliary Indicator Detecting trend Detecting power of trend Detecting potential reversal points Main indicator Shows entry points for swing trading Serves as dynamic support and resistance Recommendations for use: Any instrument Any timeframe Input parameters: Period - AMA period Fast Period - fast MA
FREE

NATS (Niguru Automatic Trailing Stop) will help you achieve more profits, by setting the trailing stop automatically. Pair this NATS application with EA, or can also be used as a complement to manual trading.
A trailing stop is a powerful tool in trading that combines risk management and profit optimization.
A trailing stop is a type of market order that sets a stop-loss at a percentage below the market price of an asset, rather than a fixed number. It dynamically adjusts as the asset’s pr
FREE

The Turtle Trading Indicator implements the original Dennis Richards and Bill Eckhart trading system, commonly known as The Turtle Trader. This trend following system relies on breakouts of historical highs and lows to take and close trades: it is the complete opposite to the "buy low and sell high" approach. The main rule is "Trade an N-day breakout and take profits when an M-day high or low is breached (N must me above M)". [ Installation Guide | Update Guide | Troubleshooting | FAQ | All Pr
FREE

制度レベル/銀行レベル...心理レベル/四半期理論。
このインジケーターは、「000、200、500、800」のレベルで自動的に描画します。私が「機関レベル」と呼んでいるものは、チャートに「000、250、500、750」のレベルを描画することもできます。
機関投資家レベルの取引/四半期理論をどこで学んだかに応じて、それらを異なる名前として知っているかもしれません。本質的にコアアイデアは、これらのレベルがほとんどの外国為替市場で強力なサポートとレジスタンスポイントとして機能することです。
グループチャット: https://www.mql5.com/en/users/conorstephenson ご不明な点がございましたら、ご購入後のセットアップ・操作アドバイスをご連絡ください、よろしくお願いします! 主な機能
現在の価格の上下に「000、200、500、800」または「000、250、500、750」の数字で長方形または線を便利に描画します。 アラート機能。 -MT4モバイルアプリを使用して番号に達したときに通知することができます。 カスタマイズ可能な線の
FREE

Another request from my brotherhood was putting the name of the Symbol being seen - a little bigger - on the Chart, just to get sure that they are seeing the correct one... Mistakes pay a high price on the market... It is a very effective, and almost resource-null-consuming indicator that displays the current Symbol Name and Timeframe in almost any position of your Chart, with any color, and any Font Size... And also you can change the divisor character that is presented between the Symbol Name
FREE

This indicator forms a channel based on the readings of the ADX (Average Directional Movement Index) indicator, displays and informs the trader of a price reversal at the boundaries of this channel, and can also report when the price touches the channel boundaries. It also draws additional dotted lines, which depend on the readings of the + DI and -DI of the ADX indicator. It also has an option for filtering signals depending on the readings of the stochastic. The channel drawn by this indicato
FREE
It's a two (2) pairs correlation system to use 3 currencies to make 2 pairs to open hedge orders on those.
The expert starts opening four orders for each couple (2 plus and 2 minus) and wait to move prices in one direction to make a grid of orders.
The expert can use a maximum of 5 currencies to make 10 pairs and make 30 couples.
It is important the order of currencies is from the strongest to the weakest.
Strongest... EUR/GBP/AUD/NZD/USD/CAD/CHF/JPY ...weakest.
Canto inputs minimum o
FREE

Hi-Lo is an indicator whose purpose is to more precisely assist the trends of a given asset - thus indicating the possible best time to buy or sell.
What is Hi-lo?
Hi-Lo is a term derived from English, where Hi is linked to the word High and Lo to the word Low. It is a trend indicator used to assess asset trading in the financial market.
Therefore, its use is given to identify whether a particular asset is showing an upward or downward trend in value. In this way, Hi-Lo Activator can be t
FREE

トレンド分析と取引の洞察のための "Demark Trends Indicator" のパワーを体験してください。 Demark インジケーターは、市場トレンドやエクソースポイントの評価における効果で知られています。当社の "Demark Trends Indicator" は、これらの専門知識をさらに高め、自動的にチャートに正確なトレンドラインを描画します。キャンドルの数、アラーム設定、ラインの色など、カスタマイズ可能なパラメータを使用して、あなたの分析に完全なコントロールを持つことができます。初心者でも経験豊富なトレーダーでも、当社のインジケーターはトレンド分析を簡素化し、時間と労力を節約します。 "Demark Trends Indicator" の潜在能力を開放して: 正確なトレンドの識別: 自動的に描画された正確なトレンドラインで市場トレンドをシームレスに分析します。 効率的な取引戦略: 現在のトレンドの状態を評価し、情報に基づいた取引のための可能なエクソースポイントを予測します。 カスタマイズ可能なパラメータ: キャンドルの数、アラーム設定、ラインの色などを調整して、インジ
FREE

MT4 Version MA Ribbon MT5 MA Ribbon is an enhanced indicator with 8 moving averages of increasing periods. MA Ribbon is useful to recognize trend direction, reversals and continuation points in the market as well as potential entry, partial take profit and exit points. Entry points for long and shorts position can be found when the price entries or leaves the Ribbon, at retest or a defined number of MA crossovers. It offers a good combination with mostly any volume or momentun indicators to
FREE

Hello, Every one
A script to close all market positions and/or pending orders.
-----------------------------------------------------------------------------------
This is Close All market positions and/or pending orders button
You can close all orders in 1 second by one click
For advanced version: Advanced: https://www.mql5.com/en/market/product/77763
https://www.mql5.com/en/market/product/89311 Key:
1 Close all button: The script will close All orders market +
FREE

蓮子はタイムレスなチャートです。つまり、期間は考慮されませんが、価格の変化が考慮されるため、チャート上の価格の変化がより明確になります。
ハイパー蓮子はこれを提供する指標です。
設定するには、使用するティックのろうそくのサイズ*のパラメーターを1つだけ使用します。
* tick:アセットの可能な限り小さなバリエーションです。
Hyper Traderインジケーターをお選びいただきありがとうございます。
ウィキペディア: レンコグラフは、変数の値(金融資産の価格など)の経時的な変化が最小限であることを示しています。グラフは、検討中の値(価格など)が特定の最小数量によって変化する場合にのみ時間とともに進みます。たとえば、資産価格のR $ 1の変動を考慮したレンコチャートでは、変動が発生するのにかかった時間と変動に関係なく、その変動が発生した場合にのみ、新しい「レンガ」が描画されます取引されたボリューム。したがって、横軸に時間、縦軸に価格変動をプロットすると、すべての「レンガ」は同じ高さ(同じ価格変動)を持ち、それらの間の間隔は視覚的に同じであるにもかかわらず、時間の変
FREE

We value your feedback and believe that your experience with the Hull Moving Average (HMA) is essential to us and other traders. Help us continue to improve and refine our product by sharing your thoughts and insights through a review!
The Hull Moving Average (HMA) Indicator – Your Key to Smoother Trends and Profitable Trades! Are you tired of lagging and choppy moving averages that hinder your ability to spot profitable trading opportunities? Look no further! The Hull Moving Average (HMA) is
FREE

ChannelRSI5 買われ過ぎと売られ過ぎのゾーンの動的レベルを示す相対力指数(RSI)指標。
動的レベルは変化し、インジケーターと価格の現在の変化に合わせて調整され、一種のチャネルを表します。
インジケーターの設定 period_RSI-RSIインデックスを計算するための平均期間。 apply_RSI-適用価格。価格定数のいずれかです。PRICE_CLOSE-終値、PRICE_OPEN-始値、PRICE_HIGH-期間の最高価格、PRICE_LOW-期間の最低価格、PRICE_MEDIAN-中央価格(高値+安値) / 2、PRICE_TYPICAL-通常価格(高値+安値+終値)/ 3、PRICE_WEIGHTED-加重平均価格、(高値+安値+終値+終値)/ 4。
period_channel-買われ過ぎゾーンと売られ過ぎゾーンの動的チャネルの計算期間。
FREE

The TRIXs Indicator is the combination of the TRIX (Triple Exponential Moving Average) indicator with the addition of a SMA (Simple Moving Average) signal. It provides signs of trend continuity and the start of a new trend.
The entry and exit points of operations occur when the indicator curves cross.
It performs better when combined with other indicators.
FREE
Indicator that synchronizes the charts, that is, when the symbol is replaced in one of the charts, all those that appear with the synchronized indicator are changed, with the same timeframe (Same_Timeframe = true) or with different timeframes (Same_Timeframe = false). The graphics to be synchronized are identified by color (Label).
To synchronize the indicators, the indicator must be inserted in all the charts to be synchronized, using the same color (Label).
A box with the chosen color (La
FREE

The Expert advisor was created based on ORDER BLOCKS AND SMART MONEY CONCEPTS and Pit floor trading strategies. TRADING SETTINGS: Working Time frame : Current to 1 Month i recommend trading from 1Hr to Daily time frames as lower time frames are more prone to markets noise Stop loss : Use this to set your stop loss per trade taken Take Profit : Us
FREE
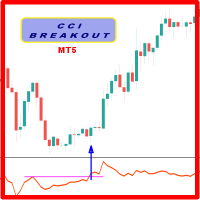
Probability emerges to record higher prices when oscillator breaks out oscillator historical resistance level when exhibit overbought values. Since, oscillator breakout of support and resistance have similar effect as price breaks support and resistance levels, therefore, its highly advised to confirm price breakout with oscillator breakout; certainly, will have the same output in short trades. Concept is based on find swing levels which based on number of bars by each side of peak or trough -
FREE

This is a simple trend strenght indicator that is based on 5 moving averages on five diferente timeframes. As for now, the end user has no access to the SMA configurations but ill implement that on the future.
This indicator has 7 diferents trend indexes they are. Strong bearish, bearish, slighly bearish, normal, slighly bullish, bullish and strong bullish. You can change the gauge colors to better fit your taste and the chart background.
FREE

Setup Tabajara was created by a Brazilian trader known as "The OGRO of Wall Street" .
The idea of this setup is to indicate to the trader the current trend of prices and the type of operation should be looked for in the graph.
Operation
It does this through the relation of the closing price position and the of 20 periods, by painting the candles in 4 possible colors : Green -> Price rising in upward trend (Search entry points for PURCHASE) Black -> Price correcting in Bullish Trend
FREE

TradeInfo is a utility indicator which displays the most important information of the current account and position.
Displayed information: Information about the current account (Balance, Equity, Free Margin). Current spread, current drawdown (DD), planned profit, expected losses, etc. Number of open position(s), volume (LOT), profit. Today’s and yesterday’s range. Remaining time to the next candle. Last day profit information. MagicNumber filter. Comment filter.
Indicator parameters: Show
FREE

About CrashBoom Stones is an expert advisor utility that gives you a signal to catch CrashBoom drops or spikes. It shows you a Red Sell arrow on Crash to sell, and a blue arrow on Boom to buy. It also gives you an alert when an arrow is shown. Note:
The utility does not show signals for the historical data in live mode, use the strategy tester to test this utility. The arrows shown are independent to the trends pane. The trends pane is more accurate when H1 and M30 agree.
Recommendations
FREE

Show Pip Value and Spread on Chart as Object or Comment. User can select to display Pip Value and/or Spread by object on main Chart, or show both only as Comment lines on chart. Object Color, Font face and Size and also which corner to show, may change by user. Pip Value calculated in accordance of input Lot size , Default is 1 lot . Can use at all currency pairs , Gold , Silver and most other charts.
FREE

The MACD 2 Line Indicator is a powerful, upgraded version of the classic Moving Average Convergence Divergence (MACD) indicator.
This tool is the embodiment of versatility and functionality, capable of delivering comprehensive market insights to both beginner and advanced traders. The MACD 2 Line Indicator for MQL4 offers a dynamic perspective of market momentum and direction, through clear, visually compelling charts and real-time analysis.
Metatrader4 Version | How-to Install Product | How
FREE

Combination of Ichimoku and Super Trend indicators. 1. ARC (Average Range times Constant) The concept of ARC or Volatility System was introduced by Welles Wilder Jr. in his 1978 book, New Concepts in Technical Trading Systems . It has since been adapted and modified into the popular Super Trend indicator.
The fundamental idea behind ARC is simple: to identify support and resistance levels, you multiply a constant with the Average True Range (ATR) . Then, you either subtract or add the resultin
FREE

Description: Strategy based around Open-Close Crossovers. Setup: I have generally found that setting the strategy resolution to 3-4x that of the chart you are viewing tends to yield the best results, regardless of which MA option you may choose (if any) BUT can cause a lot of false positives - be aware of this. Don't aim for perfection. Just aim to get a reasonably snug fit with the O-C band, with good runs of green && red. Option to either use basic open && close series data or pick your pois
FREE
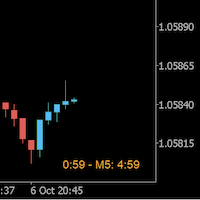
Always wanted to know when the M5 candle closes when you are in M1 ? This indicator allow to display a candle timer (countdown) on the current time frame as well as any higher time frame you have configured for this time frame. So this is easy now to see when the H4 candle closes when you are in H1.
Congifuration Label position, size, color HFT time frame per time frame Any questions or comments, send me a direct message here https://www.mql5.com/en/users/mvonline
FREE

This indicator uses the Zigzag indicator to identify swing highs and swing lows in the price chart. Once it has identified the swing highs and swing lows, it can use them to determine potential support and resistance levels. A support level is formed when the price drops and bounces back up from a swing low, indicating that there is buying pressure at that level. A resistance level is formed when the price rises and reverses downward from a swing high, suggesting selling pressure at that level.
FREE

Fully automatic trading system that trades Renko bars and trend indicators. Renko bars are drawn in the indicator window below the chart. The signal to sell or buy is the intersection of renko and indicator signal. The default settings for the euro / dollar pair, t he EA has shown the best results for the pair GBPJPY and GOLD . The timeframe for trading is m1. There is a time filter. The EA has an autolot system. Our telegram channel After installing the EA, download the installation set
FREE

Trade easily from the chart with CAP Trade Pad EA . It handles risk management for you and can perform several useful tasks with your existing trades. Trade easily from the chart Trade with precise risk management hassle free Set your desired stop loss and take profit levels Close all existing trades with a single click Delete all pending orders with a single click Reap partial profits with a single click It has no input parameters
How to Use Please Read this blog - Details Information in o
FREE
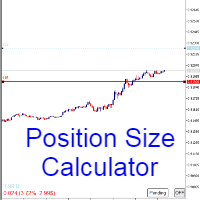
Calculating the volume of orders every time you create an order is an extremely important thing in risk management Let this tool simplify your work! ----------------------------------------------------- How to use? Attach the indicator to the chart and set its parameters: Risk size in % or money and Risk Reward Ratio. Click on the ON button and locate the horizontal line to your would-be StopLoss level. Options: Click on the Pending/Instant button to locate the horizontal line to your would-b
FREE

Easy ICT SP500 is an Expert Advisor meticulously crafted to execute trading strategies based on the simplified ICT Bullet Strategy, incorporating Fair Value Gap analysis for precise position entries. Tailored specifically for the SP500, this EA aims to provide traders with a reliable and optimized tool for navigating the dynamic landscape of the stock market. Distinguished Strategy: this EA distinguishes itself by employing a sophisticated yet simplified version of the ICT Bullet Strategy, stra
FREE

This indicator displays buy or sell signals according to Bill Williams' definition of the Trading Zone. [ Installation Guide | Update Guide | Troubleshooting | FAQ | All Products ] Easy to use and understand Avoid trading flat markets Deterministic indicator with clear rules The indicator is non-repainting It implements alerts of all kinds It has straightforward trading implications. A blue arrow is a buy signal A red arrow is a sell signal According to Bill Williams trading in the zone helps t
FREE
これは、外国為替ペア、株価指数、個別株、債券、およびいくつかの商品を含むほとんどの市場で取引できる、高い勝率の平均回帰戦略です。 このエキスパートアドバイザーは、堅牢で機能することが実証された取引原則と統計ルールに基づいて構築されており、BS はありません。 ターゲット市場に合わせて Expert Advisor をバックテストして最適化します。 相関関係のない複数の市場で EA を実行し、より優れた分散ポートフォリオと信頼性の高いパフォーマンスとリターンを実現します。 取引市場の最適化とバックテストの結果に基づいて、最も可能性の高い結果の予測シミュレーション テストを実行します。 希望するドローダウンとパフォーマンスに合わせて取引ごとのリスクを設定し、それに応じてライブ戦略で取引ロットサイズを設定します。 あなたがリスクを調整するためにこの部分に注意を払い、相関関係のない商品の小さなバスケットで戦略を取引する場合、統計的な可能性をすべて自分に有利に置くことになります。 製品が気に入ったら、レビューを書いてください。
これは経済的なアドバイスではなく、教育と娯楽のみを目的としてい
FREE

Exp5-COPYLOT MASTERは、МetaТrader5とMetaTrader4のトレードコピー機です。任意のアカウントから外国為替取引をコピーします。 インストール このエキスパートアドバイザーはマスターコピー機です。トレードをコピーしたいターミナルにエキスパートアドバイザーをインストールします。 「COPY」のように、任意のテキストラベル名をpathWriteとして指定します。 トレードをコピーしたい端末にMT5用のCOPYLOTMASTERをインストールします。 次に、コピー先の MT4 端末にCOPYLOTクライアントMT4をインストールします。 または MetaTrader5用の CopylotクライアントMT5
MT4用のCOPYLOTMASTERを ダウンロードすることもできます COPYLOT-完全な説明とマニュアル PDFガイド 注:設定のリストは[コメント]タブにあります。 EAは1チャートに設定する必要があります!デフォルトでは、アドバイザーがアカウントからすべてのポジションと注文をコピーします。 注文はアクティベーション時にコピーされ(ポジション)
FREE

Presentation
Another indicator that makes scalping on tick charts easier, it displays an Heiken Ashi graph in Ticks.
It allows to detect entry points and trend reversals. Recommended number of ticks in a candle : 5, 13 or 21.
Parameters Ticks in candle: Number of ticks in a candle (default 5), Displays Trend arrows : displays a trend arrow based on EMA8 and EMA20 crossing, Displays MM50, Displays MM100, Max Candle (CPU): number of candles max to manage, low value will save ressources of
FREE

This indicator is designed to detect high probability reversal patterns: Double Tops/Bottoms with fake breakouts . This is the FREE version of the indicator: https://www.mql5.com/en/market/product/29957 The free version works only on EURUSD and GBPUSD! Double top and bottom patterns are chart patterns that occur when the trading instrument moves in a similar pattern to the letter "W" (double bottom) or "M" (double top). The patterns usually occur at the end of a trend and are used to signal tren
FREE

親愛なる友人、ご清聴ありがとうございました。 異なる通貨ペアの動きが相互に関連していることを観察したい場合は、インジケーター Visual Correlation に注目してください。 異なる通貨ペアの動きは相互に関連しています。 Visual Correlation インジケーターを使用すると、スケールを維持しながら 1 つのチャート上にさまざまな金融商品を表示できます。 正の相関、負の相関、または相関なしを定義できます。
親愛なる友人、あなたは、いくつかの楽器が他の楽器よりも先に動くことをご存知でしょう。 このような瞬間は、グラフを重ね合わせることで判断できます。
親愛なる友人へ、チャート上に商品を表示するには、Symbol フィールドに商品名を入力する必要があります。
Version for MT4 https://www.mql5.com/ja/market/product/33063
FREE

**Introduction:** Welcome to AlgoMania Pro Scalper, a powerful Expert Advisor designed for traders seeking automated trading solutions. This EA employs a sophisticated martingale strategy to capitalize on market fluctuations and generate potential profits. It's important to note that trading in the Forex market involves risks, particularly when using martingale strategies. Therefore, it is crucial to exercise caution and adhere to sound money management principles.
--- The EA is gonna be free
FREE

T he most Flexible & Reliable Trend-Based Fibonacci indicator by Safe Trading. This indicator helps you calculate Trend-Based Fibonacci levels base on the main and retracement trends to predict future price . If you just looking for a simple Fibonacci Retracement indicator, please use this Free indicator .
### FEATURES ### Auto-calculate up to 7 Trend-Based Fibonacci levels on adjustable frame. Adjust Fibonacci levels as your need. Adjust the start and the end of calculated frame
FREE

PreCogniTrade : Un Indicador Técnico Avanzado para Predecir el Mercado (Fase Beta) El PreCogniTrade es un indicador técnico revolucionario diseñado para los traders que buscan una ventaja competitiva en los mercados financieros. Este indicador no solo analiza las tendencias actuales, sino que también predice los movimientos futuros de los precios con una precisión asombrosa, lo que lo convierte en una herramienta de incalculable valor para cualquier estrategia de trading. Características Pr
FREE
Active Symbol is a tool that works together with our Trade Panel. Since version 1.2 our panel can manage multiple symbols without having to open it in all of them, just one. This tool make this possible, because with it the actual or remote symbol information are saved for our Trade Panel to use. Remember to enable the panel control mode in the all symbols function. If you have some problemas with the shortcut buttons on chart on unpinned mode of Trade Panel try change the tickets digits option.
FREE

Daily session open lines shows the traders three important trading session opens. By default it is set up to show you: Zero GMT Open Line London Open Session Line New York Open Session Line The default times are set according to GMT+2 and as such you are able to change and customise according to your specific time zone. The Indicator is usefull specially for the trader who trades the London and NewYork sessions.
FREE

** This is the short version of Symbol Changer . You might want to refer to full version with further features. Symbol Chart Changer is an indicator/utility that offers you the option to switch between symbols and timeframes. You can choose any symbol and timeframe on the same chart with just a few clicks. In addition, this indicator also shows the profit of the symbol through the color of the buttons. For MT4: Symbol Chart Changer Features
All symbols selected in MarketWatch, that allow y
FREE

Gold TL MTF - this is a fine stock technical indicator. The indicator algorithm analyzes the movement of the asset price and reflects trend lines along the fractals of a specific timeframe (TF).
Benefits of the indicator: The indicator produces signals with high accuracy. The confirmed signal of the indicator does not disappear and is not redrawn. You can trade on the MetaTrader 5 trading platform of any broker. You can trade any assets (currencies, metals, cryptocurrencies, stocks, indices
FREE

The Weis Wave first takes the market volume and then organizes it with the price into Wave charts. It is the only software that will present the true picture of the market before you. If anyone of you, has watched an intraday price movement then you must know that it unfolds in a series of selling as well as buying waves-a procedures tearing down and building up. Wave analysis is an integral part of the trading method. The indicator helps to deal with today’s volatile market. Moreover, it works
FREE

Book Map Order Flow shows the price and volume, processing the DOM. See the volume in a better way. See the support and resistance and the possibility of breakouts of them. Input up to 20 price levels to see where the volume is trading and what side. The indicator was made from an EA by denkir but it needed include files to work so I developed and indictor from this out of MQL5 how to cookbook article here: https://www.mql5.com/en/articles/1793 . It can be an easy and valuable tool for all.
FREE

Demand and supply zones Support and Resistance areas Show broken zones Show tested and untested zones Show weak zones Fractal factors Notifications when price reaches point of Interest with Push notifications and pop ups Customizable History Clickable Works on all Timeframes Works on all pairs.
Free for a while till further notice and changes. The demand and supply bot coming soon
FREE

JCAutoFibonacci 简繁自动绘制斐波那契 1.Zigzag3浪,大中小三浪分别代表市场潮流、趋势、涟漪,以不同参数实现。 使用自定义函数获取三浪高低点,以最近高低点作为绘制价格与时间。 2.Fibonacci,黄金分割线,水平线比例0、0.236、0.318、0.50、0.618、1.0、1.236、1.382、1.50、1.618、2.0等。 斐波那契返驰理论包括:反弹/回调现象、反转现象。合理绘制Fibonacci获取市场有效SR。分别绘制三浪。 3.自定义Fibo颜色,自定义水平线比例(0为不显示),自定义水平线颜色,自定义可选择,自定义右射。 备注:如遇使用问题,请联系邮箱:16692618587@163.com
FREE

This EA trades using the RSI Indicator. It offers many trading scenarios and flexible position management settings, plus many useful features like customizable trading sessions, a martingale and inverse martingale mode. [ Installation Guide | Update Guide | Troubleshooting | FAQ | All Products ] Easy to use and supervise It implements three different entry strategies Customizable break-even, SL, TP and trailing-stop Works for ECN/Non-ECN brokers Works for 2-3-4-5 digit symbols Trading can be NF
FREE

Forex Trade Manager MT5 simplifies managing open orders in MetaTrader 5. If you open a new order, the manager automatically sets Stop Loss and Take Profit. When price will move, then the program could move Stop Loss to Break Even (stop loss = open price) or continuously moving Stop Loss (Trailing Stop) to protect your profits. Forex Trading Manager is able to control orders for only current symbols (where EA works) or for all opened orders (regardless symbol) and hide the Stop Loss and Take Prof
FREE
The Expert Advisor (EA) is based on the Dynamic Linear Regression indicator ( https://www.mql5.com/en/market/product/49702 ).
User inputs: Number of candles is considered when calculating linear regression; Distance to the top line; Distance to the bottom line; Stop the loss of. The EA executes purchase and sale orders in the market when the value of a line, higher or lower, is reached at the current price, when the lower line is reached, a buy order at market is executed and when the upper l
FREE

The DTradeView tool is an indicator designed to visualize the position and its information, such as Reward to risk ratio, Risk percent, Profit, Target and stop-loss and recalculate the Reward to Risk ratio and Risk% in real time on the chart . This tool useful in your trading journal. you can take screenshot of your position, entry, target and stop-loss so you have a visual representation of the trade then you can save it in the journal. And you can visualize EA's trade with associated risks and
FREE
Trading has never been easier! Let's check this out! MT4 version: https://www.mql5.com/en/market/product/72153 Strategy There are some news within a day that can make the price jumps up or down very quickly and that is a good opportunity for traders to get some profits. Looking to scalp a news release? Here's how you can do it: Open two stop orders (a buy stop and a sell stop) 3 to 5 minutes before the news release. Place them about 15 to 20 pips away from the current market price. When the ne
FREE

マーチンゲール。 Parabolicumは複数通貨のエキスパートアドバイザーです。同時に10の通貨ペアをテストすることが可能です。 作業記号:EURUSD、GBPUSD、USDCAD、EURCAD、CADCHF、USDCHF、AUDCAD、AUDCHF、EURCHF、EURGBP 時間枠H1 最低保証金:$ 1000(最低ロット0.01) 最低推奨保証金:$ 10000 推奨ロットステップ0.01 ヘッジ口座の種類 テスト時に重要: 時間とリソースを節約するために、「1分OHLC」シミュレーションモードを選択することをお勧めします。 適切な設定オプションを選択した後、「すべてのティック」モードで結果を確認します。 入力オプションの1つ (ブローカー:「Roboforex」) - Parabolicum_Risk4.set エキスパート機能: 取引の場合、エキスパートアドバイザーは任意の時間枠の任意の1つのチャートにのみインストールされます。専門家は 入力パラメーターとH1時間枠で指定された通貨ペア。 重要:ブローカーがペアに別の名前を付けている場合(サフィックスまたはプレフィ
FREE
Use this expert advisor whose strategy is essentially based on Bollinger bands as well as a personal touch.
Other free expert advisors are available in my personal space as well as signals, do not hesitate to visit and leave a comment, it will make me happy and will make me want to offer content. Expert advisors currently available: LVL Creator LVL Creator Pro LVL RSI mt5
If you want to get a configuration file to improve your experience, leave a comment on this robot, then contact me by di
FREE

Are you tired of drawing trendlines every time you're analyzing charts? Or perhaps you would like more consistency in your technical analysis. Then this is for you. This indicator will draw trend lines automatically when dropped on a chart. How it works Works similar to standard deviation channel found on mt4 and mt5. It has 2 parameters: 1. Starting Bar 2. Number of bars for calculation The starting bar is the bar which drawing of the trend lines will begin, while the number of bars for c
FREE

El indicador técnico Trend Magic es una herramienta de análisis de tendencias que combina el Índice de Canal de Mercancía (CCI) y el Rango Verdadero Medio (ATR) para identificar la dirección de la tendencia del mercado. Aquí tienes un resumen de sus pros y contras, así como las mejores condiciones del mercado para su uso:
Pros: - Identificación clara de la tendencia: Cambia de color para indicar tendencias alcistas (azul) y bajistas (rojo), lo que facilita la visualización de la dirección del
FREE

Welcome to the presentation of the AI Channel indicator, a powerful tool that uses artificial intelligence for price channel analysis in the financial market. In this session, we will explore how this revolutionary indicator can assist investors and traders in making more informed and strategic decisions. Let's get started! I. What is the AI Channel indicator? AI Channel is an indicator developed based on advanced artificial intelligence algorithms. It utilizes historical price data of financial
FREE
MetaTraderマーケットはMetaTraderプラットフォームのためのアプリを購入するための便利で安全な場所を提供します。エキスパートアドバイザーとインディケータをストラテジーテスターの中でテストするためにターミナルから無料のデモバージョンをダウンロードしてください。
パフォーマンスをモニターするためにいろいろなモードでアプリをテストし、MQL5.community支払いシステムを使ってお望みのプロダクトの支払いをしてください。
取引の機会を逃しています。
- 無料取引アプリ
- 8千を超えるシグナルをコピー
- 金融ニュースで金融マーケットを探索
新規登録
ログイン