YouTubeにあるマーケットチュートリアルビデオをご覧ください
ロボットや指標を購入する
仮想ホスティングで
EAを実行
EAを実行
ロボットや指標を購入前にテストする
マーケットで収入を得る
販売のためにプロダクトをプレゼンテーションする方法
MetaTrader 4のためのエキスパートアドバイザーとインディケータ - 206

Dunia Maya is an expert advisor developed from my experience in manual trading that has been automated. Dunia Maya is specifically designed to generate maximum profits with small deposits by prioritizing the security of your funds. Why Dunia Maya?
Dunia Maya does not require complicated settings and is easy to use because user only need to upload a set file that is already available. Currently there are set files for 20 fx pairs. The best GRID EA with the ability to control risks. I will sha

超級剝頭皮系統 (Super Golden System)
短線交易的系統
超快速進出場獲取利潤
系統自帶提示功能
自動分析出場位置
系統介紹:
由Jasonforex團隊編寫的價格判斷系統 , 分析當前週期趨勢方向,並結合Parabolic SAR 中短期指標技術,確認明確的反轉位置 , 及推薦出場位置 , 形成高勝率的短線交易模式 ,超級 剝頭皮系統在符合進場條件時,會在MT4上即時通知提示,提醒最佳的短線交易機會。
進出場設定位置:
買單(BUY)
TP(止盈價位): 箭頭或提示訊息出現,當前價位 + GoldenK-TP * 自定義倍數
SL(止損價位): 當前價位 - GoldenK-TP * 自定義倍數
賣單(SELL)
TP(止盈價位): 箭頭或提示訊息出現,當前價位 - GoldenK-TP * 自定義倍數
SL(止損價位): 當前價位 + GoldenK-TP * 自定義倍數
參數設定: 1. ShowArrows: 買單及賣單箭頭訊號提示
2. alertsOn: 所有通知訊息總開關(Message訊息/Soun
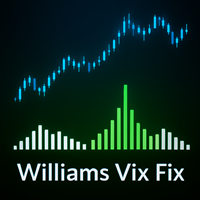
MT5 Version
Williams Vix Fix MT4 Need help trying to time the bottoms in the market? Williams Vix Fix MT4 is based on the volatility of the market and grants a huge support for finding out when a correction is comming to its end. TRY IT FOR FREE NOW! Williams Vix Fix MT4 derivates from Larry Williams's VixFix indicator addapted for fitting every asset class . VIX reprensents the fear and greed in the market based on its volatility. A high VIX value shows fear in the market, this is usually a

Super Signals Channel Indicator
Its channel is a non-repaint indicator that reacts more with recent price movements. For this reason, the Super Signals Channel Indicator is a better match for short-term or day trading strategy. The Super Signals Channel only plots swing trading opportunities. So most of its trade signals appear during consolidation or sidelined periods of the market. Super Signals Channel Indicator for MT4 Explanation The green band below the price shows the dynamic support le

Qv² Stdev is indicator developed based on standard deviation of prices and trading volume.
Buy signals are indicated by arrows up.
Sell signals are indicated by arrows down.
An important detail is that the Qv² Volume has two bands, an upper and a lower, both of which serve as a target for take profit.
It is recommended to use it in H1
Can be used in all pairs (I use in Gold).
Good Business, in the trending market To find out some more about my work please click here

A fully automated Expert Advisor using a set of trading algorithms. Designed for trading major currency pairs, it has protection against failures - when reconnecting, the adviser will continue to work with its orders. The robot controls the volume of trading positions, slippage, spread, maintains and protects open orders, can work with deposits of any size. The adviser uses a number of unique authoring developments that have been successfully tested on real trading accounts. The EA can be used

あなたが常に新しいトレーディングロボットを探していて、Forexアドバイザーを長い間購入したいのであれば、このトレーディングロボットはあなたにぴったりです。それは初心者と専門家の両方のほとんどのトレーダーの要件を満たすことができます。私は自分自身と注文の両方でトレーディングロボットを開発してきた長年の経験があり、私が話していることを理解しています。あなたは私のプロフィールで私についての情報を見つけることができます。
ギフトを受け取りたい場合は、購入後に私に書いてください!
専門家の主な利点:
1つのトレーディングロボットでの多くのトレーディング戦略。
市場が変化し、この戦略またはその戦略が機能しなくなった後でも、他のロボットの購入にお金を費やす必要はなくなります。希望する戦略がまだロボットにない場合は、私に書いてください。それが有望である場合は、アドバイザーに追加します。トレーディング戦略のリスト、将来の変更、およびパラメーターの完全な説明は、ここにあり ます 。
スキャルピング、マーチンゲール、グリッド取引。
1つの注文または注文のグリッドのみで取引を設定できます

GBPJPY Master The Expert Advisor tool has been developed for GBPJPY 1H based on BollingerBands indicator, SMA and pending orders. It has been backtested on more than 18-year long tick data with 99% quality of modeling. The enclosed screenshots demonstrate the complexity and coverage of the test by Monte Carlo analysis with 200 simulation. A broker with a small spread and slippage is recommended for better performance. There is no need to set up any parameters, except Magic number and Friday ex

重力拋物線系統 (Mostafa System)
輕鬆判別趨勢走向
提示完美進場點位
交易輔助清單
順勢交易系統
系統介紹:
重力拋物線系統,使用多項式非參數回歸方法計算拋物線重心及趨勢方向,而價格有非常高的機率會按照拋物線的趨勢方向前進,在依個上升趨勢拋物線中,綠線將會是我們第一個進場點,橘線會是第二個進場點,止損位置僅需要放置在橘線下方。此系統可大幅增加趨勢交易的勝率,交易者可清楚分辨當前交易方向,以及系統建議的進場位置。
影片教學:
UncleForex 外匯大叔 ( https://youtu.be/G4Xahx2Mivg )
今天大叔跟大家分享一套由歐洲的分析師,同時也是交易冠軍的 Mostafa Belkhayate 大師所創建的重力拋物線系統策略。
在交易的道路上我們時常聽到"順勢而為" ,按著趨勢方向去交易,然而大部分的交易者很難了解當下的盤面,到底是上升趨勢還是下降趨勢呢? 而重力拋物線系統,卻可以一眼輕鬆辨別趨勢?!
且還能找到最佳的進出場點位!趕緊觀看影片了解吧 ~

Pulse Scalper EA works on the EURCHF currency pair. Working timeframe M1. The strategy is based on searching for and playing back strong price impulses in the opposite direction. Does not use tick history, uses only closed bars, so you can test using open prices. The Expert Advisor does not use dangerous trading methods that can destroy the deposit: grids, martingale, locking, sitting out without stops. Stops are fixed; in addition, a hidden algorithm is used to track positions, which closes
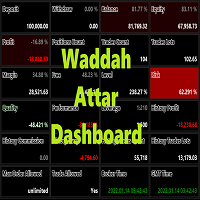
Waddah Attar Dashboard
Simple App show you the most important information about your account , trades and history . Risk , Quality and Performance are the most important numbers you must watch them carefully . also the important thing you must do is Focus on the RED Color on the board . you can control the font name , font size , width , height and padding properties . the information is auto arranged on the chart . don't worry about it .
Thanks .
recommended product for position risk manage

Feb 14 2022 will be the last limit to purchase this EA for 1689 $, normal price will be 4500 $
Insider 8PRO is fully automatic trend following system, its basically designed for any pair, however you may follow our suggestion by running this bot on XAUUSD or Gold. the system uses the main trend following of the Forex market in trading, and spot the best moment to place an order.
Timeframes: M30 Pair suggestion: XAUUSD (Gold) Recomended balance: $1000 Minimum balance: $500 After purchasing thi
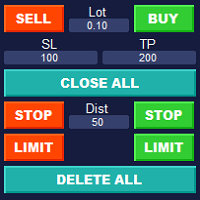
Simple Customizable Trade Panel — Fast and Easy One-Click Trading This lightweight and powerful panel is built for traders who value speed , simplicity , and full customization . With just one click, you can: Buy or Sell instantly
Close all open positions
Place pending orders with custom distance
Delete all pending orders Adjustable parameters: • Lot size
• Stop Loss (in points)
• Take Profit (in points)
• Distance to price for pending orders The panel is fully responsive and adaptab

The advantage of working with the Brian signal indicator is that the trader does not need to conduct technical analysis of the chart on his own. The tool generates ready-made signals in the form of directional arrows. This tool is an arrow (signal) one and works without redrawing.
Its signals are based on a robust algorithm. When used simultaneously on multiple timeframes, this indicator will truly "make the trend your friend". With it, you can follow trends on multiple timeframes in real time

MT5 Version
Gaussian Channel MT4 Gaussian Channel MT4 is the first indicator in the market that uses Ehlers Gaussian Filter methods to define trends. Nowadays, this Gaussian Channel is highly known as a method to support HOLD techniques in crypto. If the price is above the channel the trend is strong, if it comes back to the channel this can react as a resistance and indicate the beginning of a bear market (or Winter) if the price breaks below it. Eventhough the use of this channel focuses on h

The Context Aviation indicator analyzes the price behavior and if there is a temporary weakness in the trend, you can notice this from the indicator readings, as in the case of a pronounced change in the trend direction. It is not difficult to enter the market, but it is much more difficult to stay in it. The Context Aviation indicator makes it much easier to stay in trend! This indicator allows you to analyze historical data and, based on them, display instructions for the trader for further a
Professional processing of the classic indicator. The bot implements the classic trading strategy based on the Stochastic indicator. The signal from the stochastic exit from the overbought / oversold zones, the levels of these zones will be the levels with the LevelMax and LevelMin values. We buy when the oscillator (PeriodK or PeriodD) first drops below a certain level (LevelMin) and then rises above it. Sell when the oscillator first rises above a certain level (LevelMax), and then drops be

Here is a sensitive indicator for Dublgis professionals. It is built on completely new algorithms and is more efficient, on any timeframes, since it filters random price movements. Finds and visually displays price reversal points. This tool can be used as confirmation when making a deal, as well as to determine the direction of the trend and its strength. The indicator was developed as a complement to a number of our other trading tools.

Bella is one of the most popular indicators that allows you to timely identify a trend reversal, get an early entry point and pinpoint the place of profit taking. The Bella indicator implements the main idea of the trader and generates a point of entry into the market in the direction of the trend.
Bella is used when there are additional indicators. To filter such signals, you can use the same indicator on older timeframes. Thus, the work with the indicator is improved, while maintaining its

A trend indicator is a hybrid of several indicators that process data sequentially with signaling a trend change. Advanced net price action calculation to find LH and HL breakouts. Finishing the indicator data will give you excellent pivot points in the market. LH and HL signals can also be used for breakouts of the training. The indicator has proven itself well in a strategy based on impulse levels and false breakouts. When a breakout occurs, it indicates a strong reversal. A good filter for mo

A professional bot that implements a trading strategy based on RSI, Envelopes and Stochastic indicators. The analysis is carried out according to the levels of price intersection with the Envelopes lines, on the breakdown of the lines, if an upward breakdown then this is a buy signal, if a downward breakdown of any line is a sell signal. Another part of the analysis is based on the levels of price intersection with the Stochastic lines, on the breakdown of the lines, if an upward breakdown then

This is a homeopathic grid trading system, which is mainly suitable for volatile market conditions. The way to open an order is to first determine the trend through the resonance of the 4H, 24H, and 1W time periods of "ADMI", and then use the Stochastic indicator to find the entry point. The grid interval is determined by the profit points of the order. When the loss/profit points of the order reach the grid profit you set, the position will be opened. If there is any reverse change in the tren
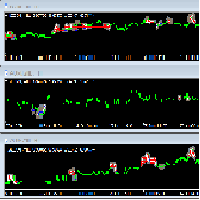
迈达克论坛交易记录复盘工具。 运行平台:MT4 迈达克论坛有很多优质的信号,如果你需要研究学习这些优质信号的交易轨迹,可以用这个工具进行复盘。 适用方法: 1、选择优质信号 2、选择“交易历史记录” 3、交易历史记录标签页右下角选择 导出至CSV历史,导出历史记录 4、将导出导出的CSV历史记录文件存放到MT4安装目录下的 \ MQL4\Files文件夹中。 5、运行程序,在参数表中输入历史文件名称,并点击确定。 6、软件自动在所选图表中绘出涉及到当前交易品种的交易痕迹。 说明: MT4,MT5信号均可在MT4上进行交易痕迹绘制。 多单蓝色显示,空单红色显示。止损红色表示,止盈蓝色表示。 在具体使用中有任何问题,可以联系我的微信gaoqing001

A professional bot that implements a trading strategy based on RSI and Envelopes indicators. The analysis is carried out by the levels of price intersection with the Envelopes lines, for a breakdown of any of the lines, if an upward breakdown then this is a buy signal, if a downward breakdown of any line is a sell signal. In this case, a breakdown of one of the RSI levels is also required. An upward breakdown of any level is a buy signal, and a downward breakdown of any level is a sell signal.

Possible Price reversals levels - based on Fibonacci + Support + Resistance Levels Auto levels drawn based on input index (Bars Count ) ---->>> Price Over 50% Fibo line ---> UP TREND ---> BUY when price drop near Support Lines ---->>> Price Down 50% Fibo line ---> DOWN TREND ---> SELL when price goes up near Resistance Lines
--->>> The more close price levels ----> the more possibility for price reversals --->>> are you a scalper --> try it on M1 charts with big index like 5000 bars or
Waddah Attar Statistical Predictor
This indicator show you the Statistical Forecast for any symbol. it depends on a history data . the result show on a new day and still with no change until end of the day . with this indicator you can : know the main direction . know the range of the movement . know high and low in the current day . use indicator levels in any expert you made to auto trade .
Preferably used with main symbols like EURUSD, GBPUSD, AUDUSD, NZDUSD, USDJPY, USDCHF, USDCAD, Gold, S

Orion II is a multi-strategy Expert Advisor: 20 different strategies has been embedded into a single Advisor with a logic able to select the best algorithm for each market phase! Multi-strategy allows to achieve a smooth equity line keeping at the same time the risks at an acceptable level. Money Management can be based on fixed lot size or on a variable lot size. The lot size is determined according the a maximum risk % based on available Balance. The EA is set to use variable lot size with t

外国為替指標「鉄コンドル戦略」を使用すると、外国為替市場で非常によく知られているオプション戦略を適用できます。このインディケータの助けを借りて、いつ買い取引を開始し、いつ販売取引を開始するかを知ることができます。 「鉄コンドル戦略」インジケーターは、チャートの矢印を使用してこの情報を示します。これにより、5秒でインジケーターシグナルを確認することで、取引を開始するために必要な方向の情報を取得できます。チャートを1時間分析する代わりに、チャートを5秒間見るだけで、取引に必要なすべての情報を受け取ることができます。
「鉄コンドル戦略」指標による取引戦略: 赤い矢印-売ります。 TakeProfit15ポイント。 StopLoss25ピップ。 青い矢印-購入。 TakeProfit15ポイント。 StopLoss25ピップ。
「鉄コンドル戦略」インジケーターの設定: 期間-期間。信号間の距離を大きくします。 バー-シグナルが表示されるチャート上のバーの数。

Xmasterインジケーターの新しいより正確なバージョン。最も効果的で正確な式を得るために、世界中の200以上のトレーダーが、PCでこのインジケーターのさまざまな組み合わせの15,000以上のテストを実施しました。そしてここでは、正確なシグナルを表示し、再ペイントしない「Xmasterフォーミュラインジケーター外国為替再ペイントなし」インジケーターを紹介します。このインジケーターはまた、電子メールとプッシュによってトレーダーにシグナルを送信します。新しいティックが到着するたびに、75以上のパラメーターで市場を常に分析し、トレーダーに正確な売買シグナルを示します。また、このインディケータの助けを借りて、正しい方向で取引を開始するためにトレンドが現在どの方向に進んでいるかを確認できます。 新しい「Xmasterフォーミュラインジケーターforexno repaint」インジケーターはどのように機能し、古いバージョンと何が違うのですか? まず第一に、それは世界中のさまざまなトレーダーによって15,000回以上テストされた最も最適化された市場分析アルゴリズムです。 第二に、このインジケーター

Expert system BotMFI .
The most important characteristics for an expert are the ability to predict, that is, potential profit in the future, and not in the optimization period. To do this, you can simply check the Expert Advisor, cycle it through history in two stages. The first stage is optimization and sampling (according to one invariable rule). The second stage is the sweep. Thus, you can cycle through several times and draw conclusions. In this case, for optimization, an interval of one

This is a custom RSI of MA indicator consisting of 8 indices: AUDindex, NZDindex, CADindex, EURindex, CHFindex, GBPindex, USDindex and JPYindex. It can run on Forex brokers' servers having 28 currency pairs. No repaint.
How to Use When one of the 8 indices turns upwards, sell the strongest pair. When one of the 8 indices turns downwards, buy the lowest pair.
+ For newbies: Best trading has been detected on H1 chart in Euro session and US session to avoid sideways market Or use timeframe M5/M15

The Expert Advisor adheres to entry points according to my author's SPIDER trading system, which is based on finding the best entry point to a trade when a trend movement is emerging. To search for a trend, my author's indicator is used, plus there is a cartoon trend indicator that determines the trend from a higher timeframe.
Further, the ADVISER types a grid of orders if the price goes against the general signal, but at the same time, it opens new deals if there is a new signal of the opposi

sarangani venom is 100% profitable, easy to use indicator, a chart without indicator is stressful and will lead you to many losses, this indicator is pleasing to the eye that will gives you more confident to trade when there is signal, your computer will gives sound and the spider will animate, it can be used to all time frame and to all currency, you have many options, when the candlestick touches to upper line it is buy, when it touches to lower line it is sell, when the rope is pull to buy ar

It's a smart Investing.com utility signal analyzer on MT4 chart during 28 pairs ,It uses all technical and candlestick patterns for each pairs to analyze the final trend ,You can use it as base entry signal for each pairs, It's easy to use ,You must add the address ' https://www.investing.com/ ' in the list of allowed URL tab 'Advisors' , Added GlobalVariables for each pairs as buffer simulation to get data from any ExpertAdvasor for trading.
Setup
So to work with the server, you must add the U
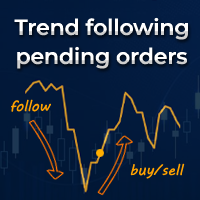
Trend following pending orders detect a group of orders opened by chart buttons and automatically follows market price.
Once your STOP or LIMIT orders are activated Trend following pending orders immediately adds STOP LOSS and TAKE PROFITS . Optionally you can add rule for closing all market orders when sum or price will reach your profit or loss. You can also enable trailing stop loss and traling take profit to market orders. It is a very handy tool in cases where you want to catch the perf

QV2 MA is an indicator that displays the results of two smoothed moving averages applied to Candles. Item 01 - Buy signal: Candle show color Aqua when the 4-period smoothed moving average is expanding and above the 24-period smoothed moving average. Item 02 - Sell Signal: Candle show color HotPink color when a 4-period smoothed moving average is expanding and below the 24-period smoothed moving average. Item 03 - The gray candle is an undefined region.
When the candle is gray, there are two rec

Coral Trade Planner is a 3-in-1 tool for making smart trades. The Lot Size Calculator lets you determine the appropriate lot size based on risk, and see the impact on your risk as you change the stop loss distance and/or lot size. The Trade Planner is an innovative tool for visualizing your planned trades on the chart, and gives you immediate feedback on the value of the trade (both the risk of hitting your stop loss and the reward of hitting your take profit). Both Market and Pending order

FLEX REVERSE PRO - GBPUSD
Good evening everyone, I'm Tiziano and after over 2 years of modifications and backtesting today I present the definitive EA for GBPUSD which, as per the attached screenshots over the last 15 years, had a net profit of 13 million starting from a capital of 1000! In fact, already in 2009 it had reached a balance of € 800,000 but due to the broker's block at 100 pips per operation, it is not possible to carry out operations with greater lottery, if it had been possible

No price discounts. No Black Fridays, no Christmas deals – simply put, no promotions at all. No one will be disadvantaged. The price will be fixed for everyone. If you have any questions, I’m always happy to help, so feel free to contact me.
I believe that markets function as people do, so if we’re capable of understanding them in the present moment, why not take advantage of it, right? TREND IS MY FRIEND! It is trend system, which is based on trend indicators. Works very well on bitcoin and e
Close All Orders for MT4 script - closes absolutely all orders, whether pending or market ones.
Orders are closed at the current profit/loss indicators at the time of closing.
The script is suitable for moments when you need to quickly close all orders at the current indicators.
The script is very easy to use, just drag the script onto the chart and it will do its job.
Add me as a friend , I have many other useful products.

This is a real trend tracking trading system, it can let you not miss major trends!
It opens positions through the moving average system, and automatically calculates the position size unit through ATR and your balance. The purpose is to make one time ATR equal to 1% of the account’s equity. Move 0.5ATR along the way to add a layer of positions. If the market moves backwards after opening a position, the loss will be stopped (the maximum loss for a single transaction is 1% by default). You can
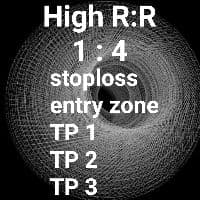
フィボナッチブレイクアウトは、フィボナッチリトレースメントを使用した取引戦略です。このテクニックは、実際にはトレンドの始まりに入ることができるテクニックです。初心者でもわかりやすいです。 戦略は、自動カスタムフィボナッチが表示されるのを待ってから、手動で保留中の注文を出し、損失を止めてフィボナッチのレベルで利益を得る必要があるということです。価格が再テストに成功すると、ポジションがオープンします。外国為替、暗号通貨、株式に適したフィボナッチブレイクアウト。 フィボナッチブレイクアウトレベルの詳細: 1-トレードの監視= 0(ストップロスレベルになる可能性があります) 2-エントリーゾーン= 0.50 – 1.00(ゾーン内の価格の場合のエントリー) 3-利益ゾーンを取る TP1= 1.618 TP2= 2.618 TP3= 4.236
標準操作手順(SOP) •SOPは非常にシンプルで、理解しやすいものです。システムは以下の存在を識別します: 1.イニシャルブレイク(IB)またはドミナントブレイク(DB) 2.キャンドルブレイク1(CB1)-X記号の青または赤の色でマーク(実

This Trading bot will always get updated, that is why the monthly fee is placed. *I Will be adding more Features and Videos from customers' feedback on how they would like to improve on this.
This is based on the Martingale Custom Strategy but could be used as an Indicator for your Entry Point to have a HIGHER SUCCESS of a CALCULATED OUTCOME. * DO NOT TRADE AGAINST MATHEMATICS* I have YOUTUBE Videos that will show you how each step works. Look at Part1-Part5 VIDEOS to see how this ea. FOR NOW

The Qv² Trend is an indicator that aims to identify trends.
Buying trend signals are indicated by arrows pointing up.
Selling trend signals are indicated by arrows pointing down.
It can be used in all deadlines.
It can be used in all pairs.
I use it on the H1 with a period of 24.
Important note: I recommend using it in markets that naturally show trends. For in range markets I present my other indicator on this link OBOS
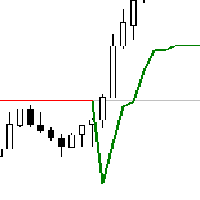
Based on supertrend indicator ,
get alert based on trend change of very popular SUPERTREND indicator..
Supertrend indicator can be used for both trend change setups or inline trend confirmation can be seen as trend continuation. providing as better entries and exits. or you can use supertrend indicator also as dynamic support and resistance zone.
When applied to chart Dashboard will scan and show current position of price with respect to supertrend indicator , and you will be able to get

Great Bird expert advisor using a scalping system with low DD. has StopLoss and TakeProfit features automatically set by the algorithm. you can also set StopLoss and TakeProfit manually. The Expert Advisor does not need complicated setup and is ready to be used for all currencies Use Timeframe M5 account ECN recommendation Minimum account balance $ 100 (for one pair)
The Expert Advisor does not use: Grid Averaging Martingale Doubling
The EA uses the main strategies for trading at night . The artificial intelligence that the adviser possesses is a neural network that remembers most of the market formations and technical analysis figures recently, and the robot also corrects inputs taking into account the stored data. The EA is equipped with a neural network with the ability to learn, several different strategies are integrated into the script, which are applied depending on market conditions. The EA requires a m

Orion I is a multi-strategy Expert Advisor: 13 different strategies has been embedded into a single Advisor with a logic able to select the best algorithm for each market phase! Multi-strategy allows to achieve a smooth equity line keeping at the same time the risks at an acceptable level. Money Management is based on fixed lot size OR fixed risk (i.e. maximum risk per trade expressed as % of available balance). This EA has been developed for EURUSD with 1H time interval. Can be used on other

Нестандартный индикатор определения текущего тренда. Альтернативный подход к определению текущей рыночной тенденции. В основе лежит уникальный алгоритм. Не используются скользящие средние , осцилляторы , супер-тренды и прочие стандартные индикаторы.
Для таймфреймов: от M15 до D1 . Для стилей торговли: интрадэй, свинг, долгосрок .
Может стать готовой торговой стратегией совместно с любым канальным индикатором. Например таким, как индикатор "Snake" . Внимание! Это индикатор, а не советник,

Канальный индикатор "Snake" . Отлично показывает точки входа и выхода.
Не перерисовывает!
Хорошо подойдет для стратегий с сетками (усреднения), стратегий с пирамидами (стратегий добора), обычной торговли по тренду, торговли на коррекции.
Для любых типов инструментов: валюты, нефть, металлы, криптовалюты. Для любых таймфреймов: от M1 до D1 . Для любых стилей торговли: скальпинг, интрадэй, свинг, долгосрок .
Используйте в сочетании с трендовым индикатором, чтобы исключить риски входа про

This is a fully automatic forex robot optimized for EURUSD M30. It can trade on both sides at the same time. It uses a dynamic grid and a sophisticated martingale system. It has separate money management for first trade and for martingale trades. This system is not slip sensitive and will work well for all brokers. Settings Start and end of trading Trading TimeFrame Use RSI filter RSI settings ::::::: Money management
Lots – starting lot Autolot balance – automatic calculation of the initial lot

This Expert Advisor is able to independently adjust to a volatile market. It determines the best parameters for trading by counting over a certain history which candles, levels and indicator readings are most suitable for opening a position. This makes it possible to optimize parameters manually less often and, probably, to trade for longer without losses despite the market changes. However, not all parameters are automatically optimized, it is necessary to set deviations of indicators from the

This is trading bot I put together after attending traders with more few decades of trading. I am a Software Architect, and I "fell in love" in trading after attending uncountable number of trainings, webinars about trading. The only negative side I did not like about trading was looking the charts hoping to spot opportunities to trade. Therefore, I started automating trading strategies I have learned during those trainings and webinars. This EA is result of those trainings/webinars and months s

The Silver Volatility Trend Line for MT4 is an EA that helps you trade using the trendlines, drawn on your chart. It basically allows you to send and manage orders using trend lines. It automatically calculates the True Range of your asset to allow you to send orders well calibrated with the market volatility. Take Profit and Stop Loss are calculated in number of True Range. You can do that for two different orders at the same time , so that you can trade two different kind of risk / profit rat

Scalper Urban EA is a trading system based on medium-term impulse price fluctuations. Each trade is opened when there is a corresponding trend. Scalper Urban EA conducts in-depth technical analysis of your chosen currency pair. The Expert Advisor does not use aggressive and dangerous trading methods and therefore is as stable as possible when using certain settings. With its unique filtering algorithm for false market entry signals, Scalper Urban recognizes the best possible entry point

Qv² OBOS is an indicator that aims to identify overbought and oversold regions considering price standard deviation and volume analysis.
Oversold signals are indicated by arrows pointing upwards.
Overbought signals are indicated by arrows pointing downwards. Can be used in all timeframes. Can be used on all pairs. I use in H1 Important note, the histogram is displayed to improve the trader's analysis. But the signs of overbought and oversold are the arrows as mentioned above.
Important note:

the first release of the new year's special promo price.normal price 150 USD. important user guide is here https://heyzine.com/flip-book/62a16c6955.html indicator to speed up finding support and resistance price.very easy to use very neat interface.doesn't display unnecessary confusing things.uses basic trading strategies for professional traders.....happy trading if something is still not clear,please contact me personally,i will reply later

===== NEW YEAR 2025 PROMO PRICE TILL END MONTH IS 4.999$ or 10 Licenses ================== REGULAR PRICE 4.999$ PPttraderEA45 is an EA developed on the basis of years of PROFESSIONAL experience It is based on the original INDICATOR and runs on the composite batch size which will give you EXCELLENT results, as you can see by doing Backtesting The minimum and recommended DEPOSIT is only $ 100 USD It is a RISK strategy, but if you are PATIENT, the profits will come
EA supplied in SETUP Plug and Pl

I recommend you to read the product's blog (manual) from start to end so that it is clear from the beginning what the indicactor offers. This multi time frame and multi symbol supply and demand zone dashboard indicator sends alerts when the price has reached a supply/demand zone. It is also possible to use it to be alerted about regular double tops/bottoms instead of zones. It can be used with all time frames from M1 to MN. It is possible to use RSI, divergence (MACD, OsMA, RSI or Awesome) a

The trend in the market can be predicted using trend lines but the problem is you don’t know where exactly the price is going to touch the trend line where you can put your pending orders on. Smart Channel Expert Advisor makes it possible to put an advanced channel around the price data, which can be configured to handle placing orders, opening and closing positions, managing risk per trade, spread, slippage, and trailing stop-loss and take-profit automatically. Features Money Management (Calcul

Meta Trend Indicator is an efficient way to forecast and detect the trend in any market. It reveals the trend, support and resistance levels, volatility and the maximum potential target, all in one indicator. To adapt to the price and to decrease consecutive trend failures, the internal trend detector algorithm studies the market and dynamically chooses the right values for the internal parameters. This indicator is a perfect trend filter for any strategy or expert advisor. Features Super Adapti

Account protection
BULL BEAR GOLD MT4 is a fully automated expert advisor. by using candle value patterns to enter trades And there is a system of balance lots to increase profitability according to the size of the account (adjust the risk accordingly).
Feature No martingale Trading using candlesticks and trends It takes time to place an order with high accuracy. There is a system to open orders to increase profits when the wrong way. Money management Dynamic lot size based on balance Hedgi

Вспомогательный советник. Советник сам не торгует. В тестере открывает сделки для демонстрации и возможности подбора настроек.
Советник анализирует сделки по всему счету, находит самый убыточный ордер, со значением ( Minimum order LOSS ) и закрывает его с минимальной прибылью ( Minimal annihilation profit for closing ) за счет текущих прибыльных ордеров, минимальная прибыль для закрытия прибыльного ордера ( Minimum order PROFIT ). Советник может оставлять самые прибыльные ордера ( Saving prof

High Probability Reversal Indicator The indicator looks for trend exhaustion areas, and plots Buy/Sell arrow after confirmation of trend exhaustion. Signals can also be shown as popup alerts, or be sent as e-mail or mobile phone notification. Trades can be taken on breakout of the signal candle. Inputs
Signal Type: Aggressive/Normal History Bars : Can be set to 0 (zero) to show all historical signals, or can be set to a limited number of bars for faster execution. Show Alert : True/Fal
Forex indicator for day trading for beginners. This indicator shows with arrows when the price turns in the other direction. At this moment, you can conclude deals. The indicator trades on H1, H4 timeframes. The indicator also shows the trend direction with lines. During the day, you can open deals in the direction of the trend and set a minimum 15-20 points of TakeProfit. When one deal is closed by take profit, you immediately open another deal in the direction of the indicator line.
How the D

Main features: I nforming via telegram buttons content and closing orders for one of the pairs or all necessary orders. Alert and information buttons to the telegram window when the specified percentage of profit is reached for each pair, or for two at once. The telegrams "sleep" while no profit we need, when a profit is reached, a menu of 5 buttons appears, in each button the profit will be displayed both in currency and in %%. When you click on the button, the direction of orders for this pa

Professional robot Forgotten Technology, which implements the classic trading strategy. The signal is generated when the Alligator's trend changes. When the Jaw, Teeth and Lips are closed or intertwined, the Alligator is about to sleep or is already asleep. When he sleeps, his hunger increases - the longer he sleeps, the more hungry he will be when he wakes up. When he wakes up, the first thing he does is open his Mouth and start yawning. Then he begins to smell the smell of food: bull meat or

the indicator will show signal arrows on the graph at the crossing of MACD level it has push and audible alerts. By crossing from low to high level 0, a blue arrow will come out for the BUY, at the same time an audible signal will sound. By crossing from low to high level 0, a red arrow will come out for the SELL, at the same time an audible signal will sound. Possibility to deactivate push and audible alerts.
MT5 : Buy the 'MACD Arrow' Technical Indicator for MetaTrader 5 in MetaTrader Marke

The Expert Advisor is based on a long-term study of the volatility of the # DAX30 index. The Expert Advisor opens no more than one deal per day. If there is no signal, the deal will not be opened.
IMPORTANT!!!! if there is an already open deal, the EA will not open a new one. Even if you opened a deal manually, the EA will not open a new one. made for the purpose of security of the deposit and opening in opposite directions.
FOR THE EXPERT TO WORK, THERE SHOULD NOT BE OPEN DEALS IN THE TERMINA

the indicator will show signal arrows on the graph at the crossing of Awesome Oscillator base level it has push and audible alerts and Email alert. By crossing above base level , a blue arrow will come out for the BUY, at the same time an audible signal will sound. By crossing Below base level, a red arrow will come out for the SELL, at the same time an audible signal will sound. Possibility to deactivate push and audible alerts. MT5 version : Buy the 'Awesome cross MT5' Technical Indicator fo
MetaTraderマーケットが取引戦略とテクニカル指標を販売するための最適な場所である理由をご存じですか?宣伝もソフトウェア保護も必要なく、支払いのトラブルもないことです。これらはすべて、MetaTraderマーケットで提供されます。
取引の機会を逃しています。
- 無料取引アプリ
- 8千を超えるシグナルをコピー
- 金融ニュースで金融マーケットを探索
新規登録
ログイン