Di Napoli Detrended Oscillator MT4
- インディケータ
- バージョン: 1.0

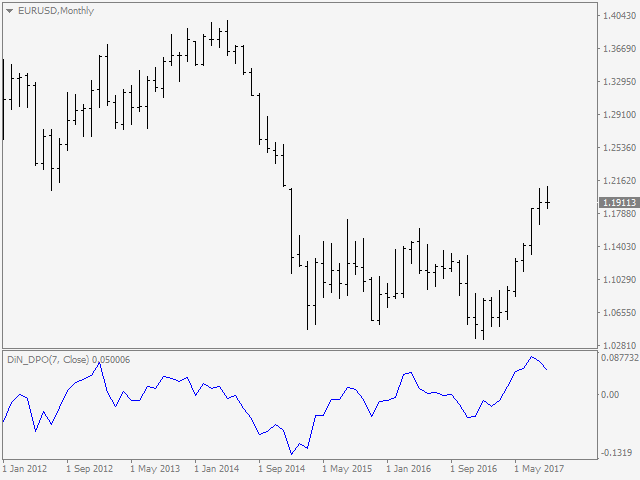
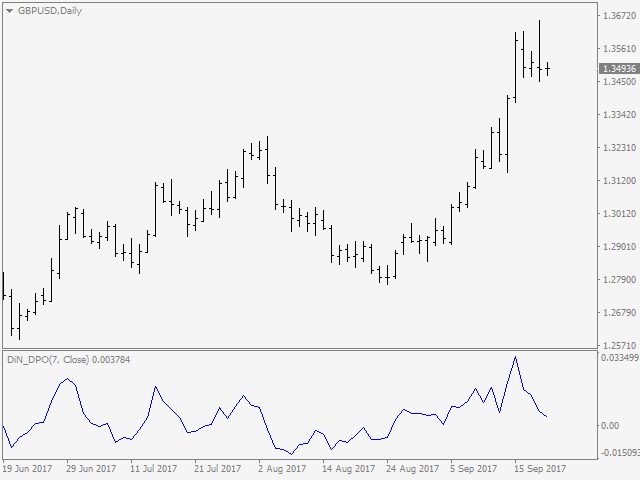
Non-proprietary study of Joe Dinapoli used for overbought/oversold evaluation.
Uses of Detrended Oscillator indicator
- Profit taking.
- Filter for market entry technics.
- Stop placement.
- Part of volatility breakout pattern.
- Determining major trend changes.
- Part of Dinapoli Stretch pattern.
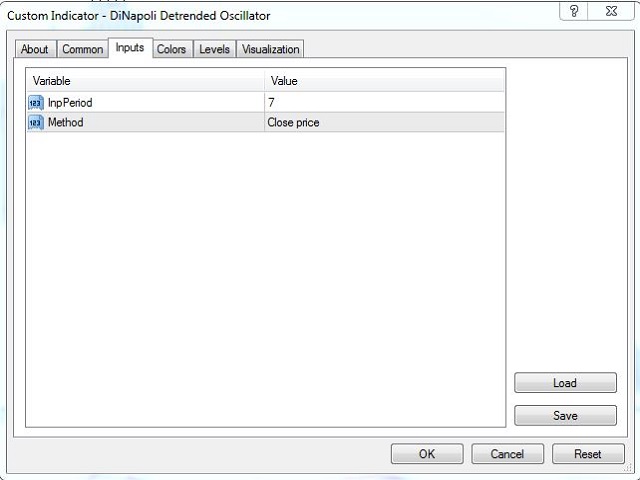
Inputs
- lnpPeriod: Perid of moving average
- Method: Calculation method
*********************************************************************************
If you want to know market Overbought &Oversold price a head of time with Dinapoli's most popular Oscillator predictor indicator;
Please visit ► https://www.mql5.com/en/market/product/52625
*********************************************************************************
For My Other Products;
Please visit ► https://www.mql5.com/en/users/samil34
ユーザーは評価に対して何もコメントを残しませんでした