YouTubeにあるマーケットチュートリアルビデオをご覧ください
ロボットや指標を購入する
仮想ホスティングで
EAを実行
EAを実行
ロボットや指標を購入前にテストする
マーケットで収入を得る
販売のためにプロダクトをプレゼンテーションする方法
MetaTrader 4のためのエキスパートアドバイザーとインディケータ - 77

The FxSProWPR oscillator generates signals for trend confirmation, which can also nbe used to confirm the emergence of new trends.
Indicator Parameters NumberBars - the number of bars to display the indicator. Too many bars may significantly slow down the operation of the trading terminal. SignalAlert - an Alert notifying of a trend. SignalSound - sound alert to notify of a trend. The sound will be played once the histogram exceeds the level of 15.
Rules to confirm position entry Green histogr
FREE

Introduction:
Many traders may face such a situation (at least I have experienced it), they need to set a magic number for the order they want to enter manually, but it is time-consuming to modify an EA for an individual order.
So, I want to create a simple tool. As long as I enter some parameters, I can place an order with magic number so that I can do additional operations on this order by some EA in the future.
This tool is to realize such a simple function: set magic number when placing an o
FREE

Virtual Exchange Reserve Equity Monitor In an environment where exchanges offer increasingly high leverage ratios, it is all the more important for traders to tightly regulate their level of equity . This software is designed to be run in the background on any virtual private server that can run Meta Trader 4/5. It implements basic equity control functions ahead of the broker---allowing users to set their own equity trailing stop, an equity limit to lock-in a certain profit margin, and a unive
FREE

This indicator maps price crossover with Simple Moving Average (SMA) for each candle. Works like a SMA but has non-repaint characteristic. How to Use: As stated before, this indicator works like a SMA. Use this to determine trend. When price is above this line then the uptrend is expected (downtrend if price below the line). 2 of these indicator (with different periods) can also generate buy/sell signal like 2 SMAs. When the lower period SMA crosses higher period SMA from below, then buy signal
FREE

Risklimiter
Limit your risk with this dynamic stop loss indicator. It will show you exactly where to place your initial stop & subsequent stops as the price goes in your favour. Works on any time frame as well as any symbol. It is not restricted in any way nor does it need optimisation. Simply drag and drop on to a chart for it to display a stop loss. You may find at times, it shows a stop on the other side of your trade, this will change as soon as price closes above/below it.
DOES NOT REPA
FREE
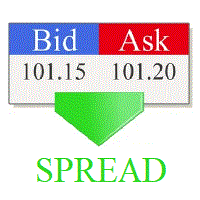
Real-time spread tracking and monitoring software
Displays spread values in form of histograms on current timeframe of chart Convenient for analyzing spread changes, as well as for comparing trading conditions of different brokers By placing on desired chart, the spread changes at different trading times are displayed
Additionally Fully customizable Works on any instrument Works with any broker
FREE

Trade Terminator — Instant One-Click Trade Closer for MT4
Struggling to exit trades quickly during market spikes?
Trade Terminator gives you the power to close all open positions instantly with a single click — saving your profits and protecting your account in fast-moving conditions! Built for speed , security , and simplicity , Trade Terminator ensures you're always in control. Features : One-Click Termination: Instantly close all open BUY and SELL trades on the active chart symbol.
FREE

https://t.me/mql5_neuroExt actual version Signal https://www.mql5.com/ru/signals/1516213
You can use any tool. The bases will be automatically created at the start of the Learn. If you need to start learning from 0 - just delete the base files. Initial deposit - from 200 ye. Options:
DO NOT ATTEMPT TO TEST WITHOUT NEURAL NETWORK TRAINING!
it is enough for the balance graph after training to be horizontal.
generating a training base is extremely simple.
there is a ready-made training for
FREE

A simple script that can delete all the drawing objects on a chart, or just the objects of a specific type.
Settings:
DeleteObjectsOfType By default the value will be blank which means ALL drawing objects on the chart will be deleted. If you only wish to delete specific types of drawing object, change this setting to the type of object to delete. For example, Fibonacci Retracement, Text, Label or Trend Line.
Please see the demonstration video for more information.
FREE

This indicator helps you to Scan symbols which are in the Market Watch Window (in demo Max 15 Symbol) and filter out trends with alerts. It works based on the most popular indicator "Bollinger Bands" which is used by many traders for trading: When box color changes to " Green " or " Red " color, it indicates you for trend change for long and short entry. And also you will get alerted on screen. When it changes to " Green ", it indicates you that trend is going upwards, and you can take the long
FREE

FREE VERSION of : Remus Romulus EA. You'll get much more control and features in this full version: https://www.mql5.com/en/market/product/42200
This EA is a hedging EA. So, please make sure your broker supporting this rule. Works well on ANY PAIRS, but recommended in EU only cause you cannot control many things in this free version. Please use as small as possible lot at start; recommended: 0.01 lot for $1000.
================================
You need a pogrammer for EA? Check this: https://
FREE

The indicator marks bars with a simple trend definition“ each subsequent high above/below the previous one and each subsequent low above/below the previous one ”. Charles Dow
Formula:
Max – The current maximum Min – The current minimum MaxK – Maximum per period MinK – Minimum per period Min>MinK & Max>=MaxK – Symbol on top Max<MaxK & Min<=MinK – The symbol on the bottom
Input parameter:
Number of bars in the calculated history Period for current timeframe The distance to the symbol Se
FREE

Break Average Free Break average is a fully automated Expert Advisor for automatic trading on EURUSD, which uses the strategy of breaking the average. It can work with small deposits of $ 250 and a small leverage of 1: 30. To enter the market, filters of two indicators are used (such as the stochastic and the moving average of 2 periods), which confirms the entry to the market. Very good offer to try the full version only 50 USD Differences from full version : 1. Opens only SELL positio
FREE

This is Lite version of One of the Most Popular EAs "Asmani Pro" ! The Lite version works on M15 EURUSD with only 0.01 lot size All other inputs in this version are working exactly as per Asmani Pro. You can buy Asmani Pro here " https://www.mql5.com/en/market/product/35869 " MUST : Please go through following blogs before Back Testing or Using the EA 1) General Strategy of Asmani Pro https://www.mql5.com/en/blogs/post/725758 2) Inputs explained in detail for Asmani Pro 20.3 https://www.mq
FREE

The indicator draws angulation lines on a chart. These lines can help make decision on whether to enter the market or stay out of it. It is used to filter the signal "The First Wise Man" described in Bill Williams' strategy. Angulation in this indicator is displayed for any bar that is formed after Alligator's mouth is crossed (not only for reversal). Settings: Show angulation lines . Show info - show additional details (angulation degree, calculation points, number of bars). Minimal angle to fi
FREE

The indicator displays the trading statistics of the analyzed Market signal on the chart. Signal transaction data is presented in an excel (csv) file and can be taken from the Signal>Trading history ( Export to CSV: History ). The copied file must be saved to the directory MT4>File>Open Data Folder>MQL4>Files. Available color management and font output. If the currency names are different on the Signal and User accounts, use the Prefix and Suffix parameters. Utility options Prefix at Signal -
FREE

This indicator alerts you when/before new 1 or 5 minute bar candle formed. In other words,this indicator alerts you every 1/5 minutes. This indicator is especially useful for traders who trade when new bars formed.
*This indicator don't work propery in strategy tester.Use this in live trading to check functionality.
There is more powerful Pro version .In Pro version,you can choose more timeframe and so on.
Input Parameters Alert_Or_Sound =Sound ----- Choose alert or sound or both to notify y
FREE

This is an efficient and yet simple Expert Advisor not using indicators, which can determine the following: the future direction of movement of quotes, their strength, trade levels for the current and next trading day. The Expert Advisor runs on the "here and now" principle, which means that the EA tracks a lot of parameters of the price behavior in real time. Based on this Expert Advisor, a certain trading strategy was developed and tested in real time. The ELEMENTARY strategy consists of three
FREE

Based on a combination of indicators, PS Acid Fulx is an excellent indicator for knowing when to buy or sell on any asset and temporaryity. The indicator myself I have used it as a tool for my analysis when trading Forex. It is a useful and easy-to-understand trend indicator. If you combine it with your own analyses you will surely get a good result in your operation.
FREE

Laboratory.Money EUR/CAD M30 Автоматическая Торговая Система из серии Energy Drive EUR/CAD M30 Вся активность эксперта проявляется только на реальной торговле. Его нет толку проверять в тестере стратегий. Запрещается бонус от брокера к вашему депозиту. Эксперт торгует с теми деньгами которые могут уйти в просадок, бонус в просадке не участвует, это приведёт к потере всего вашего депозита. Данный эксперт очень подходит для программы "Rebate" от вашего брокера. Все изменения в на
FREE

Trading is about waiting for the right time. This indicator was created to know what is happening on our charts without having to cover the screen with indicators. In addition, it has several types of alerts that allow us to dedicate our time to other things until something interesting happens. You can use multiple alarms at the same time. It is not a problem.
By default AlterAlert offers us alerts when the following indicators give us a signal:
Moving average (MA crosses) Stochastic Oscillat
FREE

This is a very simple script that will show you the following info about any symbol in your chart: Point, digits, spread, stop level, lot size, tick value, tick size, swap long, swap short, starting date (if future contract), expiration date (if future contract), trade allowed, minimum lot size, lot step, maximum lot size, swap type, profit calculation mode, margin calculation mode, initial margin, margin maintenance, margin when hedged, margin required, freeze level. All this info is extracted
FREE

Good morning, The following indicator is very useful when managing multiple trades on the same instrument. It allows you to see the average entry price for BUY and SELL trades. If there is an imbalance (as shown in the example photo), the indicator will display the averages of the SELL/BUY trades and a GOLD line that marks the breakeven price (excluding swap and commissions).
FREE

This is a standard moving average indicator. I have added a quick control panel in the bottom left corner for it. When multiple different parameters of this indicator are simultaneously enabled, the control panel can quickly switch between different parameters of the indicator, making it easier to observe multiple indicators simultaneously Parameter description: Indicator ID: The unique ID of the indicator. When starting multiple instances, this ID must be unique and cannot be duplicated. Contro
FREE

The indicator detects market efficiencies and inefficiencies by studying price movements and marks candles where the best efficiencies occurred. The most 'efficient' candles are indicated with a vertical bar histogram. Taller bars represent these candles. The highs and lows of these candles are supply and demand areas, important levels that will be retested in the future. It can be used on all time frames with the same settings.
FREE

Martingala Assistance, as its name says ... It is an assistant, an expert advisor that monitors all the orders for the asset in which it has been placed, no matter if that order was by some other expert advisor or by the trader placed on the Manually, he will start his work after each order that is negative.
See more products on: https://www.mql5.com/en/users/joaquinmetayer/seller .
FREE

The EA monitors positions for selected pairs, sets a break-even level and moves a trailing stop. When the trade is "n" points of profit (parameter dist_BEP), the stop loss is moved to the break-even point (the level of the trade opening price) plus the specified distance in points (parameter BEP) The EA checks all available (or filtered) trades for break-even and moves stop-loss levels if necessary. The EA also checks all available (or filtered) trades for trailing stop conditions and, if neces
FREE
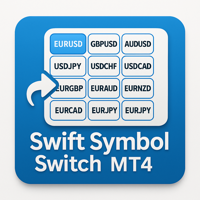
Add a clean, on-chart button panel that lets you instantly switch between any forex pair, crypto, or commodity with a single click—no typing, no symbol search, and no menu digging required. This EA works seamlessly with any MT4 broker and on any timeframe, making it ideal for scalpers, swing traders, and long-term analysts alike. It automatically detects broker-specific symbol suffixes, highlights the currently active pair for easy tracking, and includes both light and dark mode themes to match
FREE

O Chart Control é um indicador que permite de forma rapida e pratica alterar o timeframe e ativo do grafico, possibilitando que voce possa fazer todas as suas analises em apenas um grafico sem precisar abrir vários, além disso voce pode escolher o entre os temas claro e escuro para o qual melhor se adapta a sua preferencia.
MT5: https://www.mql5.com/pt/market/product/109444
FREE

O indicador é uma ferramenta desenvolvida para o MetaTrader, projetada para auxiliar na análise detalhada do comportamento do preço em relação a uma média móvel específica. Ao ser anexado ao timeframe diário, o ele realiza cálculos e monitora, em timeframes menores, quantas vezes o preço toca determinados níveis de afastamento durante o dias além de calcular a média dos toques.
MT5: https://www.mql5.com/pt/market/product/111710
FREE

Всем привет, мои друзья, сябрыыы. Я трейдер, 20 лет опыта. Хочу продемонстрировать свой индикатор. Индикатор создан на базе в тесной кооперации с индикатором arrows_template. Данный индикатор рисует на графике инструмента (любого) индикатор AO(Awesom) поверх. Видите сам AO на графике. Видите пересечение зоны нуля, Блюдце и т.д.. Если будут подсказки, корректировки. Пишите смело, всех пошлю.......Шутка До свидания.
FREE

Have you ever wanted to back-test a strategy but never wanted to risk real money? And the thought of using a demo account is exhausting as real time markets develop your skills slowly. This utility will help you develop your strategy faster and will help determine if the strategy works long-term by simulating real trading through back-tests. This will save you time as you can back-test strategies from previous price data. In order to set an sl during the backtest you have to click on the sl b
FREE
Hello, Every one The EA is used to close buy or sell market positions and all pending orders when the RSI reaches a certain value. It is also used to close positions in the market when the profit reaches a certain value. All setting 1. RSI Period : 14 ( or as you want ) 2. RSI Close Buy Value : 70 (The EA will close all long positions and Pending Buy Orders when the RSI is above 70) 3. RSI Close Sell Value : 30 (The EA will close all short positions and Pending Sell Orders when the RSI is
FREE

Utility for order reversal. Closes orders on the chart on which it is launched and opens orders with the opposite direction instead of them. Has a simple and intuitive graphical interface. It is also possible to automatically reverse newly opened orders. MT5 version of the utility - https://www.mql5.com/en/market/product/74770 If you like this utility, take a look at my other products - https://www.mql5.com/en/users/nina_yermolenko/seller
FREE

Velvet MACD is intended for use with the Velvet advanced ordering layer. It is a modified version of the MACD indicator provided by Metaquotes and all of the data it displays is accurate and verified, when it is detected by the ordering layer. In order to place orders with the Velvet MACD indicator, the ordering layer must be installed and running. Ordering from the Velvet MACD indicator requires that "Velvet Ordering Layer" ( found here ), version 2.0 or higher, be installed and running. Whe
FREE

Current Order Take Profit this indicator shows settled level of Take profit current opened order. If order Take Profit will be changed it will be shown on screen immediately. The same with pips left to get so as to close the position. If the price will drop beneeth the open order price it will change the color of pips digits left to gain. That is usefull when you change Take profit level by drag the price line using mouse to new level na wykresie.
FREE
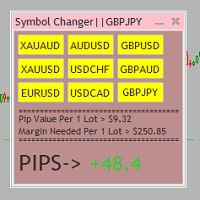
Tired of opening a new chart and applying a template for each Currency pair? So am I. That's why I created an indicator which gives you the option to switch between charts for the first 9 currencies in the Market Watch. In addition to changing between top 9 currencies, the value per 1 lot, the margin required and the amount of pips for any trade you have open for that currency pair are also displayed. Best of all, the colors can be changed!!!
FREE

The Bombay Stock Exchange Session's Hours
This indicator facilitates observing the currency pair's quotations during subsequent parts of the stock exchange session live. Before the session starts, a rectangle is drawn on the chart but not filled in with color. It means the extent of the session duration. Before the first bar enters the rectangle of the session, a sound signal or pop-up window will notify us that the session will just start. When the price graph crosses the edge of the session
FREE

This indicator calculates average speed of moving average indicator. Here is parameters: BarsToProcess - indicator calculating period; MaPeriod - period of Moving Average indicator; AveragingPeriod - period (MA values) of the basis of which the average value is calculated; MA_Method, MA_Apply_to - using to set MA indicator parameters; Thats all! Good luck.
FREE

This utility identifies certain candle open times on chart, this can help you to see your favorite candle open and use it as it fits in your strategy. This tool is very useful for intraday charting and indicating your sessions. ___________________________________________________________________________________
Disclaimer: Do NOT trade or invest based upon the analysis presented on this channel. Always do your own research and due diligence before investing or trading. I’ll never tell you what
FREE

Slow T3 MA Trend indicator derived from T3 moving averages. This indicator is part of the T3 Cloud MA indicator and is posted here on its own. Buying/Selling opportunities above/below line. The MA line can also be used as dynamic support/resistance for more aggressive entries. Use default values for best settings. The number of look back bars is user defined. This indicator can be used in combination with other strategies such as price action. Suitable for all time frames.
FREE

OCTO TACK TREND INDICATOR
Summary/Description: Trend indicator showing signals to execute orders in favor of the current trend Get ready to have the best trend indicator you've ever tried. No repainting in any way, guaranteed It generates clear signals and always in favor of the trend (see screenshots) You just have to wait for the alert to indicate it and earn pip Are you tired of indicators that never work? Here we have the solution, try the free version and if you want to have more signals
FREE

Volume Levels is a very important indicator for exchange trading. Most of the trades were performed on those levels. This indicator displays the price level that had the most trade volumes over a certain period of time. Often, the price bounces from those levels in the future, and it can be successfully used in trading. This is a demo version that works only on the USD/JPY currency pair. To work on all currency pairs, install the full version: https://www.mql5.com/en/market/product/15888
Parame
FREE

RaysFX Market Trend Histogram Il RaysFX Market Trend Histogram è un indicatore personalizzato per la piattaforma di trading MetaTrader 4. Utilizza il Commodity Channel Index (CCI) per identificare le tendenze del mercato e visualizza queste informazioni in un istogramma intuitivo. Caratteristiche principali: Identificazione delle tendenze: L’indicatore calcola il CCI per ogni periodo di tempo e lo utilizza per determinare se il mercato è in una tendenza al rialzo o al ribasso. Visualizzazione in
FREE

The indicator allows you to trade binary options. The recommended time frame is М1 and the expiration time is 1 minute. The indicator suitable for auto and manual trading. A possible signal is specified as a arrows above/under a candle. You should wait until the candle closes! Arrows are not re-painted Trade sessions: LONDON and NEWYORK section Currency pairs: GRB/USD Working time frame: M1 Expiration time: 1 minute. The indicator also shows good results when using the martingale strategy - "Mar
FREE

Индикатор сглаженного Moving Average (xMA)
Входные параметры: xMA Period - период усреднения xMA Method - метод усреднения ( 0-SMA | 1-EMA | 2-SMMA | 3 - LWMA) xMA Price - используемая цена ( 0 - CLOSE | 1 - OPEN | 2 - HIGH | 3 - LOW | 4 - MEDIAN | 5 - TYPICAL | 6 - WEIGHTED) xMA Color - цвет индикаторной линии xMA Width - толщина индикаторной линии
Принцип работы
Индикатор перерассчитывает стандартный технический индикатор Moving Average (дважды усредняет получаемые значения iMA). Период с
FREE
Recommended Broker and Utility Capabilities For optimal use of this utility, it is advisable to choose a broker like RoboForex or a similar one that offers fast order execution and low spreads. Utility Description: The purpose of this utility is to manage market orders, including opening new trades and optimizing losing positions using an internal algorithm. The utility incorporates trend filtering and various types of trailing stops and take profits, making it versatile for trading any instrum
FREE

The Starting Points indicator for MetaTrader 4 is a technical analysis tool that shows the monthly, weekly, and daily starting points, as well as the 1000-point and 500-point levels, in the forex market. The indicator is displayed as a series of horizontal lines that represent the starting points and levels. Benefits of Using the Starting Points Indicator Identify potential trend changes: The Starting Points indicator can help traders identify potential trend changes by highlighting areas wher
FREE
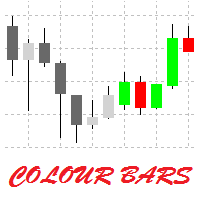
This is a simple utility for visual market analysis. Users can select trading day and time. Bullish candles located within the necessary time interval are shown in green, while bearish ones - in red. Candles outside of the trading time interval are shown in gray and dark gray.
Parameters Trade_Time = "00:00-00:00" - enter trading time. TradeSunday - trade on Sunday. TradeMonday - trade on Monday. TradeTuesday - trade on Tuesday. TradeWednesday - trade on Wednesday. TradeThursday - trade on
FREE

Adaptive MA is a simple modification of the moving averages (MAs) that allows displaying an average value line based on multiple MAs on the chart. The parameters allow you to set any number of MA periods. The number of parameters is equal to the number of moving averages applied in calculation.
At first, it may seem that nothing new has been invented and there is no sense in this approach. However, this impression is deceptive. As we know, the trends have different duration. Have you ever tried
FREE
This indicator allows to hide Stochastic oscillator (on all MT4 timeframes) from a date define by the user, with a vertical line (Alone) or a panel (with "Hidden Candles"). Indicator Inputs: % K Period % D Period Slowing Apply To Method Information on "Stochastic Oscillator" indicator is available here: https://www.metatrader4.com/en/trading-platform/help/analytics/tech_indicators/stochastic_oscillator ************************************************************* Hey traders!! Give me your
FREE
This indicator allows to hide Bill Williams Alligator (on all MT4 timeframes) from a date define by the user with a vertical line (Alone) or a panel (with "Hidden Candles"). Indicator Inputs: Jaws Period Jaws Shift Teeth Period Teeth Shift Lips Period Lips Shift Method Apply To Information on "Alligator" indicator is available here: https://www.metatrader4.com/en/trading-platform/help/analytics/tech_indicators/alligator ************************************************************* Hey traders!
FREE

Customize your charts with this simple utility.
Choose in the 24 pre-built color sets, or use your own colors, save them to re-use them later.
You can also add a text label on your chart.
--- Chart Colors--
Color Set : 24 prebuilt color sets (select "Custom" to use colors below) Background color Foreground color Grid color Chart Up color Chart Down color Candle Bull color Candle Bear color Line color Volumes color --- Label--- Text Label : Type the text you want to appear on the chart Label P
FREE

Auto Close & Delete All is an assistant to help you quickly close all trades of a selected symbol or all symbols and delete pending orders. Through its flexible settings, you can set the script to either close only trades, or only pending orders, or both market trades and pending orders. The script can close deals and delete pending orders wither for the current instrument, or for all instruments. This is selected in settings. The settings are displayed on the screen before the script execution,
FREE
NearONE displays the average value of the price deviation in points for a specified period in a subwindow of a selected trading instrument.
Inputs : DRAWs - number of bars to display the indicator; NearPeriod - indicator period.
If NearPeriod is 0 , recommended periods are used for each chart timeframe.
If NearPeriod = 0: M1 timeframe - period = 60 ; M5 timeframe - period = 48 ; M15 timeframe - period = 96 ; M30 timeframe - period = 192 ; H1 timeframe - period = 96 ; H4 timeframe - period = 3
FREE

Displays previous months Highs & Lows. You can set the number of months to display levels for, also the line style, color and width. This is very useful for traders using the BTMM and other methods like ICT. I'll be creating similar indicators for MT5 for the BTMM. Send me your suggestions to my Telegram: https://t.me/JDelgadoCR Take a look at my other products at: https://www.mql5.com/en/users/jdelgadocr/seller
FREE

Portfolio Aggregator — One dashboard, total clarity across all your trading accounts.
Portfolio Aggregator unifies account data from multiple brokers and currencies into a single, transparent dashboard. It provides real‑time visibility into equity, margin, P&L, and risk metrics, helping traders maintain control and confidence across diversified strategies. Features Multi‑Currency Consolidation — Converts all values into a chosen base currency with live FX rates. Portfolio Dashboard — Displays e
FREE

Heartbeat Agent is a comprehensive monitoring system for MetaTrader 4 terminals, designed to detect critical issues before they impact your trading. Compatible with both Windows and Linux, it continuously monitors your terminal's health and alerts you immediately when problems arise. Key Features: Trading Permissions Monitoring: Detects when AutoTrading is disabled, preventing your Expert Advisors from executing trades. Alerts if your account is in Investor Mode (read-only) or if your broker has
FREE

Marginhedged 情報インジケーター。 ロット-計算に必要なロットを設定し、入力フィールドを使用して設定します MARGININIT-指定されたロットの初期証拠金要件 MARGINHEDGED-セットロットごとの重複注文から請求されるマージン PERCENT- 重複した注文に請求されるマージン(パーセンテージで表される) インジケーター設定の説明: _color-色を設定します インジケーターの使用例:
ロット1の1つの買いポジションが市場で開かれています。この場合の証拠金要件は$ 10に対応します。
ロット1で売りポジションを開くと、必要な証拠金の合計は5ドルになります。
または50%。
インジケータは、特定のロットのこの情報を示します。
FREE

パンダオシレーターは、スキャルピングのために設計された新しい著者の指標です。
標準的な、専有用具の全範囲の読書に基づいて信号を与える表示器。
パンダ発振器の主な特長: 分析関数
これは、任意の通貨ペアと時間枠で使用することができます; インジケーターは再描画されません; それは他の指標に大きな追加です; グラフィカルな機能
チャート上の最小位置数を占めています; 柔軟性のあるチンキ; 簡単に学ぶことができます; パンダオシレーターはで構成されています。..
青い線はRSIインジケータです; オレンジ色のラインは、T3RSIに基づく統合RSIインジケータです; 点線はボリンジャーバンドの境界である(図参照)。 6) 青い線はボリンジャーバンドの中央線です; パンダ発振器の主な特長
フィルタリングのための指標のセットを持っています; 指標自体は、いつ市場に参入する必要があるかを示しています;
パンダオシレーターの基本設定: RSI期間-RSIの青い線を設定する;
バンド期間-点線の調整;
MA期間-移動平均の設定;
バンド偏差-バンド偏差;
バンド
FREE

"All in One" panel. You can simultaneously control: up to 3 symbols; up to 6 periods; up to 31 popular signals. You can see the sum for all signals taking into account the weight of the signal Version for MetaTrader 4: https://www.mql5.com/ru/market/product/27880 Version for MetaTrader 5: https://www.mql5.com/ru/market/product/27830
Parameters NUM_BAR - number of the bar to analyze (set a value greater than 0 to work on closed bars). timeframe_1....timeframe_6 - working timeframes (if set to "c
FREE

このスクリプトは、多数の注文を扱う人にとって非常に便利です。 口座に利益があり、口座のすべての注文を一度に閉じる必要があります。 これは完全なCloserスクリプトのためのものです。
スクリプトパラメータ: Close type ーズする注文のタイプを指定します。 買い注文のみを閉じたい場合。 すべての注文を閉じる場合は、パラメータをすべてのタイプの位置のままにします MagicNumber -アカウントで複数の注文が実行されているが、特定の顧問の注文を閉じる必要がある場合は、このパラメータにこの顧問の一意の番号を指定し、スク 新しいロボットの更新とリリースを逃さないように友人として私を追加-> Dmitrii Korchagin
市場で私の他の製品を参照してください-> 私の製品
私のロボットはすぐにリリースされますが、その間に、それがどのように取引されるかを見てください-> Hewer Signal
FREE

This script paces itself to zoom into the deepest setting of ZOOM +
You may be in tune to know a few keyboard easter eggs. Pressing the minus <-> button has the capability to Zoom the Chart Outward! Interesting to see the price reevaluate itself in perspective. This we could see is quite contagiously useful if we wanted to be quick with analyzing, examining through your tools, in your plans and such.
So, if you ever wanted to zoom IN and OUT, here is Your play around with the chart poin
FREE

Elevate your trading with this Breakeven and Trailing Stop Manager, an Expert Advisor (EA) built for MetaTrader 4 to streamline risk management by automating breakeven and trailing stop strategies. This EA helps secure profits and minimize losses without requiring constant manual intervention, giving you more time to focus on market analysis and strategy.
### Key Features:
- **Automatic Breakeven Adjustment:** Automatically move the Stop Loss to the breakeven level once your position reac
FREE

Non-proprietary study of Joe Dinapoli used for trend analysis. The indicator gives trend signals when the fast line penetrates the slow line. These signals remain intact until another penetration occurs. The signal is confirmed at the close of the period. It is applicable for all timeframes. Inputs lnpPeriod: Period of moving average. lnpSmoothK: %K period. lnpSmoothD: %D period. *****************************************************************************
FREE
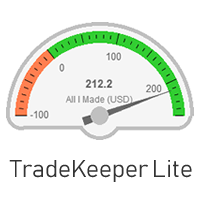
The utility TradeKeeper Lite can show your profits for different periods and bip a sound when you reach a profit target value. Click the tachometer to quickly switch to the next profit period. There are 5 of them: This Day, This Week, This Month, Last 90 Days and All I Made. With the utility TradeKeeper Pro , available at this link , you can also open trades with a magic number and volume of your choice, trail any orders with a simple trail or iSAR-based trail, as well as close any open trades a
FREE

The Tick Data Record is a multi-symbol multi-timeframe Expert Advisor that records tick data for later graphical representation and analysis. General Description
The Tick Data Record offers a(n) alternative/complement to the online/offline price charts displayed through the MT4/MT5 platform. The Expert Advisor permits to write and save the current/history values of Time, Bid, Ask, Spread, Last and Volume to a text file (“.txt”). The idea is to copy/open the obtained register to/in a spr
FREE

This indicator is a perfect tool able to compare which brokers have the lower latency. It shows us immediately which brokers are slower or faster. When you see the dot icon on the line, it means this broker is the faster one and the red line (Broker_A) is the slower one. See the example on the screenshot.
How It Works? This indicator shares the prices information to and from the "shared" common data folder. It compares all the prices. The price is based on average by (Ask + Bid) / 2. There are
FREE

Template Toggle Indicator General Description The Template Toggle indicator is a custom tool for the MetaTrader 4 platform, designed to streamline the process of switching between predefined chart templates. It displays interactive buttons on either the main chart or a sub-window, allowing traders to quickly apply different templates without manually accessing the template menu. Ideal for traders who frequently switch between chart setups for various currency pairs or trading strategies. Key Fea
FREE

Telegram Trading Panel – MT4 utility for order control via Telegram Purpose
Utility for MetaTrader 4 to open/close orders, set SL/TP, create pending orders, and view position info directly from Telegram using inline keyboards. Designed for mobile/VPS use without direct terminal access. Key features Telegram panel with inline keyboards: Open BUY/SELL market orders Close single order or “Close all” Pending orders: Buy/Sell Limit and Buy/Sell Stop with price and expiry Assisted Break Even: set SL a
FREE
MetaTraderマーケットは、履歴データを使ったテストと最適化のための無料のデモ自動売買ロボットをダウンロードできる唯一のストアです。
アプリ概要と他のカスタマーからのレビューをご覧になり、ターミナルにダウンロードし、購入する前に自動売買ロボットをテストしてください。完全に無料でアプリをテストできるのはMetaTraderマーケットだけです。
取引の機会を逃しています。
- 無料取引アプリ
- 8千を超えるシグナルをコピー
- 金融ニュースで金融マーケットを探索
新規登録
ログイン