Channel Builder

4.75

               Channel Builder(CB)またはIvanov Bands指標は、Bollinger Bands指標を広く一般化したものです。これらの一般化は以下の通りです。まず、CBにおいて、平均線<X>が様々な平均化アルゴリズムを用いて計算される。次に、CBでは、平均偏差の計算に異なるコルモゴロフ平均化が使用されます。

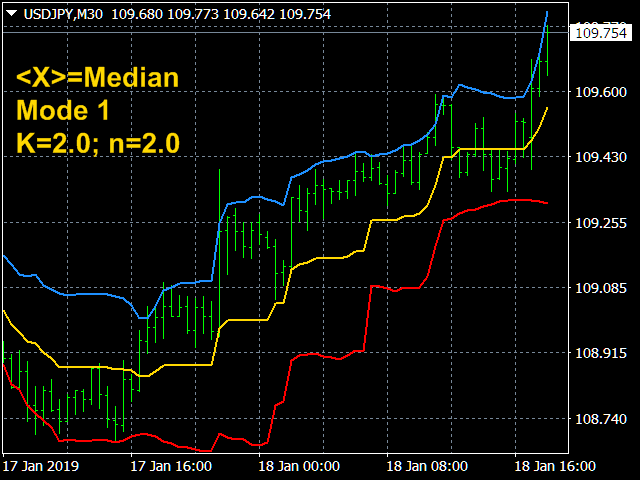
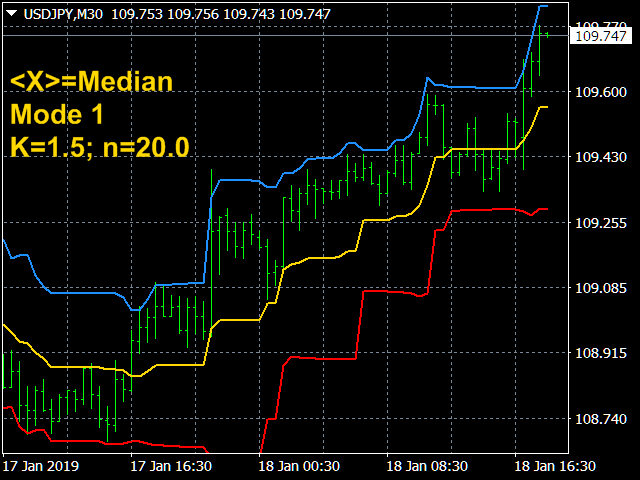
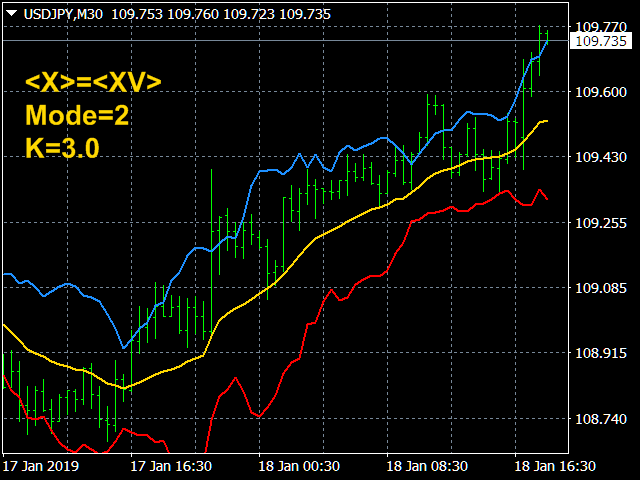
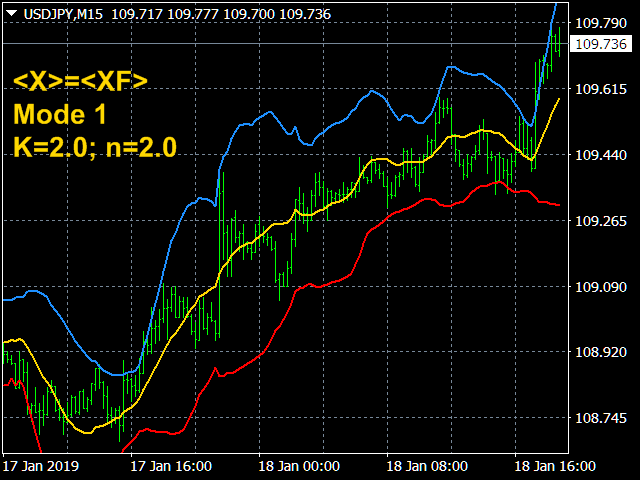
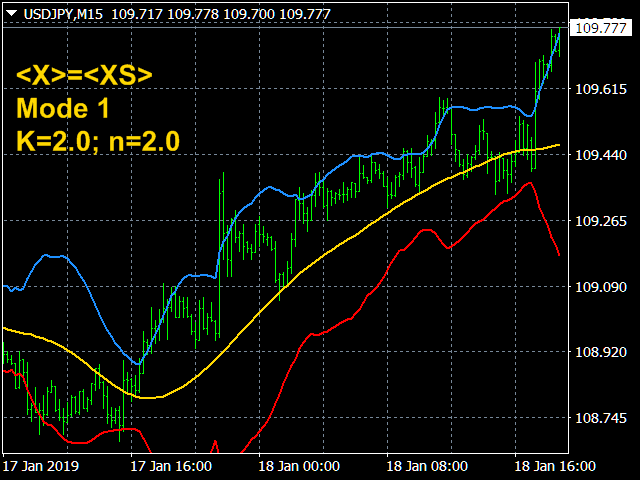
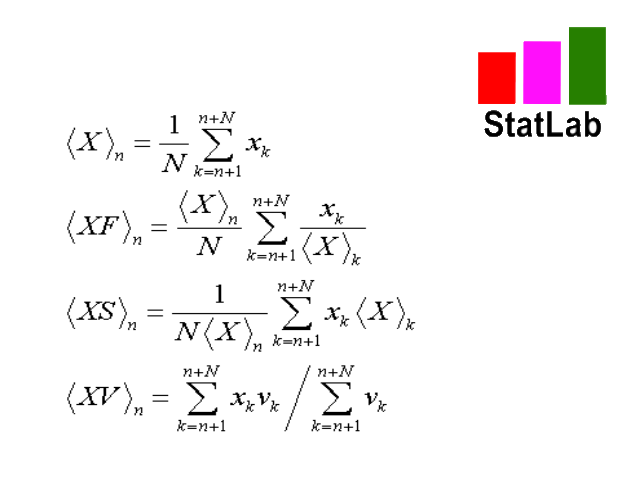
              標準のSMA、EMA、SMMA、およびLWMAの平均化アルゴリズムに加えて、中央の線<X>は、中央値=(最大+最小)/ 2スライディング中央値(既定値)になります。さらに、著者が開発した特別な<XF>(高速)および<XS>(低速)のスライディング平均アルゴリズムを使用して<X>を計算します。これらのアルゴリズムは、変動の激しい通貨市場に存在する貿易集約的な大きなノイズをフィルタリングします。つまり、フィルタリングアルゴリズム<XF>を使用すると、トレンドの始まりをすばやく判断できます。また、フィルタリングアルゴリズム<XS>を使用すると、フラット状態への出力をより適切に決定できます。最後に、CBでは、取引量の重みで移動平均を構築する可能性<XV>も含まれます。             

CBを使用すると、Bollinger Bandsに似た無数の異なるチャンネルを構築できますが、もちろんBollinger Bandsは狭い特別なケースでのみ使用できます。CBは、本質的に、トレーダーによって使用される最も適切な手動または自動戦略を見つけるために、さまざまなチャネルを構築および調査するための実験的なスタンドです。

               CBを使用すると、さまざまな価格動向や変動をフィルタリングできますさまざまなフィルタリングで可能になります。(1) フラットからトレンドへの移行の最も早い瞬間を見つけるまたはその逆  (2)  トレンドからフラットへの移行。チャンネルを構築するときは、できます。(3) 急激な強い価格の急上昇(これは堅牢な方法です)を減らし、より信頼性の高いチャネルの滑らかな線(異常値に対する反応が悪い)を滑らかにします。あるいはその逆。(4) チャンネルをそのような放出に非常に敏感にしてください。それはあなたが価格変動の方向を変えることに関する追加情報の非常に信頼できる情報源として彼らのラインの鋭いねじれを使うことを可能にします。

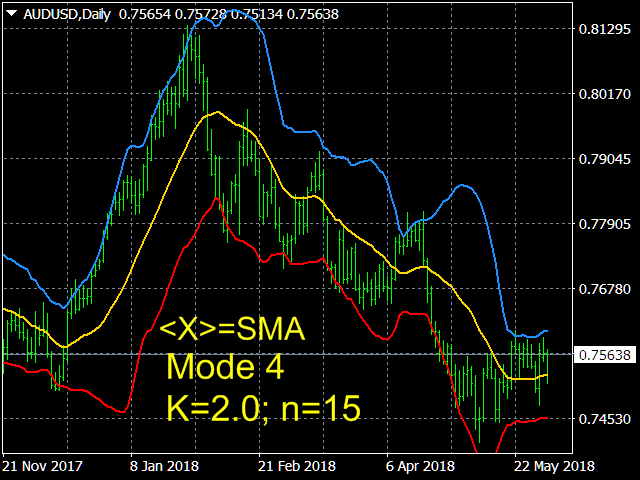
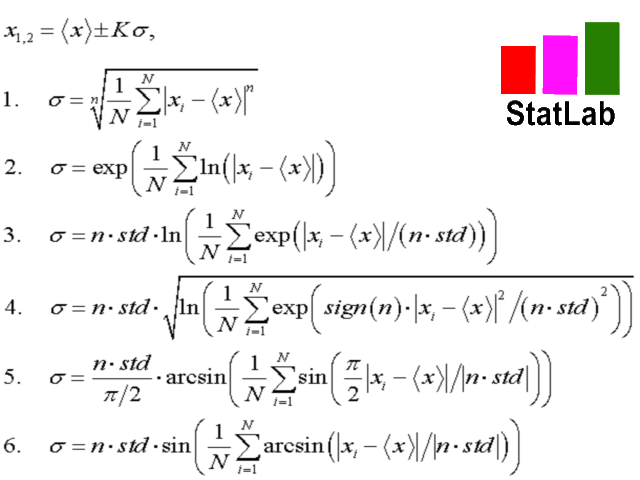
              CB指標は、<X>からの平均偏差を計算するための一般的なアルゴリズムの6つの異なる具体化を使用する。この場合、最初のアルゴリズム - (1)平均電力偏差(指数n = 2の場合、通常の移動平均SMAを使用)のみがボリンジャーバンドラインの構築につながります。さらに、CBには以下の平均偏差を計算するためのアルゴリズムもあります。(2) 対数,  (3) 指数関数  (4) 指数二次, (5) 正弦波と (6) アークシン。各アルゴリズム(対数を除く)は、ロバストモードとリバースモードに設定できます。

CBチャンネルの構築に使用される移動平均と平均偏差の公式は、最後のスクリーンショットに表示されています。

インジケーター設定.

  • Price type  -価格の種類  Close price (デフォルトで), Open price, High price, Low price, Median price  ((high + low)/2),  Typical price ((high + low + close)/3),    Weighted  price  ((high + low + 2*close)/4). 
  • The averaging method  -平均化方法 Simple, Exponential,   Smoothed,  Linear  weighted, Median=(Max+Min)/2 (デフォルトで), <XF>, <XS>, <XV>.
  • Choose simulation Bands mode –平均偏差を計算するためのアルゴリズムの選択。
      •         1. (<(|x - <x>|)^n>)^(1/n)  -  平均パワー (デフォルトで)
      •         2. exp(<ln|x - <x>|>)  -対数平均
      •         3. n*std*ln(<exp(|x - <x>|/(n*std))>)  -  平均指数
      •         4. n*std*sqrt(ln(<exp(sign(n)*((x - <x>)/(n*std*))^2)>)) –指数的に2次の平均        
      •         5. n*std*arcsin(<sin(pi*|x - <x>|/|n*std|/2)>)/(pi/2 )  -  正弦波
      •         6. n*std*sin(<arcsin(|x - <x>|/|n*std|)>)   -  平均角度
  • The averaging period    -  平均化期間  値:任意の整数 (20デフォルトで).
  • Channel width factor  'K'  -チャネル幅の比 任意の実数 (2.0デフォルトで).
  • Exponent 'n'   -   の指数  (1) 電力平均化アルゴリズム  他の平均のスケール係数 (3-6). 0以外の任意の実数 (2.0デフォルトで)
レビュー 8
dimantes
24
dimantes 2025.08.19 12:23 
 

Индикатор Бомба!

jerrylew2020
294
jerrylew2020 2022.08.04 02:12 
 

Excellent work. I use it.

Dr Waleed Mahdy
2652
Dr Waleed Mahdy 2019.11.06 16:55 
 

good

おすすめのプロダクト
GTAS STrend
Riviera Systems
4.5 (2)
GTAS S-Trend is a momentum indicator that helps to determine trends using combination of MACD, RSI and moving averages. This indicator was created by Bernard Prats Desclaux, proprietary trader and ex-hedge fund manager, founder of E-Winvest. Description The indicator oscillates between -65 and +65 with a neutral zone between -25 and +25 around a 0 equilibrium line. S-Trend between -25 and +25 indicates congestion zones with a bullish bias between 0 and +25, and a bearish bias between 0 and -25.
FREE
The Magic SMA indicator is of great help in determining trend direction. It can be an excellent addition to your existing strategy or the basis of a new one. We humans can make better decisions when we see better visually. So we designed it to show a different color for rising and falling trends. Everyone can customize this in the way that suits them best. By setting the Trend Period, we can optimize it for longer or shorter trends for our strategy. It is great for all time frames. IF YOU NEED
FREE
Free automatic Fibonacci is an indicator that automatically plots a Fibonacci retracement based on the number of bars you select on the BarsToScan setting in the indicator. The Fibonacci is automatically updated in real time as new highest and lowest values appears amongst the selected bars. You can select which level values to be displayed in the indicator settings. You can also select the color of the levels thus enabling the trader to be able to attach the indicator several times with differe
FREE
Follow The Line
Oliver Gideon Amofa Appiah
3.94 (16)
FOLLOW THE LINE GET THE FULL VERSION HERE: https://www.mql5.com/en/market/product/36024 This indicator obeys the popular maxim that: "THE TREND IS YOUR FRIEND" It paints a GREEN line for BUY and also paints a RED line for SELL.  It gives alarms and alerts of all kinds. IT DOES NOT REPAINT and can be used for all currency pairs and timeframes. Yes, as easy and simple as that. Even a newbie can use it to make great and reliable trades. NB: For best results, get my other premium indicators for more
FREE
For those who like trend the Force will be a very useful indicator. This is because it is based on the famouse ADX, which measure the strenght of a trend, but without its 3 confusing lines. Force has its very simple interpretation: if the histogram is above zero level the trend is up, otherwise it is down. You can use it to find divergences too, which is very profitable. If you have any doubt or suggestion, please, contact me. Enjoy! MT5 version:  https://www.mql5.com/en/market/product/41928 T
FREE
Free informative Indicator-helper. It'll be usefull for traders who trade many symbols or using grid systems (Averaging or Martingale). Indicator counts drawdown as percent and currency separate. It has a number of settings: Count deposite drawdown according equity value and send e-mail or notifications to user if DD more than set; Sending e-mail when max open orders reached; Shows price and remaining pips amount before MarginCall on current chart and Account generally; Display summary trade lot
FREE
Bitcoin 999
Ahmed Ragab Ramadan Abdelfattah
Bitcoin 999  - is a trend indicator that automatically analyzes the market and provides information about the trend and each of its changes, as well as giving signals for entering trades without redrawing! The indicator uses each candle, analyzing them separately. referring to different impulses - up or down impulse. Exact entry points into transactions for currencies, crypto, metals, stocks, indices!  Main functions: Accurate entry signals WITHOUT REPAINTING! Once a signal appears, it remains
FREE
Persian Ichimoku: The Next Generation of Fibonacci-Enhanced Trading Elevate your Ichimoku strategy with the most advanced and customizable Ichimoku indicator on the Market. The Persian Ichimoku is not just another Ichimoku cloner; it is a professional-grade trading powerhouse designed for traders who demand precision, flexibility, and deeper market insights. By merging classic Ichimoku Kinko Hyo logic with Fibonacci ratios and the innovative Quality Line , this tool redefines trend analysis. ###
FREE
5/35 Oscillator to be used with our Elliott Wave Indicator as part of the overall strategy on trading the 5th wave. The Elliott Wave Indicator Suite is designed around a simple but effective Swing Trading Strategy. The Indicator Suite is great for Stocks, Futures and Forex trading on multiple timeframes You can find the main Elliott Wave Indicator here  https://www.mql5.com/en/market/product/44034
FREE
Three Stochastics
Pavel Zamoshnikov
3.7 (10)
This indicator signals about crossing of the main and the signal lines of stochastic (lower stochastic) in the trend direction which is determined by two stochastics of higher time frames (higher stochastics). It is not a secret that stochastic generates accurate signals in a flat market and a lot of false signals in a protracted trend. A combination of two stochastics of higher time frames performs a good filtration of false signals and shows the main tendency. The indicator is recommended for
FREE
VR Donchian
Vladimir Pastushak
4.87 (15)
VR ドンチャン インジケーターは、ドンチャン チャネルの改良版です。改善はチャネルのほぼすべての機能に影響を与えましたが、主要な動作アルゴリズムとチャネル構造は維持されました。現在のトレンドに応じてレベルの色の変化がボールインジケーターに追加されました。これは、トレーダーにトレンドまたはフラットの変化を明確に示します。スマートフォン、電子メール、または MetaTrader ターミナル自体で 2 つのチャネル レベルのうちの 1 つのブレイクアウトについてトレーダーに通知する機能が追加されました。値札が追加されており、これを利用してトレーダーはチャート上の価格レベルを確認できます。古典的なドンチャン指標の操作アルゴリズムは、トレーダーが指標が計算する期間を自分で設定できるという事実により、最適化され高速化されています。古典的な Donchian インジケーターは、MetaTrader ターミナルで利用可能な履歴全体を計算します。これにより、MetaTrader ターミナルに数学的計算の負荷が大きくかかります。 VR Donchian インジケーターは、トレーダーが設定で設定した金額の
FREE
.....................................hi....................... ................for showing high s and low s and support and resistanses .....................we have a lot of ways............................... it can be helpful for finding trends , higher highs , higher lows , lower highs , lower lows .......................today i write on of thems.......................... ........................you can enter the number of last support and resistanses .........................and it will dra
FREE
We Trade Live Trend Levels  This indicator is a fantastic addition to the We Trade Live Trend Max this helps filter out noise and helps with better entries into a trade this add on is a must have and we use it all the time along side We Trade Live Trend Max this is a fantastic tool to help with entering a trade and exiting a trade,  This indicator Calculates  Volume strength  indicating levels of support and resistance for a trade, measures momentum in a market making buying or selling into the
FREE
HMA Trend
Pavel Zamoshnikov
4.55 (71)
A trend indicator based on the Hull Moving Average (HMA) with two periods. The Hull Moving Average is an improved variant of the moving average, which shows the moment of trend reversal quite accurately. It is often used as a signal filter. Combination of two types of Hull Moving Averages makes a better use of these advantages: HMA with a slow period identifies the trend, while HMA with a fast period determines the short-term movements and signals in the trend direction. Features The movement d
FREE
ZigZag Support Resistance MT4
Emmanuel Tshepang Mosweu
4.67 (3)
This indicator uses the Zigzag indicator to identify swing highs and swing lows in the price chart.    Once it has identified the swing highs and swing lows, it can use them to determine potential support and resistance levels. A support level is formed when the price drops and bounces back up from a swing low, indicating that there is buying pressure at that level. A resistance level is formed when the price rises and reverses downward from a swing high, suggesting selling pressure at that leve
FREE
This indicator finds Three Drives patterns. The Three Drives pattern is a 6-point reversal pattern characterised by a series of higher highs or lower lows that complete at a 127% or 161.8% Fibonacci extension. It signals that the market is exhausted and a reversal can happen. [ Installation Guide | Update Guide | Troubleshooting | FAQ | All Products  |  Get Help ] Customizable pattern sizes Customizable colors and sizes Customizable breakout periods Customizable 1-2-3 and 0-A-B ratios It impl
FREE
PZ Penta O MT4
PZ TRADING SLU
2.33 (3)
The Penta-O is a 6-point retracement harmonacci pattern which usually precedes big market movements. Penta-O patterns can expand and repaint quite a bit. To make things easier this indicator implements a twist: it waits for a donchian breakout in the right direction before signaling the trade. The end result is an otherwise repainting indicator with a very reliable trading signal. The donchian breakout period is entered as an input. [ Installation Guide | Update Guide | Troubleshooting | FAQ | A
FREE
AIS MT4 INDICATOR 5 ALL INCLLUSIVE SET !!!!!!!!!!!!!!!!!!!!!!!!!!!!!!!!!!!!!!!!!!!!!!!!!!!!!!!!!!! ! ! ATTENTION ! LIMITATION OF FREE OFFER PERIOD IS IMPLICIT ! !   ! CONFIRMATION 2024-08-20 20:00                           ! ! !!!!!!!!!!!!!!!!!!!!!!!!!!!!!!!!!!!!!!!!!!!!!!!!!!!!!!!!!!! GUIDE CHAPTER 1 IMPORTANT INFORMATION <1> THIS INDICATOR IS ONE OF THE SERIES OF NEW AIS INDICATORS AIS MT4 INDICATOR 1 =ADVANCED CLASSIC= AIS MT4 INDICATOR 2 =MULTIFRAMES= AIS MT4 INDICATOR 3 =LINES= AIS M
FREE
THIS FREE INDICATOR ALLOWS YOU TO SET THE TIMEFRAME OF THE MA YOU WANT ON YOUR CHART For example, it's very useful if you want to trade the H4 200 SMA using a lower timeframe chart, to identify price reactions such as reversals, Wyckoff schematics, etc. ***Please comment, rate and share it to your friends if you like it*** ------------------------------------------------------------------------- Moving averages are popular technical indicators used to identify trends, support and resistance leve
FREE
The indicator calculates the current spread for each tick using the formula Spread=(ASK-BID)/Point. Schedule of changes in the boundaries spread over the timeframe displayed in a separate window from the date of accession of the indicator. Two lines corresponding to the minimum and maximum spread values are displayed. The indicator window is self-adjusted according to the minimum and maximum values from the moment of launch. The minimum and maximum values for the entire period of the indicator o
FREE
Dynamic MA Trend Zone – Dynamic Moving Average Trend Zone The Dynamic MA Trend Zone is a visually compelling indicator that dynamically tracks changes in market trends. By displaying moving averages on three different price levels (close, high, and low), it creates a color-coded trend zone that clearly indicates the trend’s direction and strength. Features and Functions: - Trend Direction Color Coding: The indicator automatically color-codes the trend zones based on whether the candle’s clos
FREE
Discover the power of precision and efficiency in your trading with the " Super Auto Fibonacci " MT4 indicator. This cutting-edge tool is meticulously designed to enhance your technical analysis, providing you with invaluable insights to make informed trading decisions. Key Features: Automated Fibonacci Analysis: Say goodbye to the hassle of manual Fibonacci retracement and extension drawing. "Super Auto Fibonacci" instantly identifies and plots Fibonacci levels on your MT4 chart, saving you tim
FREE
*This is TradingView indicator converted to mql4* The SuperTrend V indicator is a popular technical analysis tool used to identify trends and potential trend reversals in financial markets. It is based on the concept of the SuperTrend indicator but incorporates additional features and variations. The SuperTrend V indicator uses a combination of price action and volatility to determine the trend direction and generate trading signals. Here are the key components and features of the indicator: Ca
RSI Bands is a powerful indicator which displays an upper and lower band corresponding to the RSI overbought and oversold levels. The band shows what price must be reached during that specific candle in order for the RSI overbought/oversold level to be reached. This is an extremely useful tool for spotting when a trend has begun and when a trend is about to end. The indicator provides buffers, allowing you to use it in your own Expert Advisor. Please message me if you have any questions. CURREN
FREE
Updates 9/12/2023 - If you are looking for the Spock EA, I don't sell it anymore. DM me for more info. 24/10/2023  -  Check out my other products. Starting to roll out some EAs & indicators based on this range. Currently there is no MT5 version. I am using MT4 myself. So I will spend my time mostly to develop more extensive stats for the Stats version and maybe even an EA. But I might  develop a MT5 version. All depends on the demand. Meaning, the more people request it, the bigger the chan
FREE
The indicator identifies when a divergence occurs between price and an indicator or oscillator. It identifies bullish and bearish hidden or regular (classical) divergences. Combined with your own rules and techniques, this indicator will allow you to create (or enhance) your own powerful system. For higher probability setups I can recommend you to use my  Supply Demand indicator  and trade only if the divergence occurs inside a zone. Supply zone for bearish div and demand zone for bullish div. T
FREE
The Auto Fibonacci Indicator is a professional technical analysis tool that automatically draws Fibonacci retracement levels based on the most recent closed Daily (D1) or 4-Hour (H4) candle. These levels are widely used by traders to identify key support , resistance , and trend reversal zones . This version is designed for manual trading and supports a powerful trading strategy using Fibonacci levels combined with a 50-period EMA (Exponential Moving Average) , which you can easily add from MT4
FREE
Schaff Trend Cycleとは Schaff Trend Cycle(STC)は、トレンドの転換点をタイムリーに捉えるために設計されたオシレーター系インジケーターです。従来の移動平均やMACDと比較して、サイクル的な動きとモメンタムを組み合わせることで、トレンドの始まりと終わりをより明確に把握できます。 主な特徴 トレンド転換シグナルの明確化:上昇トレンドではサイクルラインが上向きに、下降トレンドでは下向きに推移します。 レンジ相場でのだましを抑制:サイクル周期を考慮した平滑化処理により、短期的なノイズを減少させます。 パラメーター調整が容易:期間や平滑化係数を変更するだけで、動作感度を初心者から上級者まで幅広く調整可能です。 計算ロジック概要 モメンタムの算出 指定期間の価格変化をもとに、短期および長期のモメンタムを計算します。 サイクル平滑化 モメンタムに対し、二重平滑化(ダブル・スムージング)を適用し、サイクル的な振動成分を抽出します。 正規化処理 0~100の範囲に正規化し、オシレーターとして表示します。 シグナル生成 水平ライン(通常は25と75)を上下に抜
FREE
FFx Fractals
Eric Venturi-Bloxs
4.5 (2)
The purpose of this new version of the MT4 standard indicator provided in your platform is to display in a sub-window multiple timeframes of the same indicator. See the example shown in the picture below. But the display isn’t like a simple MTF indicator. This is the real display of the indicator on its timeframe. Here's the options available in the FFx indicator: Select the timeframes to be displayed (M1 to Monthly) Define the width (number of bars) for each timeframe box Alert pop up/sound/ema
FREE
This is a multi-timeframe version of the popular Hull Moving Average (HMA). The Double HMA MTF Light indicator combines two timeframes on a single chart. The HMA of the higher timeframe defines the trend, and the HMA of the current timeframe defines short-term price movements. The indicator is freely distributed and hasn't audio signals or messages. Its main function is the visualization of price movements. If you need advanced functionality of the HMA multi-timeframe indicator (information ab
FREE
このプロダクトを購入した人は以下も購入しています
Gann Made Easy は、ミスター・ギャンの理論を使用した取引の最良の原則に基づいた、プロフェッショナルで使いやすい外国為替取引システムです。 W・D・ガン。このインジケーターは、ストップロスとテイクプロフィットレベルを含む正確な買いと売りのシグナルを提供します。 PUSH通知を利用して外出先でも取引可能です。 ご購入後、取引方法の説明と優れた追加インジケーターを無料で入手するには、私にご連絡ください! おそらく、ギャンの取引手法についてはすでに何度も聞いたことがあるでしょう。通常、ギャンの理論は初心者のトレーダーだけでなく、すでにある程度の取引経験がある人にとっても非常に複雑なものです。なぜなら、ギャンの取引手法は理論的にはそれほど簡単に適用できるものではないからです。私はその知識を磨き、最良の原則を私の外国為替インジケーターに組み込むために数年を費やしました。 このインジケーターは非常に簡単に適用できます。必要なのは、それをチャートに添付し、簡単な取引推奨事項に従うだけです。このインジケーターは常に市場分析の仕事を行い、取引の機会を探します。適切なエントリーポイントを検出す
PRO Renko Systemは、特別にRENKOチャートを取引するために設計された高精度の取引システムです。 これは、様々な取引商品に適用することができる普遍的なシステムです。 システムは効果的に正確な逆転信号へのアクセスを与えるいわゆる市場の騒音を中和する。 表示器は非常に使いやすく、信号の生成に責任がある1つの変数だけがあります。 あなたは簡単にお好みの任意の取引ツールとレンコバーのサイズにツールを適応させることができます。 私はいつもあなたが私のソフトウェアで収益性の高い取引を支援するために余分なサポートを提供する準備ができています! 私はあなたに幸せで収益性の高い取引をしたいです! ご購入後にご連絡ください! 私はあなたに私のレンコチャートジェネレータを送信します。 私はまた、私の個人的な推奨事項やシステムの他のモジュールを無料で共有します!
M1 SNIPER は使いやすいトレーディングインジケーターシステムです。M1時間足向けに設計された矢印インジケーターです。M1時間足でのスキャルピングのためのスタンドアロンシステムとして、また既存のトレーディングシステムの一部としても使用できます。このトレーディングシステムはM1時間足での取引に特化して設計されていますが、他の時間足でも使用できます。元々、この手法はXAUUSDとBTCUSDの取引用に設計しましたが、他の市場においても役立つと考えています。 インジケーターのシグナルは、トレンドの方向と逆方向に取引できます。インジケーターのシグナルを利用して両方向に取引するのに役立つ特別な取引テクニックをご紹介します。この手法は、特別な動的なサポートとレジスタンスの価格帯を利用することに基づいています。 ご購入後、M1 SNIPER矢印インジケーターをすぐにダウンロードできます。さらに、M1 SNIPERツールのすべてのユーザーに、以下のスクリーンショットに表示されているApollo Dynamic SRインジケーターを無料で提供しています。この2つのインジケーターを組み合わせることで
Advanced Supply Demand
Bernhard Schweigert
4.91 (299)
現在40%オフ 初心者にもエキスパートトレーダーにも最適なソリューション このインジケーターは独自の機能と新しい公式を多数内蔵しており、ユニークで高品質かつ手頃な取引ツールです。このアップデートでは、2つの時間枠ゾーンを表示できるようになります。より長いTFだけでなく、チャートTFとより長いTF(ネストゾーンを表示)の両方を表示できます。すべてのSupply Demandトレーダーの皆さんのお気に召すはずです。:) 重要情報の公開 Advanced Supply Demandの可能性を最大化するには、 https://www.mql5.com/ja/blogs/post/720245 にアクセスしてください。   エントリーまたはターゲットの正確なトリガーポイントを正確に特定できれば取引がどのように改善されるか想像してみてください。新しい基盤となるアルゴリズムに基づいて構築されているため、買い手と売り手の間の潜在的な不均衡をさらに簡単に特定できます。これは、最も強い需要と供給のゾーンと、過去のパフォーマンス(古いゾーンを表示)がグラフィカルに表現されるためです。これらの機能は、最適な
Scalper Inside PRO – Since 2020. An exclusive indicator that utilizes an innovative algorithm to swiftly and accurately determine the market trend. The indicator automatically calculates opening, closing, and profit levels, providing detailed trading statistics. With these features, you can choose the most appropriate trading instrument for the current market conditions. Additionally, you can easily integrate your own arrow indicators into Scalper Inside Pro to quickly evaluate their statistics
After purchase, contact me privately to receive 1 month of free testing with EA Forex Proton! This advanced MT4 trading robot automatically executes signals from any MT4 indicator, including Market Makers. The latest version also includes AI integration, allowing each trade signal to be analyzed using Artificial Intelligence. Live Signal with EA Forex Proton: Click here Market Makers is a powerful price action trading system designed to identify high-probability Buy and Sell opportunities based
Trend Screener
STE S.S.COMPANY
4.79 (95)
トレンドインジケーター、1つのツールに組み込まれたすべての重要なトレンド機能を備えたトレンドトレーディングとフィルタリングのための画期的なユニークなソリューション! これは、すべてのシンボル/商品(外国為替、商品、暗号通貨、インデックス、株式)で使用できる100%再描画されていないマルチタイムフレームおよびマルチ通貨インジケーターです。 期間限定オファー: サポートおよびレジスタンス スクリーナー インジケーターは、たった 65 ドルで永久的にご利用いただけます。(元の価格 250 ドル) (オファー延長) トレンドスクリーナーは、チャート内のドットで矢印トレンドシグナルを提供するインジケーターに続く効率的なインジケーターです。 トレンド分析インジケーターで使用できる機能: 1.トレンドスキャナー。 2.最大利益分析を備えたトレンドライン。 3.トレンド通貨強度メーター。 4.アラート付きのトレンド反転ドット。 5.アラート付きの強いトレンドドット。 6.トレンド矢印 毎日の分析例、毎日のシグナルパフォーマンス...など、トレンドスクリーナーインジケーターを使用して、ここで見つけること
ゴールドラッシュ・トレンド・アロー・シグナル ゴールドラッシュ・トレンド・アロー・シグナル 指標は、XAU/USDにおける高速・短期スキャルパー向けに最適化された、正確でリアルタイムのトレンド分析を提供します。 1分足専用に設計されたこのツールは、明確なエントリーポイントを示す方向矢印を表示し、スキャルパーが変動の激しい市場状況でも自信を持って取引できるよう支援します。 この指標は、PRIMARY(主要)とSECONDARY(補助)のアラート矢印で構成されています。PRIMARYシグナルは、トレンドの方向転換を示す白と黒の方向矢印であり、SECONDARYシグナルは、PRIMARY矢印が示す方向を確認し、潜在的なエントリーポイントを示す青と赤の矢印です。 注意:トレンド方向の変化後にPRIMARYアラート矢印が1つだけ表示される場合、複数のSECONDARY青/赤矢印が表示される点に注意が必要です。SECONDARYシグナルは、シグナル基準を満たす任意のローソク足後に表示されます。したがって、長期的なトレンド移動の場合、画面に多くのSECONDARY矢印が表示されます(添付の
NAM Divergences
NAM TECH GROUP, CORP.
5 (1)
MT4マルチタイムフレームの発散と売られ過ぎ/売られ過ぎの検出インジケーター。 特徴 -チャートコントロールパネルで完全にカスタマイズ可能で、完全な相互作用を提供します。 -必要な場所でコントロールパネルを表示および非表示にします。 -資本化されていない発散に関するリアルタイムの情報。 -売られ過ぎ/売られ過ぎの状況に関するリアルタイム情報。 -定期的な発散に関するリアルタイムの情報。 -隠れた発散に関するリアルタイム情報。 -発散検出に使用できる発振器:AO、RSI、CCI、MACD、STOCH、RMI、TDI、RSIOMA。 -通知サービス(画面アラート|プッシュ通知)。 概要 発散取引を使用すると、弱体化傾向や勢いの逆転を見つけるのに役立ちます。トレンドが続くためのシグナルとして使用できる場合もあります。私たちのツールは、チャートを可能な限りクリーンに保つために、表示と非表示の可能性を備えた驚くほど快適で直感的なコントロールパネルで、すべての時間枠で同時に発散検出を提供します。 選択した履歴期間に、買われ過ぎと売られ過ぎの状況、通常の相違、隠れた相違
Super Signal – Skyblade Edition プロ仕様のノンリペイント / ノーラグ・トレンドシグナルシステム。卓越した勝率を実現 | MT4 / MT5 対応 1分足、5分足、15分足などの低い時間足で最も効果を発揮します。 主な特徴: Super Signal – Skyblade Edition は、トレンド取引に特化したスマートなシグナルシステムです。マルチレイヤーのフィルターロジックを用いて、明確な方向性と実際のモメンタムに支えられた強力なトレンドのみを検出します。 このシステムは 天井や底を予測するものではありません 。次の3つの条件がすべて満たされた場合にのみシグナルを発生させます: 明確なトレンド方向 モメンタムの増加 健全なボラティリティ構造 市場セッションに基づく流動性分析と組み合わせることで、シグナルの精度とタイミングがさらに向上します。 シグナルの特性: すべての矢印シグナルは 100% 非リペイント / 遅延なし 一度出現したシグナルは固定され、点滅・消失しません チャート上の矢印、情報パネル、ポップアップ通知、音声アラート、プッシュ通知
Auto Optimized Parabolic RSI: 高度な3Dモメンタムエンジン ほとんどのリテール向けインジケーターは、市場のボラティリティが変化した瞬間に破綻する静的な入力値に依存しているため、失敗に終わります。Auto Optimized Parabolic RSIは、自らの数学的優位性を継続的に再計算することで「インジケーターの陳腐化」問題を解決し、機関投資家レベルの定量的適応力をMT5ターミナルに直接もたらします。 最大の強み: カスタムインメモリ3D最適化   標準的な自動最適化ツールは、インジケーターの呼び出しで端末に過負荷をかけるため、頻繁にMT5プラットフォームをフリーズさせます。本ツールは、このボトルネックを完全に回避しています。RAMベースのカスタムネイティブ計算機を内蔵した内部エンジンは、チャートを読み込んだりタイムフレームを変更したりするたびに、超高速の3Dグリッド探索を実行します。RSI期間(頻度)、SARステップ(加速度)、SAR最大値(制限速度)を同時にスイープし、プラットフォームを遅延させることなく、数万通りものパラメーターの組み合わせを絶対的
Apollo SR Master は、サポート/レジスタンスゾーンを利用した取引をより容易かつ確実にする特別な機能を備えたサポート/レジスタンスインジケーターです。このインジケーターは、ローカル価格の高値と安値を検出することで、タイムラグなしでリアルタイムにサポート/レジスタンスゾーンを計算します。そして、新たに形成されたSRゾーンを確認するために、インジケーターは特別なシグナルを表示します。このシグナルは、SRゾーンを実際の売りまたは買いシグナルとして考慮して使用できることを示します。この場合、SRゾーンの強度が高まり、SRエリアからの取引が成功する確率も高まります。これがこのインジケーターの基本的な考え方です。 SRゾーンは、ストップロスとテイクプロフィットの設定を容易にします。シグナルの方向に応じて、SRゾーンの上または下のスペースをストップロスとして設定できます。さらに、反対側のSRゾーンは、潜在的なテイクプロフィットエリアとして設定できます。 また、Apollo SRマスターインジケーターをご利用のすべてのユーザーには、「Apollo Price Action System」
現在40%オフ 初心者やエキスパートトレーダーに最適なソリューション! このインジケーターは、独自の機能と新しい計算式を取り入れた、ユニークで高品質、かつ手頃な価格のトレーディングツールです。たった1枚のチャートで28の為替ペアの通貨強度を読み取ることができます。新しいトレンドやスキャルピングチャンスの引き金となるポイントを正確に特定することができるので、あなたのトレードがどのように改善されるか想像してみてください。 ユーザーマニュアルはこちら  https://www.mql5.com/en/blogs/post/697384 これが最初の1本、オリジナルだ! 価値のないクローンを買わないでください。 特別な サブウィンドウの矢印で強い通貨の勢いを表示 GAPがあなたのトレードを導く! 基準通貨や気配値が売られすぎ・買われすぎのゾーン(外相フィボナッチレベル)にあるとき、個別チャートのメインウィンドウに警告表示。 通貨がレンジの外側から反落した場合、プルバック/リバーサルのアラート。 クロスパターンの特別なアラート 複数の時間枠を選択可能で、トレンドを素早く確認できます
「 Dynamic Scalper System 」インジケーターは、トレンド波の中でスキャルピング取引を行う手法のために設計されています。 主要通貨ペアと金でテスト済みで、他の取引商品との互換性があります。 トレンドに沿った短期的なポジションオープンのシグナルを提供し、追加の価格変動サポートも提供します。 インジケーターの原理 大きな矢印はトレンドの方向を決定します。 トレンド波の中では、小さな矢印の形でスキャルピングシグナルを生成するアルゴリズムが機能します。 赤い矢印は強気方向、青い矢印は弱気方向です。 トレンドの方向には敏感な価格変動ラインが描かれ、小さな矢印のシグナルと連動します。 シグナルは次のように機能します。適切なタイミングでラインが現れるとエントリーシグナルが形成され、ラインが開いている間はポジションが保持され、完了すると取引が終了します。 推奨される動作時間枠はM1~H4です。 矢印は現在のローソク足に形成され、次のローソク足が開いている場合は、前のローソク足の矢印は再描画されません。 入力パラメータ Trend Wave Period - トレンド方向
Ultimate Sniper Dashboard
Hispraise Chinedum Abraham
4.82 (22)
299ドルで割引中! 今後値上げの可能性あり! 下の説明を読んでください! 究極のスナイパーダッシュボードのための最高のエントリーシステム。究極のダイナミックレベル。(私の製品をチェックしてください) 究極のスナイパーダッシュボードはMT4多通貨テスト制限のため、ライブマーケットでのみ作動します。 究極のスナイパーダッシュボードをご紹介します。HA-Sniper、MA-Sniper、その他多くの特別なモードが含まれる最高の製品です。究極のスナイパーダッシュボードは絶対的な獣です! 初心者やエキスパートトレーダーにとって最高のソリューションです。もう二度と動きを見逃さない! シンプルさとピップを愛するトレーダーのために、特別な製品をご用意しました。シンプルでありながら、ダッシュボードは複数のカスタムアルゴリズムに基づき28の通貨ペアを監視し、すべての作業を行います。たった一つのチャートで、プロのように市場を読み解くことができます。もし、為替ペアが動き出したときに、その方向性を正確に特定することができれば、あなたの取引はどれほど改善されることでしょう。   当社のシステムは、高い確率
通貨強さウィザードは、取引を成功させるためのオールインワン ソリューションを提供する非常に強力な指標です。このインジケーターは、複数の時間枠のすべての通貨のデータを使用して、このまたはその外国為替ペアのパワーを計算します。このデータは、使いやすい通貨インデックスと通貨パワーラインの形式で表され、特定の通貨のパワーを確認するために使用できます。 必要なのは、取引したいチャートにインジケーターを接続することだけです。インジケーターは、取引する通貨の実際の強さを示します。このインジケーターは、トレンドに合わせて取引するときに有利に利用できる売買高の圧力の極値も示します。このインジケーターには、フィボナッチに基づく可能なターゲットも表示されます。 このインジケーターは、PUSH 通知を含むあらゆるタイプのアラートを提供します。 購入後ご連絡下さい。私の取引のヒントをあなたと共有し、素晴らしいボーナスインジケーターを無料で提供します! 幸せで有益な取引をお祈りします。
まず第一に、この取引インジケーターは再描画されず、再描画されず、遅延しないことを強調する価値があります。これにより、手動取引とロボット取引の両方に理想的なものになります。 ユーザーマニュアル:設定、入力、戦略。 アトミックアナリストは、価格の強さとモメンタムを利用して市場でより良いエッジを見つけるためのPA価格アクションインジケーターです。ノイズや誤ったシグナルを除去し、取引ポテンシャルを高めるための高度なフィルターを備えています。複雑なインジケーターの複数のレイヤーを使用して、アトミックアナリストはチャートをスキャンし、複雑な数学的計算をシンプルなシグナルと色に変換します。これにより、どのような初心者トレーダーでも理解して使用し、一貫した取引の決定を行うことができます。 「アトミックアナリスト」は、新規および経験豊富なトレーダー向けにカスタマイズされた包括的な取引ソリューションです。プレミアムインジケーターとトップノッチの機能を1つの取引戦略に組み合わせ、すべてのタイプのトレーダーにとって汎用性のある選択肢にします。 デイリートレーディングとスキャルピング戦略:高速で正確な
BTMM State Engine Pro is a MetaTrader 4 indicator for traders who use the Beat The Market Maker approach: Asian session context, kill zone timing, level progression, peak formation detection, and a multi-pair scanner from a single chart. It combines cycle state logic with a built-in scanner dashboard so you do not need the same tool on many charts at once. What it does Draws the Asian session range; session times can follow broker server offset or be set in inputs. Tracks level progression (L
推測をやめて、統計的優位性を持って取引を始めましょう 株価指数はFXとは異なる動きをします。決まったセッションがあり、オーバーナイトでギャップが発生し、予測可能な統計パターンに従います。このインジケーターは、DAX、S&P 500、ダウ・ジョーンズなどの指数を自信を持って取引するために必要な確率データを提供します。 何が違うのか ほとんどのインジケーターは何が起こったかを示します。このインジケーターは次に何が起こる可能性が高いかを示します。毎取引日、インジケーターは100日間のヒストリカルデータに対して現在のセットアップを分析します。類似のギャップ、類似のオープニングポジションを持つ日を見つけ、価格が主要なレベルに到達した頻度を正確に計算します。ギャップが埋まるか、昨日の高値がテストされるかの推測はもう必要ありません。実際のデータに基づいた正確なパーセンテージが得られます。 すべての入力パラメータを説明した完全なマニュアルはこちら: https://www.mql5.com/en/blogs/post/766370 優れたセットアップを見つけるための戦略ガイドはこちら: https:/
多くの矢印インジケーターは、シグナルだけを表示して、その後の判断はすべてトレーダー任せです。KT Alpha Hunter Arrows は、最初から完成されたトレードプランを提供します。 各シグナル矢印が表示されると、エントリーライン、ストップロス、4つのテイクプロフィット水準、そして現在の銘柄と時間足を今トレードする価値があるかを示すリアルタイムのエッジ判定が、チャート上にまとめて描画されます。付属の Trade Manager EA は、手動でエントリーした後の管理をサポートし、相場が荒れて感情が揺れやすい場面でも、トレードの規律を保ちやすくします。リペイントなし。確定足のみでシグナルを表示。Forex、ゴールド、指数、その他あなたが取引するあらゆる銘柄向けに設計されています。 主な機能 リペイントしない買い・売り矢印。シグナルは足が確定した後にのみ表示されます。 各シグナルにエントリーライン、構造的なストップロス、4つのテイクプロフィット水準を表示。 Edge Dashboard が、現在のチャート上で買いと売りのセットアップを個別に評価。 判定システム:No Edge、Ma
Dynamic Forex28 Navigator - 次世代の Forex 取引ツール。 現在 49% オフ。 Dynamic Forex28 Navigator は、長年人気のインジケーターを進化させたもので、3 つの機能を 1 つにまとめています。 Advanced Currency Strength28 インジケーター (レビュー 695 件)  + Advanced Currency IMPULSE with ALERT (レビュー 520 件) + CS28 コンボ シグナル (ボーナス)。 インジケーターの詳細 https://www.mql5.com/en/blogs/post/758844 次世代の Strength インジケーターが提供するもの  オリジナルで気に入っていたすべての機能が、新機能と精度の向上によって強化されました。 主な機能: 独自の通貨強度計算式。 すべての時間枠でスムーズかつ正確な強度ライン。 トレンドの特定と正確なエントリーに最適です。 ダイナミックマーケットフィボナッチレベル (マーケットフィボナッチ)。 このインジケーターに固有
現在40%オフ! 初心者やエキスパートトレーダーに最適なソリューション! このインジケータは、独自の機能と秘密の数式を組み込んだ、ユニークで高品質かつ手頃な価格のトレーディングツールです。たった1枚のチャートで28の通貨ペアのアラートを表示します。新しいトレンドやスキャルピングチャンスの引き金となるポイントを正確に把握することができるので、あなたのトレードがどのように改善されるか想像してみてください! 新しい基本的なアルゴリズムに基づいて構築されているため、潜在的な取引の特定と確認がより簡単になります。これは、通貨の強さや弱さが加速しているかどうかをグラフィカルに表示し、その加速のスピードを測定するためです。加速すると物事は明らかに速く進みますが、これはFX市場でも同じです。つまり、反対方向に加速している通貨をペアにすれば、利益を生む可能性のある取引を特定することができるのです。 通貨の勢いを示す縦の線と矢印は、あなたの取引の指針となるでしょう。 ダイナミックマーケットフィボナッチ23レベルはアラートトリガーとして使用され、市場の動きに適応します。もしインパルスが黄色のトリガ
- Real price is 80$ - 50% Discount (It is 39$ now) - just for 2 purchases. Contact me for instruction, add group and any questions! - Non-repaint - I just sell my products in Elif Kaya profile, any other websites are stolen old versions, So no any new updates or support. - Lifetime update free Related product:   Bitcoin Expert Introduction The breakout and retest strategy is traded support and resistance levels. it involves price breaking through a previous level.  The break and retest strateg
現在40%OFF! このダッシュボードは、複数のシンボルと最大9つのタイムフレームで動作するソフトウェアの非常に強力な部分です。 このソフトは、弊社のメインインジケーター(ベストレビュー:Advanced Supply Demand)をベースにしています。    Advanced Supply Demand ダッシュボードは、素晴らしい概要を提供します。それは示しています。  ゾーン強度評価を含むフィルタリングされた需給値。 ゾーン内/ゾーンへのPips距離。 ネストされたゾーンがハイライトされます。 選択されたシンボルの4種類のアラートを全ての(9)時間枠で提供します。 それはあなたの個人的なニーズに合わせて高度に設定可能です。 あなたの利益! すべてのトレーダーにとって最も重要な質問です。 市場に参入するのに最適なレベルはどこか? 成功のチャンスとリスク/リターンを得るために、強力な供給/需要ゾーン内またはその近くで取引を開始します。 損切りの最適な位置はどこですか? 最も安全なのは、強力な供給/需要ゾーンの下/上にストップを置くことです。 最適な利益
FX Volume
Daniel Stein
4.63 (38)
FX Volume:ブローカー視点で捉える本物の市場センチメント クイック概要 トレード手法をさらに高めたいとお考えですか? FX Volume は、リテールトレーダーやブローカーのポジション状況をリアルタイムで提供します。これは、COTのような遅延レポートよりもはるかに早く知ることができます。安定した利益を目指す方も、さらなる優位性を求める方も、 FX Volume は大きな不均衡を見極め、ブレイクアウトを確認し、リスク管理を洗練させるのに役立ちます。今すぐ始めて、実際の出来高データがどのように意思決定を変革するかを体感してください! 1. FX Volume がトレーダーにとって非常に有益な理由 高精度の早期警戒シグナル • 各通貨ペアを売買しているトレーダー数を、他者よりも早く、ほぼリアルタイムで把握できます。 • FX Volume は、複数のリテールブローカーから得られる本物の出来高データを収集し、分かりやすい形式で提供する 唯一 のツールです。 強力なリスク管理 • ロングやショートの大きな偏り(インバランス)を特定し、潜在的なトレンド転換を見逃しません。ストップ
説明書(ロシア語)  /  説明書 (英語)  /  バージョン MT5 主な機能: 売り手と買い手のアクティブなゾーンを表示します。 このインジケーターは、買いと売りの適切な最初のインパルスレベル/ゾーンをすべて表示します。これらのレベル/ゾーンがアクティブになると、エントリーポイントの探索が始まり、レベルの色が変わり、特定の色で塗りつぶされます。状況をより直感的に把握できるように、矢印も表示されます。 LOGIC AI - テンプレートをアクティブ化するときにエントリポイントを検索するためのゾーン(円)の表示 視認性を向上させるため、人工知能を用いて進入ポイントを探索したゾーンを表示する機能が追加されました。 より高い時間枠からのレベル/ゾーンの表示(MTFモード) より長い時間間隔でレベル/ゾーンを表示する機能を追加しました。また、インジケーターに自動トレンド検出機能(   TPSproTREND PRO   )を実装しました。 取引のための個別の専門的なステップバイステップのアルゴリズム このアルゴリズムは、トレンドの方向と逆方向の両方でデイトレードを行うために設計されていま
Cycle Sniper
Elmira Memish
4.39 (36)
Please contact us after your purchase and we will send you the complimentary indicators to complete the system Cycle Sniper is not a holy grail but when you use it in a system which is explained in the videos, you will feel the difference. If you are not willing to focus on the charts designed with Cycle Sniper and other free tools we provide, we recommend not buying this indicator. We recommend watching the videos about the indiactor and system before purchasing. Videos, settings  and descri
単純なドラッグアンドドロップEAでMetatrader4をPythonに接続するためのドキュメント。 完全にテストされた、高速で効率的な完全なエンドツーエンドソリューション! Pytraderエコシステムは、PythonスクリプトとMT4またはMT4EAで構成されています。 さらに、ライセンス供与にはインジケーターが使用されます。 PythonスクリプトとEAの間の通信は、ソケットに基づいています。 EAはサーバーであり、Pythonスクリプトはクライアントです。 それは常にquery(関数/ pythonスクリプト)とoutput(データ/サーバー)です。 EAは、Pythonスクリプトが実行されているのと同じコンピューターで実行する必要はありません。 Githubリンクには、Pythonスクリプト、EA、完全なドキュメント、および関数の呼び出し方法を示すPytraderサンプルスクリプトがあります。 質問については、不和チャンネルもあります。 デモ(ライセンスインジケーターなし)でも全機能がありますが、機器の数は限られています (EURUSD、AUDCHF、NZDCHF、GBP
Route Lines Prices -は、価格の方向性を予測するために設計されたインジケーターです。シンプルなインターフェースには、価格変動と将来の方向性を計算するための複数のアルゴリズムが搭載されています。これらのアルゴリズムには、使用する時間枠に基づいたボラティリティ計算と価格平滑化が含まれています。 このインジケーターには、「 Calculating price values 」値を変更するためのパラメーターが1つだけあります。デフォルト値の1は、バランスの取れた自動計算を提供し、インジケーターを手動で設定することなく使用できます。 値を2から500まで手動で変更することで、インジケーターを独自のトレーディングシステムに合わせてカスタマイズできます。 このインジケーターは、M1からH4の時間枠での使用を推奨します。あらゆる取引銘柄で使用できます。 シグナル矢印はローソク足の終値で生成され、過去の履歴には再描画されません。 メインチャートには、重複した矢印が表示されます。 複数のアラートタイプが利用可能です。内蔵のライン軌跡カウンターは、終値に基づいて動作します。これ
Volatility Trend System - a trading system that gives signals for entries. The volatility system gives linear and point signals in the direction of the trend, as well as signals to exit it, without redrawing and delays. The trend indicator monitors the direction of the medium-term trend, shows the direction and its change. The signal indicator is based on changes in volatility and shows market entries. The indicator is equipped with several types of alerts. Can be applied to various trading ins
作者のその他のプロダクト
Identify Trend
Aleksey Ivanov
4.13 (24)
トレンドの識別インジケータを使用すると、非常に正確に、そして最も重要なこととして、わずかな遅延で、(1)真のトレンドの動きの開始、および(2)フラットを識別できます。このような指標は、スキャルパー戦略による取引と長期取引戦略の使用の両方に使用できます。インディケーター操作アルゴリズムは、最後のスクリーンショットで詳しく説明されています。                              指標の読みは視覚的で非常に単純で、コメントを必要としません。インディケータの青い線は上昇トレンドを表し、金色の線はフラット、そして赤い線は下降トレンドです。したがって、赤または金の線が青に置き換えられた場合はBuyのエントリポイント、青または金の線が赤に置き換えられた場合はSell   - のエントリポイントです。               このインディケータにはあらゆる種類の警告があります。(トレンド方向の)インジケーターの表示が最後の2つのバーに一致すると、アラートがアクティブになります。                価格の動きの方向が変化する可能性のある瞬間も
FREE
Absolute Bands
Aleksey Ivanov
4.67 (3)
Principles of construction of the indicator.               The Absolute Bands (AB) indicator is reminiscent of the Bollinger Bands indicator with its appearance and functions, but only more effective for trading due to the significantly smaller number of false signals issued to them. This effectiveness of the Absolute Bands indicator is due to its robust nature.               In the Bollinger Bands indicator, on both sides of the moving average - Ma, there are lines spaced from Ma by the standa
FREE
The TrueChannel   indicator shows us the true price movement channels. This indicator resembles Donchian Channel   in its appearance, but is built on the basis of completely different principles and gives (in comparison with Donchian Channel , which is better just to use to assess volatility) more adequate trading signals.              As shown in the article , the price actually moves in channels parallel to the time axis and jumps abruptly from the previous channels to the subsequ
FREE
Indicator description.            The “ Alligator Analysis ” ( AA ) indicator allows you to build various (by averaging types and by scales) “ Alligators ” and their combinations, i.e. allows you to analyze the state of the market based on the correlation of this state with a whole range of different " Alligators ".  The classic " Alligator " by Bill Williams is based on moving averages and Fibonacci numbers, which makes it one of the best indicators now. The classic " Alligator "   is based on
FREE
PDP indicator is used for: defining price probability distributions. This allows for a detailed representation of the channel and its borders and forecast the probability of a price appearing at each segment of its fluctuations; defining the channel change moment. Operation principles and features PDP analyzes a quote history on lower timeframes and calculates a price probability distribution on higher ones. Forecast algorithms allow the indicator to calculate probability distributions and mov
Signal Bands is a sensitive and convenient indicator, which performs deep statistical processing of information. It allows to see on one chart (1) the price trend, (2) the clear price channel and (3) latent signs of trend change. The indicator can be used on charts of any periods, but it is especially useful for scalping due to its high sensitivity to the current market state. The functions of the indicator : First, the Signal Bands indicator draws channels into which all price fluctuations exa
Iterative Moving Average – IMA.   IMA is obtained by correcting the usual   MA.   The correction consists in addition   to MA averaged difference between the time series (X) and its MA, i.e.   IMA(X)=MA(X) + MA ( Х -MA(X)). Correction is done in several iterations (and, exactly, 2 iterations in this indicator) and with a change in the averaging period.               As a result, the time-series points begin to cluster around (on all sides) of the getting   IMA and with a smaller de
Structure of the indicator.               The Cunning crocodile indicator consists of three moving averages (applied to the price   Median price   = (high + low)/2 ) :   1) the usual MA ( SMA , EMA , SMMA ,   LWMA )  or the mean <X> of the process X and her two generalizations 2) <XF> = <X / <X >> * <X> and 3) <XS> = <X * <X >> / <X> with the same averaging period. All three curves intersect at common points that (such an intersection in which the cunning crocodile, unlike the usual one, "never
敏感なシグナル指標はあなたが高い確率で本当の傾向の動きの始まりを設定することを可能にしま。著者によって開発されたフィルタリングは数回の反復で実行され、通常の価格変動の正確な軌跡(より正確にはそのような変動の最も可能性の高い曲線)を明らかにしてそれを描きます。 同時に、通貨ペアの引用符のランダムな動きがフィルタリングされます。 このようなフィルタリングは、信号が常に非常にノイズが多い外国為替市場での取引に非常に効果的です。            指標の読みは視覚的で非常に単純であり、コメントを必要としません。 青い三角形は価格変動の通常の要素の上昇トレンドにあり、赤い三角形は下降トレンドにあります。したがって、赤の三角形が青に置き換えられた場合のBuyのエントリポイントと、逆にSell   - のエントリポイント。 インジケーターの感度のレベルは « Select sensitivity level» の設定で調整。 インジケーターは、TakeProfitを、シグナル後の価格が到達する可能性が最も高い値と見なします。 同時に、感度レベルを上げると、信号の遅延が
I present an indicator for professionals. ProfitMACD is very similar to classic MACD in appearance and its functions . However, ProfitMACD is based on completely new algorithms (for example, it has only one averaging period) and is more robust, especially on small timeframes, since it filters random price walks. The classic MACD indicator (Moving Average Convergence / Divergence) is a very good indicator following the trend, based on the ratio between two moving averages, namely the EM
The principle of the indicator.               A simple moving average (SMA) with an averaging period (2n + 1) of bars is always obtained lagging by n bars. If SMA or other types of moving averages are the basis for making trading decisions, then their strong delay does not allow   to open positions in time and close positions, which leads to losses.                            The Estimation moving average without lag ( EMAWL ) indicator calculates the non-lagging moving average, which is calcula
The principle of the indicator.               The Strong Trend Flat Signal (STFS) indicator is the intersection of two, developed by the author, non-lagging moving averages with averaging periods 21 and 63.               A simple moving average (SMA) with an averaging period (2n + 1) of bars is always obtained lagging by n bars. If SMA or other types of moving averages are the basis for making trading decisions, then their strong delay does not allow  to open positions in time and close positio
The principle of the indicator.               The StatChannel ( SC ) indicator is a development of the Bollinger Bands indicator ( ВВ ).  BB is a moving average, on both sides of which two lines are drawn, separated from it by standard deviations std multiplied by the corresponding coefficient. At the same time, a moving average with an averaging period (2n + 1) bars is always obtained lagging behind n bars.  Sliding std is also lagging behind on n bars, also calculated by (2n + 1) points. Such
はじめに             StatPredictインディケータは、一般的なトレンドのトレンドとこのトレンドの周りのそれ自身の小さな統計的な価格変動に従って価格を予測します。 StatPredictでは、予測の期間を設定する必要があります。予測期間は、インジケーター設定の「バーの予測の長さ」パラメーターで設定されます。 (« Length of forecast in bars» ) 予測期間は、現在のトレンドトレンドの特徴的な時間スケールに対応する必要があります。トレンドのタイムスケールは、指標ProfitMACDによって最もよく測定されます。              チャートにインストールした後の指標の読みの最終計算は、新しいティックが到着したときに行われます。              インジケータの動作モードに関する情報は、「エキスパート」タブのチャートにインストールされると印刷されます。         1. 指標の目的.              ランダムプロセスを予測するための数学的方法を使用して、StatPredict指標は将来の価格の最も可能性の高い値を予測し
The principle of the indicator.                             The Asummetry  indicator allows you to predict the beginning of a change in the direction of trends, long before their visual appearance on the price chart.               The author statistically revealed that before changing the direction of the trend, the probability distribution function of the price is made as asymmetric as possible. More precisely, the price movement in any direction always pulls sideways the function of its dist
Indicator is used for: defining price probability distributions. This allows for a detailed representation of the channel and its borders and forecast the probability of a price appearing at each segment of its fluctuations; defining the channel change moment.   Operation principles and features Indicator analyzes a quote history on lower timeframes and calculates a price probability distribution on higher ones. Forecast algorithms allow the indicator to calculate probability distributions and m
The Identify Market State   indicator allows you to set the beginning of a new trends and pullbacks on an existing trend. This indicator can be used both for trading on scalper strategies and for long-term trading strategies.               The indicator is based on the 14 periodic DeMarker   indicator and the 8 periodic simple moving average from this indicator. Statistical studies have shown that the sharp peaks of the DeMarker   indicator curve when they drop below its minimum li
The Signal Envelopes   indicator uses the robust filtering method based on: (1) the moving median Buff0 = <Median> = (Max {x} + Min {x}) / 2 and (2) the averaging algorithm developed by the author Buff1 = <(<Median> ) ^ (- 3)> * (<Median>) ^ 4  based on the moving median. The Signal Envelopes   indicator allows you to most accurately and with the minimum possible delay set the beginning of a new trend.  The Signal Envelopes indicator can be used both for trading according to scalpe
The principle of constructing indicator lines .               Profit Trade  indicator is very effective for trading. Profit Trade  is a deep development of the well-known Donchian channel  indicator. The upper (BlueViolet color) Dup and the lower (IndianRed) Ddn lines of the indicator are constructed in the same way as in the Donchian channel , based on the highest (high of High) and lowest (low of Low) prices for the previous n1 = 20 periods. The middle line (Gold) Dm is constructed in the sam
The principle of constructing indicator lines and their meaning .               The Signal Channel   indicator uses a robust filtering method based on two moving medians applicable to the High and Low prices, i.e. the lines <High> and <Low>, where <..> is the sign of linear averaging, which are shifted by certain values ​​in an uptrend and by opposite values ​​in a downtrend, which allows you to get a narrow channel, approximately outlining each bar. Sharp kinks of the lines of such a channel a
The Robust filter   indicator is based on the robust filtering algorithm developed by the author using the multi-period averaged moving median. The algorithm for this averaging is shown in the last screenshot.                The indicator calculates and shows: 1. The direction of the trend; 2. Entry and exit points of positions; 3. StopLoss   lines calculated from current price probability distributions and selected probability of closing an order by StopLoss before the trend revers
This   indicator is intended for professionals assessing fundamental market trends.  This indicator calculates the index of any instrument and analyzes it.              The index of the state currency shows the real purchasing power of this currency, and the dynamics of this index shows the dynamics of the economic state of the corresponding state. An analysis of the indices of both currencies included in a currency pair makes it much more reliable to identify the trend of this cur
The Multicurrency Trend Detector ( MTD ) indicator allows you to immediately and on one chart on a selected time interval (extending from a zero bar to a bar set in the settings by the value horizon) determine the presence, direction and strength of trends in all major currencies, as well as assess the reliability of these trends.               This is achieved by calculating indices (non-relative purchasing power) of eight major currencies, namely: AUD, CAD, CHF, EUR, GBP, JPY, NZ
The StatZigZag  indicator looks like a regular ZigZag , but is built on the basis of completely different algorithms. The StatZigZag  indicator is a broken line built from segments of regression lines of different lengths, the beginning of each of which comes from the end of the previous segment. Each regression segment is built until the variance or spread of price around it begins to exceed a certain critical value, after which the construction of this segment ends and the constr
The Velocity of price change   ( VP ) indicator shows the average rate of price change at those characteristic time intervals where this rate was approximately constant. The robust algorithm used in VP   to smooth out the price from its random jumps, ensures the reliability of the indicator reading, which does not react to simple price volatility and its insignificant movements.             The indicator allows you to track trends and the moments of their reversals , during which t
チャートに表示されるトレンドは、必ずしも利益をもたらすことができるトレンドではありません。2種類のトレンドがあります:  1)   安定しているため、トレーダーに信頼できる利益を提供できる基本的な経済的理由によって引き起こされる真のトレンド;  2)    誤ったトレンドセクション。トレンドのように見え、価格を(主に)一方向にシフトする一連のランダムイベントが原因で発生します。これらの誤った傾向のセクションは短く、いつでも方向を逆にすることができます(そして、原則として、識別後すぐに逆になります);  したがって、誤った傾向でお金を稼ぐことは不可能です(偶然ではありません) 視覚的には、真と偽の傾向は最初は区別できません。さらに、ランダムな価格変動またはそれらが生成する誤った傾向は常に真の傾向に重ね合わされ、特に、新しい根本的な経済的原因によって引き起こされる逆転と識別および区別する必要がある真の傾向の後退を引き起こす可能性があります。                カジュアルチャネルインジケーターは、ランダムな価格変動チャネルをプロットすることにより、これ
The Quality trend indicator expresses the ratio of the strength of a trend or the speed of its growth (fall) to the degree of its noisiness or a certain norm of amplitudes of chaotic fluctuations of a growing (falling) price. The position of the indicator line above zero shows an increasing trend, below zero - a falling trend, the fluctuation of the indicator line near zero shows a flat. If the indicator line begins to fluctuate rapidly around zero and approach it, then this indica
An extremely convenient indicator that truly makes the process of making money on the exchange easy. It is based on the scientifically rigorous theory of the market developed by the author, the beginning of which is presented here .                The full algorithm of this indicator operation is presented in the article .               The indicator calculates the most probable price movement trajectory and displays it on the chart. Based on the predicted price movement trajectory
Firstly , the script estimates how many Mx bars of the chart (on which this script is applied) the future trend will most likely continue and what is its quality. Secondly (and most importantly), the script is an auxiliary tool for the extremely mathematically advanced and extremely effective ScientificTrade indicator in trading. The script calculates the optimal averaging period, which is also equal to Mx, of the ScientificTrade indicator, which gives the maximum profit according to the strate
The indicator visualizes the result of the   CalculateScientificTradePeriod    script (which, of course, also needs to be downloaded), which, firstly , estimates how many Mx bars of the active chart the future trend will most likely continue and what is its quality, and, secondly , calculates the optimal the averaging period (which is also equal to Mx) of the ScientificTrade   indicator, which gives the maximum profit according to the extremely effective   ScientificTrade strategy. For the FindS
フィルタ:
dimantes
24
dimantes 2025.08.19 12:23 
 

Индикатор Бомба!

xlxAxlx
1503
xlxAxlx 2024.08.01 06:52 
 

ユーザーは評価に対して何もコメントを残しませんでした

jerrylew2020
294
jerrylew2020 2022.08.04 02:12 
 

Excellent work. I use it.

SULA NOR
74
SULA NOR 2022.07.05 16:16 
 

ユーザーは評価に対して何もコメントを残しませんでした

mikenate
128
mikenate 2021.10.26 19:29 
 

thanks

Joleo Sagdullas
797
Joleo Sagdullas 2020.09.23 11:34 
 

ユーザーは評価に対して何もコメントを残しませんでした

Dr Waleed Mahdy
2652
Dr Waleed Mahdy 2019.11.06 16:55 
 

good

sunnychow
9043
sunnychow 2019.03.10 14:51 
 

ユーザーは評価に対して何もコメントを残しませんでした

レビューに返信