Conheça o Mercado MQL5 no YouTube, assista aos vídeos tutoriais
Como comprar um robô de negociação ou indicador?
Execute seu EA na
hospedagem virtual
hospedagem virtual
Teste indicadores/robôs de negociação antes de comprá-los
Quer ganhar dinheiro no Mercado?
Como apresentar um produto para o consumidor final?
Expert Advisors e Indicadores para MetaTrader 4 - 60

3 strategies with RSI! Alerts! Signal freshness check! The indicator is based on the classic RSI. I recommend watching my advisor - Night Zen EA It includes 3 strategies: Entry of the RSI indicator into the overbought zone (for buy trades) / oversold (for sell trades) Exit of the RSI indicator from the overbought zone (for sell trades) / oversold (for buy trades) Touching the overbought limit (for sell trades) / oversold (for buy trades) The indicator provides alerts. To enable them in the s
FREE
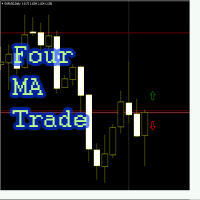
Советник "Four_MA_trade" входит в рынок по средним скользящим следующим образом: 1. две скользящие средние с большими периодами определяют общий тренд 2. две скользящие средние с малыми периодами определяют локальный тренд. Если направление общего и локального тренда совпадает, то на пересечении "локальных" средних скользящих открывается ордер. Возможно инвертирование сигнала, если период быстрой скользящей в настройках выставить больше по значению, чем период медленной. Для каждой валютной пар
FREE

The ' Average OHLC ZigZag ' indicator was designed for entry confirmations as well as scalping with a larger trend. A custom formula to average the last two bars to generate arrows following market trends with bar 1 confirmation.
Key Features An extreme scalper calculating the averages between the last two market periods to generate a buy or sell arrow. No settings are available due to it's simplicity of custom price action pattern and using repainting four OHLC prices.
Input Parameters ZigZa
FREE

ATSCStrategy is a versatile indicator designed for both binary options and forex markets. Empower your trading strategies with this dynamic tool, providing valuable insights for making informed decisions in the fast-paced world of binary options and forex trading.
-Forex Market
-Binary Option Market
-Binary use timeframe 1M - 5M
-Forex use timeframe M30 or high
FREE

This EA is literally a reverse of Recovery Zone Assistance, as its name says ... It is an assistant, an expert advisor that monitors all the orders for the asset in which it has been placed, no matter if that order was by some other expert advisor or by the trader placed on the Manually, he will start his work after each order that is negative. Find Recovery Zone Assistance on https://www.mql5.com/en/market/product/68909 This Expert Advisor is based on this sistem on video "Recovery Zone" on
FREE
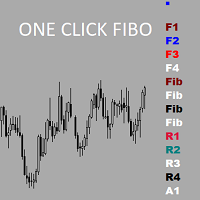
Утилита предназначена для упрощения графического анализа.Настроив один раз , можно сохранить в шаблон,все настройки сохранятся.В настройках меняются уровни фибоначчи , цвета,стили и толщина линий также текстовые метки на кнопках.Есть возможность расширить функционал , добавить временные зоны Фибоначчи ,Фибо арки ,линии по углу ,продление прямоугольных зон до текущей цены.Присылайте рекомендации,все можно осуществить в рамках бесплатной утилиты.
FREE

Current Pips and Money Profit This indicator displays the results of the currently open position on the graph. Result in pips and in the invoice currency. Thanks to this, you can enlarge the chart to the entire screen and have control over the result of trading without opening a terminal window which takes a space of a screen. The display positions of this data can be adjusted at the user's discretion and colors also.
FREE

This classic "old school" MAGIC MACD indicator gives you the cross of the parameters you set. Standart setting is (12,26,9) . The arrows give you a possible change of trend. Be careful and do not use this indicator as a single signal source.
FREE version Please feel free to check out our other REX indicator series. We do have other free indicators.
"OLD BUT GOLD"
FREE
Check out other great products from https://www.mql5.com/en/users/augustinekamatu/seller
This indicator is the best so far at estimating reversal points especially on high time frames. It does not repaint and is based on a combination of moving averages computed using custom functions. No inputs required, it is simple plug and play. The principles used ensure that it can be used on CFDs, Commodities and Stock with incredibly great results. With proper money management and portfolio balancing
FREE
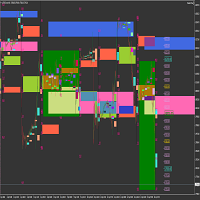
Market Viewer This utility seeks to assist the trader in identifying potential areas of interest on the price chart. Different components integral to decision making have been automated, allowing the user to engage with perfectly calculated levels. Some components include the weeks initial balance, session Min and Max areas and a round number indicator altogether forming templates providing confidence to the trader. Have a look at the screenshots for a sneak peak into the components. The utility
FREE
EA245 Draw Supply Demand v1 This EA only good for draw Supply and Demand, you can use draw with two Time Frame input (True/False). Manual Traders can use as tool for support and monitor the price near Supply and Demand before excute to open Buy or Sell orders Note: The result of Auto Trading normaly not good, so please consider select True or False open Order (item [11]). This EA for free so you can use and share for your friends. If you have any question, please contact our gruop via informatio
FREE

The CandleStick Scanner is a tool that allow you to perform a market scan and search any candlestick pattern that you already created in the current chart, You can perform a quick search in the current chart (500 bars will be scanned), This is a lite version of CandleStick Factory for MT4 . The full version video can be found here : https://www.youtube.com/watch?v=fq7pLXqVO94 The full version can be purchased here: https://www.mql5.com/en/market/product/75628
How it works Yo
FREE

Double Breakout is an automatic expert advisor with two separate strateges that uses martingale. The MACD indicator with adjustable parameters is used as inputs for each flow of orders. The specified takeprofit and stoploss levels are used to exit the position. General recommendation
The minimum recommended deposit is 1000 cents. Spread is recommended not more than 3 points. It is better to use trend currency pairs. The martingale parameter can be set from 0.1 to any value. When martingale i
FREE
Future WPR - or backward WPR - is a special modification of WPR: it uses standard formula, but applies it in reverse direction. The indicator calculates WPR from right to left, that is from the future to the past. It 'knows' and uses the future price movements at any bar where the right-side history provides sufficient number of "forthcoming" bars, that is period bars or more. Conventional WPR is also shown for reference. Both WPR and backward WPR are normalized to the range [0..1] as a more con
FREE

The " CatchTheWave EASY " adviser is a lightweight version of the adviser of the same name. This Expert Advisor uses many different strategies to determine the most accurate entry points into the market.
One of the key features of " CatchTheWave EASY " is the use of a grid when trading. This means that the Expert Advisor creates orders at various price levels, providing a potentially profitable position in any direction of the market. In addition, the Expert Advisor has the ability to effectiv
FREE

This indicator is designed to detect the best of all candlestick reversal patterns: Three Line Strike . According to the bestselling author and candlestick guru Thomas Bullkowski, this pattern has a winning percentage between 65% and 84% . This FREE Version of the Scanner scans only EURUSD and GBPUSD. The full version of the scanner can be found here: Three Line Strike Scanner 30 Instruments This indicator scans for you up to 30 instruments (forex, indices or commodities) on up to 8 timeframes.
FREE
The trade of this EA is based on The Commodity Channel Index (CCI)is a momentum-based oscillator used to help determine when an investment vehicle is reaching a condition of being uptrend or downtrend. with customizable lot size (use martingale or not), stop-loss, and take-profit levels. Easy to use and Simple Recommended Timeframe M30, H1 others timeframes with the appropriate settings. A low latency vps is always recommended. Works for ECN/Non-ECN brokers and 2-3-4-5 digit symbols Built-in
FREE
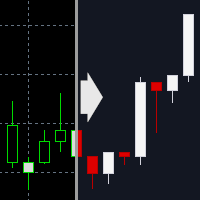
This indicator applies a dark theme to MetaTrader 4 charts. Designed for readability, it uses a calm color scheme to help reduce eye strain during long chart sessions. You can optionally apply the theme to all open charts at once. After applying, the indicator can also remove itself automatically, so nothing unnecessary remains on your chart.
Who this indicator is for Traders who want to quickly tidy up the look of MT4 Traders who find bright charts uncomfortable Traders who want to reduce eye
FREE

Pronto para turbinar seu jogo de negociação? Bullish Wave é o software de negociação totalmente automatizado que lhe dá a vantagem que você precisa para se tornar um comerciante lucrativo. Com análises poderosas, dados de mercado em tempo real e ferramentas intuitivas.
Com o Bullish Wave, você poderá negociar sem esforço no mercado forex como um profissional. Nosso EA totalmente automatizado funciona com dois indicadores líderes do setor: o indicador Bears Power e o indicador ADX. Abra posiçõe
FREE

Close All SELL Orders for MT4 script - closes absolutely all orders, whether pending or market ones.
Orders are closed at the current profit/loss indicators at the time of closing.
The script is suitable for moments when you need to quickly close all orders at the current indicators.
The script is very easy to use, just drag the script onto the chart and it will do its job.
Add me as a friend, I have many other useful products.
FREE

Ótima ferramenta utilitária onde você pode acompanhar em tempo real o Laverage da sua conta e o spread do símbolo Este saberá identificar com precisão os dados, poder saber, por exemplo, se tem conta Prop Firm, saber a Laverage correta e se o spread é manipulado, etc.
Combinação de indicador de alavancagem e spread. Ferramentas para automatizar a verificação da alavancagem e spread em sua conta de negociação. Trabalhando em todas as ações forex do corretor. Útil para monitorar, se o corretor f
FREE

This EA helps traders in the following benefits : - show the entry point for sell or buy orders that you makes. -show the TP & SL levels on chart - control the lot size - control the TP & SL level in points - works on all chart period - rising algo trading rank in your signal - closing all deals in one click - closing only profitable deals - closing only losable traders enjoy
FREE

This EA scalps using the Relative Strength Index (RSI) Indicator, Stochastic Oscillator Indicator, and Bollinger Bands Indicator to identify trend or counter-trend opportunities. As a multi-pair EA , it scans multiple currency pairs for signals. This EA comes with a variety of features, including Trailing, Risk Management, Money Management, Restriction Mode, and more. With the right settings, it has the potential to generate significant profits. Variable Values Description Trading_Indicator RSI,
FREE

The indicator informs when the current bar closes and a new bar opens. TIME is an important element of trading systems. BarTimerPro indicator helps you CONTROL THE TIME . Easy to use: place on the chart and set “alarms” if it necessary. In the tester, the indicator does not work. Key Features
Shows the time elapsed since the opening of the current bar Indicator Updates Every Second Setting the appearance (31-36) and the location (21-24) of the indicator, changing all texts (41-50). 4 types of “
FREE

Corretora Recomendada para usar esse indicador: CENT ACCOUNT https://tinyurl.com/5ftaha7c
Dsc Kamikaze Mt4 Expert Advisor desenvolvido por Diogo Sawitzki Cansi para operar abrindo trades através do RSI e fazendo um martingale diferente do normal para alavancar a conta mais rapidamente. Utilize apenas com capital que deseja arriscar tentar conseguir um lucro elevado rapidamente, porém, que pode perder. Qualquer estratégia de martingale sempre é de alto risco.
Parameters EA:
Set up different
FREE

EAsynRightNow - Professional Trading Expert Advisor for manual trading with advanced functionality
EAsyRightNow is a multifunctional trading Expert Advisor for MetaTrader 4, featuring a Trading Panel with a user-friendly interface and extensive trading position management capabilities. Perfect for scalping, it works on all timeframes.
Key Features
1. Trading Modes
- Single Orders: Management of one trading position
- Multiple Orders: Ability to open multiple orders in the same direction
- M
FREE

The standard RSI indicator is very helpful in identifying overbought or oversold areas during a flat, but gives a lot of false signals when the market is trending. For example: during an uptrend, the standard indicator often enters the "oversold" zone and extremely rarely (most often, when the trend has already ended) enters the "overbought" zone. This indicator takes into account the trend movement and, with the selected settings, can enter the zone opposite to the trend direction, giving a sig
FREE

Trading Assistant with Equity Security (TAwES)
This EA for helping manual trading (the EA will be activated when manual trade opened - Semi Auto)
- This EA will be triggered by manual trading/first OPEN TRADE
- If some manual trades have been opened and EA activated then all manual trades will be take over by EA separately.
- This EA feature can be a martingale with multiplier, max order, and the distance can be adjusted
- This EA will secure your Equity by max/loss Equity Setup.
FREE

This simple indicator takes information from Ichimoku Kinko Hyo to establish strong and weak currencies to pair together for ideal trending situations. It also generates buy or sell signals based on the standard deviation of returns together with currency strength. A currency is said to be strong or weak depending on where the price is in relation to two factors: if the price is above the daily kumo and above the 26 day Kijun-sen, it is said to be strong. Likewise, when trading below the daily k
FREE

The programmable signal panel analyzes the charts of all available symbols and timeframes and sends a notification about the appearance of a trading signal. You can program all the necessary signals using the free binding indicator "Signal Collection". The binding indicator is provided with open source code. Thus, it is possible to program all the necessary signals for subsequent use in conjunction with the signal panel. The signal panel can not only analyze charts, but also manage these chart
FREE

This indicator works by plotting fractals on the chart as arrows that can be used as buy or sell signals. It is a great tool for both new and experienced traders as it provides a clear visual representation of the market and helps traders identify fractals. Although it repaints, it can be used quite effectively in conjunction with other tools to filter trading strategies.
We use this indicator in this way in our RoyalFractals II Expert Advisor, which you can purchase on the MQL5 Market: https:
FREE

Introducing Momentum Jurik—an innovative indicator designed to optimize your forex trading strategy by incorporating custom moving averages based on the Momentum indicator with the MetaTrader 4 indicator, Momentum.
Jurik moving averages are renowned for their precision and reliability in analyzing price movements in the forex market. They provide traders with smoother representations of price action, reducing noise and offering clearer signals for identifying trends and potential reversals.
T
FREE

This indicator softens the value of the RSI (Relative Strength Index) and reduces its volatility. You can use this indicator in your expert advisors, indicators and strategies. With this indicator, you don't need to have two indicators on the chart at the same time. For example, an RSI indicator and a Moving Average indicator If you have any questions or concerns, contact me.
FREE

The indicator still has a few bugs but is ready for testing.
This is my first indicator that determines entry and exit points. The entry point is based on breaking the peaks determined by a channel indicating highs and lows (invisible channels). TP1 is a probable target at which most positions can be closed. The channel determining the opening and closing of positions is based on different assumptions. The red stop loss line is determined based on lows and highs.
The stop loss can be adjusted a
FREE

Indicator designed for both beginners and professionals. This indicator will help you: reduce the number of errors when opennig orders; predict price movement(in absent of significant news); do not rush to close profitable trades prematurely and increase profit; do not rush to enter the market and wait for "easy prey": and increase the profitability of trading. BUY and SELL signals, ALARM and PUSH - https://www.mql5.com/ru/market/product/127003
FREE
pappye indicator uses bolinger band to trigger it's signal ,it contain's pappye animation for alerting trading signals this alert is not continuous for the same arrow it will played 2 times only it could be used for any pair any time frame personally i prefer to inter a trade when there is to consecutive arrow in horizontal level after a breakout drift in a price but you could choose your way after trying the demo copy on your terminal
parameters fast : fast bolinger period slow : slow bolin
FREE
TDR gbpusd is an Expert Advisor designed to trade on gbpusd and other forex currencies. Best time frame: 1h. Minimum trading account 3000. This EA trading both direction of a market at the same time and opens multiple positions. This EA have 2 main modes: safe mode(MaximumRisk=0.01) extreme mode(MaximumRisk=0.02) for 5000$ account. setting can be modify by user: MaximumRisk / ProfitFactorMain / ProfitFactorPower this EA operates only once per bar closing, fast methods of optimization are vali
FREE

The Magic Dice is an expert advisor that trades during large markets movements. It’s using pending orders. I’m sharing with you this expert in order to find the best broker for live trading because this expert need a broker with low spread and very fast execution. So, thank you in advance for giving me your feedbacks on this subject Please note that this expert is designed to be profitable only in low spread condition. In the default setting I’m using a spread filter of 3.0 just for passing the
FREE

MP Gradient Adaptive RSI oscillator uses AMA with the basic RSI to cover the retracements with minimum lag. Trigger line crossing the oscillator will provide an entry point for trader.
Settings: RSI period: period of the oscillator Sensitivity of the oscillator: controls the sensitivity of the oscillator to retracements, with higher values minimizing the sensitivity to retracements. RSI applied price: source input of the indicator Number of bars to draw: is used when the Fill Type option is no
FREE
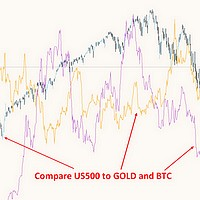
This free MT4 indicator allows you to easily compare as many symbols as you want! Make sure that the input symbol matches the name displayed in the Market Watch ***Please comment, rate and share it to your friends if you like it*** ------------------------------------------------------------------------------ Comparing trading pairs is useful for several reasons, including: Identifying relative strength: Comparing trading pairs can help traders identify which currency or asset is relatively stro
FREE
Description
The base of this indicator is an ZigZag algorithm based on ATR and Fibo retracement. This indicator is not redrawing in sense that the ZigZag's last shoulder is formed right after the appropriate conditions occur on the market. The shoulder doesn't change its direction afterwards (can only continue). Note: An indicator with advanced possibilities is also available.
Indicator input parameters
The input parameters allow to change the sensitivity of the ZigZag. ATR period ATR multip
FREE

Session Standard Deviation Date Range Analyzer: Evaluate the standard deviation of each bar's price (high, low, close, open, weighted, median, and typical) within defined trading sessions and date ranges, providing detailed insights into price volatility and market behavior. **Note:** When the trading platform is closed, the indicator may not load correctly. To ensure it works, you may need to load the indicator, unload it, and then load it again. **Note:** This indicator can only be used with
FREE

It computes BUY and SELL lot sizing in either % of balance or in fixed intervals. In market orders, this EA contains the adaptive slippage, logs tickets for instant confirmation of opening trades, and contains every market symbol at a glance. Real-time balance/equity display keeps margin health in view without tab-switching, toggling spread if needed for liquidity checks. Compact left-panel layout minimizes screen real estate, empowering blind trades where speed trumps overanalyze—perfect for
FREE

CCFp (Complex_Common_Frames percent) is a measure of currency strength.
Shows the total rate of change of “short-term moving average” and “long-term moving average” for each currency.
Supports eight major currencies: USD, EUR, JPY, CHF, GBP, AUD, CAD and NZD.
1). Displays the currency name at the right end of the graph.
2). You can change the display color of each currency.
3). Moving average smoothing type (ENUM_MA_METHOD) can be selected.
4). Price constant (ENUM_APPLIED_PRICE) can be c
FREE

This indicator calculates and draws lines over the chart. There are two types of trends: Trend A: the line is drawn using local lows for uptrends and local highs for downtrends Trend B: the line is drawn using local highs for uptrends and local lows for downtrends There are a few conditions, which have to be fulfilled and can be changed by the parameters (see also picture 4): MinBarAge : the count of bars to the last base point of a line is called BarAge and has to be greater than the parameter
FREE

The Multi-Timeframe High Low Points (MTF High Low Points) indicator is a powerful tool for traders using MetaTrader 4 (MT4) to analyze price movements across different timeframes. This versatile indicator helps traders identify significant support and resistance levels by displaying the highest and lowest price points within a specified number of bars on multiple timeframes simultaneously. Key Features: Multi-Timeframe Analysis: MTF High Low Points allows traders to monitor high and low price le
FREE

Индикатор сглаженного DeMarker Oscillator (xDeM)
Входные параметры: Period - период усреднения Принцип работы
Индикатор перерассчитывает стандартный технический индикатор DeMarker Oscillato r (дважды усредняет получаемые значения). Период усреднения индикатора соответствует двойному периоду стандартного DeMarker Oscillato r . Например : xDeM с периодом усреднения 7 соответствует DeM c периодом 14. Индикаторный буфер не перерисовывается.
FREE

Salva EA Free is an advanced and fully automated system, which passes backtesting since 2005. The basis of this strategy is the price chart itself, trading is performed based on the price movement range. Dynamic algorithms and filters are used for taking profit or closing trades. Built-in reworked system for filtering market entries and exits: Checking the trading direction using integrated trend indicators. Checking the channel range for the minimum and maximum values. Checking for the price ex
FREE

MTF (Multi-Timeframe) Countdown Timer indicator, designed for MetaTrader 4 (MT4). The indicator displays the remaining time for new candles across multiple timeframes, along with other essential trading information such as server time, local time, and the spread of custom currency pairs. Features: Multi-Timeframe Countdown : Displays the time remaining for the next candle in up to six configurable timeframes, such as M5, H1, or D1. Customizable Appearance : Background, border, and text colors ca
FREE

Genaral: Not martingale, not a grid; Use on EURUSD Use on M5
Signals: There is a good rational algorithm. Work of two indicators: 2 DeMarker (from 2 timeframes) (you can set a separate Timeframe for each indicator)
Stop Loss/Take Profit: There is a good money management system (there are several type for trailing stop loss); There is virtual levels of Stop Loss / Take Profit; There is smart lot (percent by risk) or fix lot
Important: EA can work on closed candles, and on current candles;
FREE

Kusama is an automated trading system that uses and candlestick patterns in combination with Standard Deviation calculations to open and close trades. This Expert Advisor is designed specifically for the USDJPY H1 Foreign Exchange(FX) market to open, monitor, modify and adjust orders automatically.
Entry signals utilize Shooting Star Candlestick patterns and Hammer Candlestick patterns . Long Exit Signals work on the Bearish Engulfing Candlestick patterns in combination with Standard Deviati
FREE

The OHLC indicator shows the current and historical values of High, Low, Open, Close and Mid for a specific time period. It can plot the current values or the values from the previous session. The indicator's range can be calculated from a daily, weekly, monthly, or user-specified session.
Levels High of the current or previous session. Low of the current or previous session. Open of current or previous session. Close of the current or previous session. Midpoint of the current or prev
FREE

The indicator displays the size of the spread for the current instrument on the chart. Very flexible in settings. It is possible to set the maximum value of the spread, upon exceeding which, the color of the spread label will change, and a signal will sound (if enabled in the settings). The indicator will be very convenient for people who trade on the news. You will never enter a trade with a large spread, as the indicator will notify you of this both visually and soundly. Input parameters: Aler
FREE

The indicator summarizes all open positions. Settings: HeaderTextColor = Yellow; // Header text color FooterTextColor = Yellow; // Text color in totals ProfitColorPositive = Lime; // Color for gain values ProfitColorNegative = Red; // Color for loss values SeparatorColor = Gray; // Color for separators FontSize = 12; // Text size LineSpacing = 15; // Line spacing FontName = "Courier New"; // Font name TableCorner = 0; // 0: Top
FREE
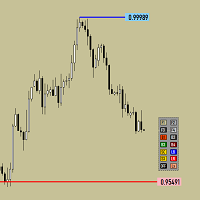
Утилита предназначена для изменения фона графика ,одним нажатием кнопки. Помимо изменения фона ,утилита также может менять цвет баров и свечей на графике.Из дополнительных опций ,это изменение размера графика а также линии с ценовой меткой.Панель можно включить и выключить,что дает возможность не захламлять график.Кнопка B2 помимо изменения цвета баров ,снимает выделение со всех объектов на графике.
FREE

You have good intuitions, but you want more from your trade ... or you are a tireless hedger .
Would it be very useful for you if the TP moves further and further with configurable response times and offsets price ?
Imagine: You have a buy order on a bullish day on Dow Jones. You set a "take profit" at 200 points, but you know he can give you more!
Attach "Orions Move Target" to any chart and it will pass all the open orders in the terminal, moving them following these 3 trivial parameters:
1) "
FREE

Acceleration/Deceleration Technical Indicator (AC) measures acceleration and deceleration of the current driving force. This indicator will change direction before any changes in the driving force, which, it its turn, will change its direction before the price. If you realize that Acceleration/Deceleration is a signal of an earlier warning, it gives you evident advantages. But, a classical AC indicator does not include any input parameter. In the source file we can see that this indicator are us
FREE

The EA in the form of histogram displays up and down trends. This tool is recommended to be used as a filter. Its readings will help to detect beginning, end, and continuation of a trend. This additional tool will suit any trading system. Parameters Period — indicator period; Bars — number of bars on the history.
FREE

Full Automated Trading panel . it works on any trading instruments: Forex, Stocks, Futures, Indices, CFD, Bonds, Cryptocurrencies; interface minimization function; flexibility of use;
Join my channel and check video of it ===> https://t.me/Ash_TheTrader/4986
Features :
Auto SL and TP Auto Close partial Auto Trailing Session Time Alert Time of trading Alert Profit and Percentage and etc.
FREE
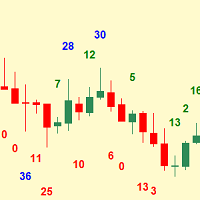
Simplest indicator for bar shadows. Very useful for Kangaroo Tail strategy.
"Shadows" - this is the distance from high and close of the bull bar and low and close of the bear bar. The purpose of the shadow is to show you if the bar is strong or not. Whether it is internal to the trend or is external. It even helps determine if a trend is starting. Input arguments: How many prevoius bars to calculate Value that should be passed to trigger the alarm How many times to repeat the alarm (Put 0 if yo
FREE

Lampropeltis is a trend indicator. The algorithm of calculation is based on data from the standard indicators included in the MT4 package and interpretation of patterns formed by these indicators. The settings include a minimum set of parameters: Slow MA - slow MA period; Slow MA method - slow MA smoothing method; Fast MA - fast MA period; Fast MA method - fast MA smoothing method. Change of the signal color to red indicates the possibility of opening a Sell order. Change of the signal color to
FREE
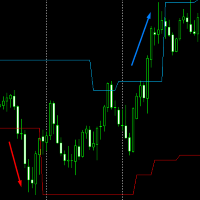
Volatility Channel from JagzFX helps you find breakouts by displaying a channel on the price chart. Volatility Channel is simple to use - there are no parameters - and works on any timeframe. BASIC USE of Volatility Channels The channel can be used as a 'No Trade Zone': you don't trade when the price is inside the channel. However:
When the price breaks above the channel: go Long. When the price breaks below the channel: go Short. The indicator works on all timeframes to suit your trading style.
FREE
Elan: Melhore Sua Experiência de Trading no MT5 e MT4 Você está procurando elevar sua eficiência de trading e aproveitar ao máximo seu tempo no MT5 ou MT4? Não procure mais além do Elan, um poderoso assistente de trading projetado para otimizar e simplificar sua experiência de trading. Elan oferece um conjunto completo de recursos para apoiar suas necessidades de trading: Gestão de Posições : Gerencie facilmente suas posições com opções visuais de fechamento, oferecendo uma visão clara dos lucr
FREE
The indicator determines overbought/oversold zones on various timeframes. Arrows show market trend in various time sessions: if the market leaves the overbought zone, the arrow will indicate an ascending trend (arrow up), if the market leaves the oversold zone, the arrow will indicate a descending trend (arrow down). Situation on the timeframe, where the indicator is located, is displayed in the lower right window. Information on the market location (overbought or oversold zone), as well as the
FREE
Concept:
This indicator will help you find Spike Bar. 1/ Check Yesterday Range (Open-Close ) 2/ Check Today pips: Price from Daily Open to current price (Bid/Ask) Then alert for you when the pips range of current candle is equal to or greater than the user defined minimum range. This indicator is related to Strategy: Daily Range Spike and Pull Back, you can find it on FFX forum
FREE

MultiFiboDynamicMT4 is a powerful, professional indicator for estimating the most important support and resistance levels. The main advantage is that it plots the Fibonacci levels at all timeframes simultaneously, which allows the trader to see the full picture of the possible price movement of the trading instrument!
Advantages of the indicator The indicator is perfect for scalping and trading binary options. Suitable for beginners and experienced traders. Works on all timeframes. Works on any
FREE

Why do you need this script? If you place lots of orders and re-calculate your risk for every order you placed, you definitely need such a script. This script places one or (optional) two different orders with the following script inputs.
Utility parameters Operation Type - "Buy","Sell","Buylimit","Selllimit","Buystop","Sellstop" Price - Entry price of the order(s). Stop Loss - Stop Loss of the order(s). Take Profit 1 - Take Profit of the first order. Take Profit 2 - Take Profit of the second o
FREE
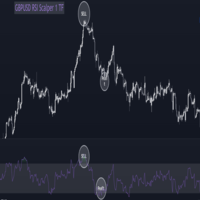
What is RSI:-
RSI stands for Relative Strength Index, which is a popular technical indicator used in financial markets, particularly in the analysis of stocks, commodities, and other securities. RSI is used by traders and investors to assess the strength and potential direction of price movements in an asset. Here's how RSI works: Calculation : RSI is calculated using a formula that takes into account the average gain and average loss over a specified period (typically 14 periods). The formula
FREE

Targets is an indicator to determine potential turning points , targets are calculated to determine levels in which the sentiment of the market could change from "bullish" to "bearish." This indicator can be used in any timeframe and any currency pair: IN CASE YOU DON'T SEE THE INDICATOR WHEN YOU ADD IT TO YOUR CHARTS JUST OPEN THE INDICATOR MENU AND CLOSE THE MENU AGAIN PLEASE TAKE NOTICE: For best results use this indicator as an extra tools after you have completed your regular analysis an
FREE

Olá!
Sou Tatsuron, um investidor de varejo japonês. Gerenciamos mais de 1 bilhão de ienes em Forex.
Então, deixe-me apresentar um indicador muito útil que uso.
O indicador que é a base do preço de mercado.
A ThreeLine melhorou a média móvel (SMA) para responder às configurações numéricas de SMA de longo prazo.
Quanto mais você repetir as negociações e verificações diárias, mais confiável será a Três Linhas.
Se o ângulo de ThreeLine for para cima, ele será branco. Se estiver voltado para
FREE
Você sabe por que o mercado MetaTrader é o melhor lugar para vender as estratégias de negociação e indicadores técnicos? Não há necessidade de propaganda ou software de proteção, muito menos problemas de pagamentos. Tudo é providenciado no mercado MetaTrader.
Você está perdendo oportunidades de negociação:
- Aplicativos de negociação gratuitos
- 8 000+ sinais para cópia
- Notícias econômicas para análise dos mercados financeiros
Registro
Login
Se você não tem uma conta, por favor registre-se
Para login e uso do site MQL5.com, você deve ativar o uso de cookies.
Ative esta opção no seu navegador, caso contrário você não poderá fazer login.